Elevated Vibration Perception Thresholds in
CIDP Patients Indicate More Severe
Neuropathy and Lower Treatment Response
Rates
Alon Abraham1, Hana Albulaihe2, Majed Alabdali3, Mohammad Qrimli1, Ari Breiner1, Carolina Barnett1, Hans D. Katzberg1, Leif E. Lovblom4, Bruce A. Perkins4, Vera Bril1*
1Ellen and Martin Prosserman Centre for Neuromuscular Diseases, Division of Neurology, Department of Medicine, University Health Network, University of Toronto, Toronto, Canada,2Department of Neurology, King Khalid University Hospital, King Saud University, Riyadh, Saudi Arabia,3Department of Neurology, King Fahad Hospital of the University, University of Dammam, Dammam, Saudi Arabia,4Division of Endocrinology and Metabolism, Department of Medicine, Mount Sinai, Hospital and Lunenfeld Tanenbaum Research Institute, University of Toronto, Toronto, Canada
*vera.bril@utoronto.ca
Abstract
Introduction
Vibration perception threshold (VPT) examination using a neurothesiometer provides objec-tive, sensitive and specific information, and has been utilized mainly in patients with diabetic polyneropathy.
Objectives
Explore the utility of VPT examination in CIDP patients.
Methods
CIDP subjects attending the Neuromuscular clinic between 01/2013 and 12/2014 were evaluated. Demographic data, clinical history, physical examination, VPT values, and electrophysiologic data from their charts were extracted.
Results
70 charts were reviewed. 55 CIDP patients had elevated VPT, associated with higher fre-quency of abnormal sensory testing for various modalities (92.7% vs. 46.7%, p<0.0001), lower sensory and motor amplitudes and reduced conduction velocities on nerve conduc-tion studies, and lower treatment response rates (54% vs. 93%, p = 0.01).
OPEN ACCESS
Citation:Abraham A, Albulaihe H, Alabdali M, Qrimli M, Breiner A, Barnett C, et al. (2015) Elevated Vibration Perception Thresholds in CIDP Patients Indicate More Severe Neuropathy and Lower Treatment Response Rates. PLoS ONE 10(11): e0139689. doi:10.1371/journal.pone.0139689
Editor:Claudia Sommer, University of Würzburg, GERMANY
Received:June 12, 2015
Accepted:September 16, 2015
Published:November 6, 2015
Copyright:© 2015 Abraham et al. This is an open access article distributed under the terms of the Creative Commons Attribution License, which permits unrestricted use, distribution, and reproduction in any medium, provided the original author and source are credited.
Data Availability Statement:All relevant data are within the paper and its Supporting Information file.
Funding:The authors have no support or funding to report.
Conclusion
VPT examination is a simple tool, which is a reliable and sensitive measure not only for dia-betic neuropathy, but also for CIDP. Moreover, in CIDP, elevated VPT values are also asso-ciated with lower treatment response rates.
Introduction
Sensory system evaluation is an important part of the neurological examination. However, it might be occasionally challenging, as it depends on patient cooperation. Primary sensory modalities commonly examined include light touch, pain, temperature, proprioception and vibration sensation. There are 2 different approaches for sensory testing. The first is compara-tive, identifying relative differences between sites (e.g. distal and proximal), or qualitative (e.g. presence or absence of vibration sensation), and the second is absolute, attempting to grade thresholds objectively[1]. Absolute sensory testing is useful in medical practice, and can pro-vide sensitive and reliable neuropathic endpoints for epidemiological studies and therapeutic trials[2]. Vibration perception thresholds (VPT) examination, is an example of absolute sen-sory testing, using different devices, such as a neurothesiometer, or case IV device, and pro-vides more objective information, and is more sensitive and specific for detecting changes in sensory nerve function, than qualitative clinical vibration sense testing (VQT). VQT is com-monly performed as part of the routine neurological examination, and usually provides limited information for the presence or absence of vibration sensation only[3], although a semi qualita-tive vibration sense testing also exists, using a graduated tuning fork. Similar to VQT, VPT test-ing is simple, quick to perform ustest-ing some tests paradigms, as methods of limits[4], painless and is generally well tolerated[5].
Chronic inflammatory demyelinating polyneuropathy (CIDP) is an immune-mediated neu-ropathy characterized by motor greater than sensory, proximal and distal peripheral neuropa-thy, with a slowly progressive or relapsing course. Subjective sensory disturbance is present in 68–80% of CIDP patients, with abnormal sensory examination in most, particularly for large-fiber modalities, such as vibration and proprioception[6]. Although VPT has proven to be a reliable measure of confirmed clinical neuropathy and abnormal nerve conductions studies (NCS) in patients with diabetic polyneuropathy[5], there is no literature regarding its utility in CIDP patients, namely correlation to clinical and electrophysiological testing, and the associa-tion with treatment response rates.
Materials and Methods
Subjects
CIDP subjects attending the Neuromuscular clinic for management of their immune-mediated polyneuropathy between 01/2013 and 12/2014 were evaluated for this study. In this retrospec-tive review we extracted demographic data, clinical history, physical examination, and electro-physiologic data from their charts. The Research Ethics Board of the University Health Network approved the current study protocol, based on chart review and collection of de-iden-tified data.
were evaluated by clinical history, neurological examination (including VQT), vibration per-ception thresholds (VPT), and NCS.
Treatment responsiveness was assessed by combining data from the clinical history, neuro-logical examination, and the electrodiagnostic tests results, which was performed as part of the routine follow up evaluation. Treatment responders were defined as those who stabilized after declining progressively, or improved after treatment, whereas treatment non-responders were defined as those who either worsened or did not change after treatment.
Abnormal VQT was defined as absence vibration perception at the toes, using a standard 128 Hz tuning fork, as part of the routine neurological examination.
VPT testing was performed with a Neurothesiometer, using the method of limits[8]. The stimulus was applied to the distal pulp of the first finger and toe on each side, and the patient was requested to indicate when vibration sensation was first perceived. Stimulus strength was gradually increased from null intensity to a value in voltage at which the subject first detected vibration. Testing was carried out with the subject’s eyes closed. Three separate tests were con-ducted, and a mean of the three values was calculated in volts. A‘null stimulus’trial was added randomly to ensure the subject’s adherence and understanding. Testing generally required less than 3 min. Normal values were considered as 5 volts or less in the fingers, and 15 volts or less in the toes[9].
NCS were performed using the Sierra Wave instrument (Cadwell Laboratories Inc., Kenne-wick, WA, USA). Age- and height-adjusted NCS reference values were used, according to the standards of the Toronto General Hospital (University Health Network) electrophysiology lab-oratory. Limb temperature was measured prior to nerve conduction studies, and if required, warming was performed to ensure a surface temperature of32.0°C in the hands and31.0°C in the feet.
Median, ulnar, peroneal, tibial and sural NCS were performed using surface stimulating and recording techniques according to the standards of the Canadian Society of Clinical Neuro-physiology and the American Association of Neuromuscular and Electrodiagnostic Medicine [10]. The electromyography Instrument calculated latencies, amplitudes and conduction veloc-ities automatically. Median, peroneal and tibial nerve compound motor action potential (CMAP) amplitudes were measured from first negative peak to the next positive peak. Median, and sural sensory nerve action potential (SNAP) amplitudes were also measured from the first positive peak if present, to the next positive peak
Statistical analysis
Statistical analysis was performed using SAS version 9.2 for Windows (SAS Institute, Cary, North Carolina). Clinical and electrophysiological characteristics were expressed as
mean ± standard deviation (SD) for continuous variables, or as frequency and percent for ordi-nal variables. Comparisons between groups were made using the student’s t-test, the Wilcoxon rank-sum test, or theχ2-test, depending on the type and distribution of the variable. Receiver
sensitivity. Additionally, VQT was treated as a dichotomous test for identifying the same abnormal NCS parameters. P-values less than 0.05 were considered statistically significant.
Results
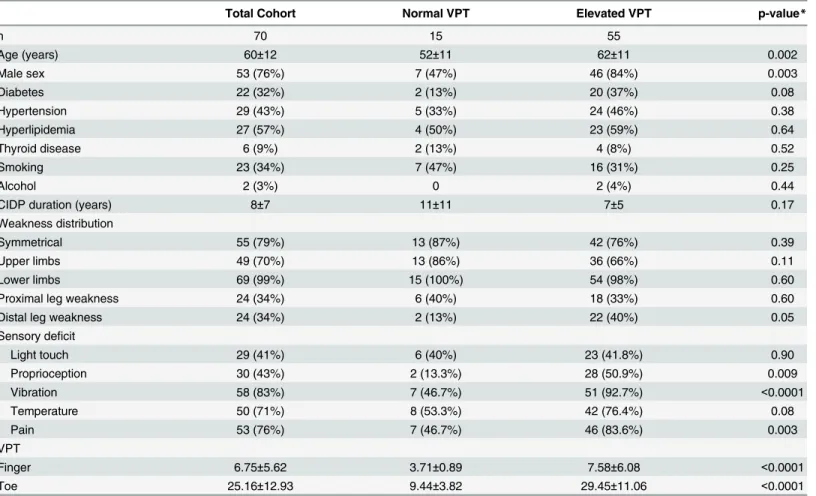
70 CIDP patients’charts were reviewed. Their demographic data is shown inTable 1. 55 CIDP patients had elevated VPT, while 15 patients had normal values. Patients with elevated VPT were older (62±11 vs. 52±11, p = 0.002), with male predominance (84% vs. 47%, p = 0.003). Abnormal sensory testing for various modalities on neurological examination was more fre-quent in CIDP patients with elevated VPT at the toes (92.7% vs. 46.7%, p<0.0001), including
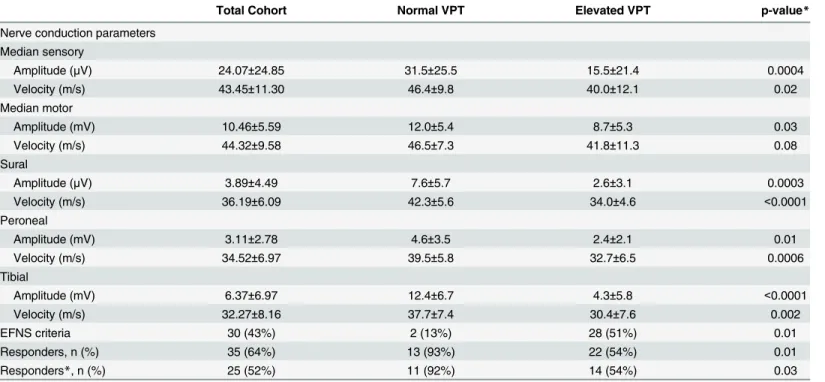
VQT (92.7% vs. 46.7%), proprioception (50.9% vs. 13.3%, p = 0.009), and pain perception (83.6% vs. 46.7%, p = 0.003) testing, with a trend toward distal lower limb weakness (40% vs. 13%, p = 0.05). CIDP patients with elevated finger VPT had lower median nerve sensory and motor amplitudes (15.5±21.4 vs. 31.5±25.5μV, p = 0.0004, and 8.7±5.3 vs. 12.0±5.4 mV, p = 0.03), as well as reduced sensory conduction velocities (40.0±12.1 vs. 46.4±9.8 m/s, p = 0.02). CIDP patients with elevated toe VPT had also lower sural, peroneal and tibial nerves amplitudes (2.6±3.1 vs. 7.6±5.7μV, p = 0.0003, 2.4±2.1 vs. 4.6±3.5 mV, p = 0.01, and 4.3±5.8
Table 1. Clinical characteristics of CIDP patients with normal and abnormal VPT.
Total Cohort Normal VPT Elevated VPT p-value*
n 70 15 55
Age (years) 60±12 52±11 62±11 0.002
Male sex 53 (76%) 7 (47%) 46 (84%) 0.003
Diabetes 22 (32%) 2 (13%) 20 (37%) 0.08
Hypertension 29 (43%) 5 (33%) 24 (46%) 0.38
Hyperlipidemia 27 (57%) 4 (50%) 23 (59%) 0.64
Thyroid disease 6 (9%) 2 (13%) 4 (8%) 0.52
Smoking 23 (34%) 7 (47%) 16 (31%) 0.25
Alcohol 2 (3%) 0 2 (4%) 0.44
CIDP duration (years) 8±7 11±11 7±5 0.17
Weakness distribution
Symmetrical 55 (79%) 13 (87%) 42 (76%) 0.39
Upper limbs 49 (70%) 13 (86%) 36 (66%) 0.11
Lower limbs 69 (99%) 15 (100%) 54 (98%) 0.60
Proximal leg weakness 24 (34%) 6 (40%) 18 (33%) 0.60
Distal leg weakness 24 (34%) 2 (13%) 22 (40%) 0.05
Sensory deficit
Light touch 29 (41%) 6 (40%) 23 (41.8%) 0.90
Proprioception 30 (43%) 2 (13.3%) 28 (50.9%) 0.009
Vibration 58 (83%) 7 (46.7%) 51 (92.7%) <0.0001
Temperature 50 (71%) 8 (53.3%) 42 (76.4%) 0.08
Pain 53 (76%) 7 (46.7%) 46 (83.6%) 0.003
VPT
Finger 6.75±5.62 3.71±0.89 7.58±6.08 <0.0001
Toe 25.16±12.93 9.44±3.82 29.45±11.06 <0.0001
For categorical variables, the results are given as frequency and percent. For continuous variables, the results include mean and standard deviation. VPT—vibration perception thresholds
CIDP—Chronic inflammatory demyelinating polyneuropathy
vs. 12.4±6.7 mV, p =<0.0001 correspondingly), and reduced conduction velocities (34.0±4.6 vs.
42.3±5.6 m/s, p<0.0001, 32.7±6.5 vs. 39.5±5.8 m/s, p = 0.0006, and 30.4±7.6 vs. 37.7±7.4 m/s,
p = 0.002 correspondingly). Although a higher number of CIDP patients with elevated VPT ful-filled EFNS/PNS electrophysiological criteria for CIDP (51% vs. 13%, p = 0.01), treatment response rates were lower significantly in this group (54% vs. 93%, p = 0.01). Similar responder rate are shown after excluding CIDP patients with diabetes (54% vs. 92%, p = 0.03) (Table 2). Similar results are obtained by VQT (Table 3).
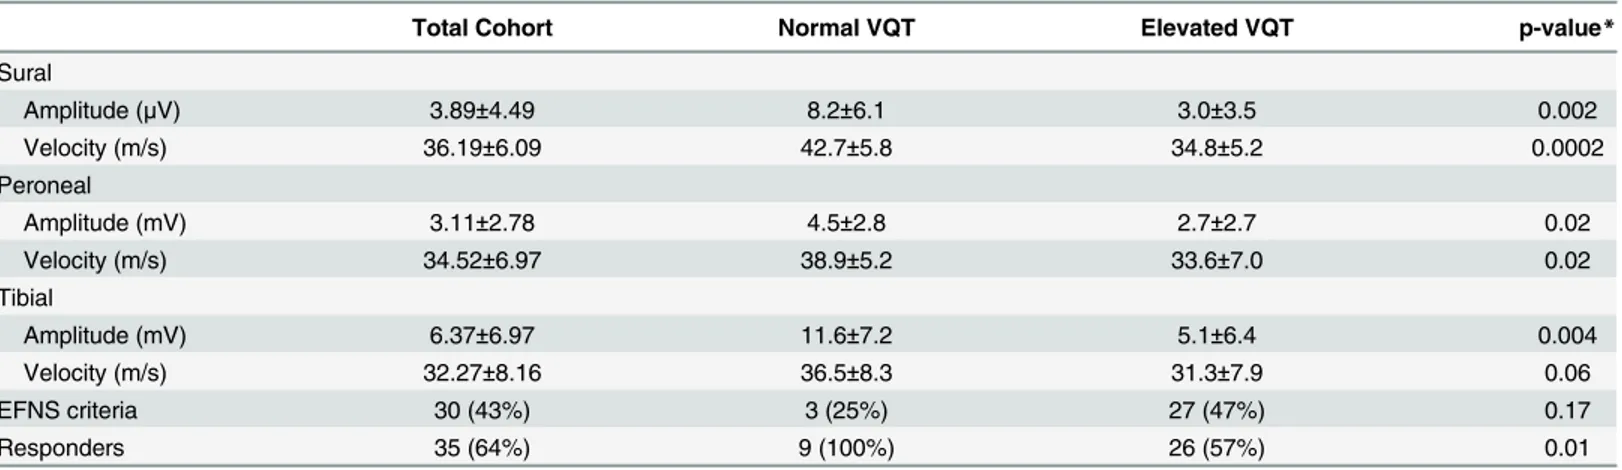
Similar associations were observed in CIDP patients with abnormal VQT, showing high sensitivity for detecting lower limb sensory and motor nerve conduction abnormalities, and lower treatment response rates (57% vs. 100%, p = 0.01). However, VQT was less specific com-pared to VPT testing (Table 4).
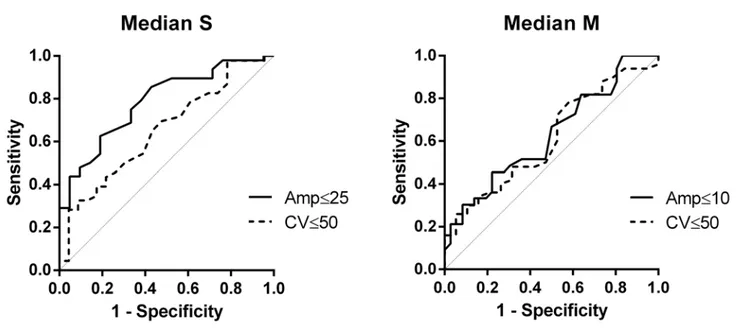
VPT receiver operating characteristic ROC area under curves were generally high, especially for sural nerve amplitude (0.83), conduction velocity (0.84), and tibial nerve motor amplitude (0.87) (Figs1and2).
Discussion
The current study shows that elevated VPT in CIDP patients is associated with a more severe neuropathy, manifested by worse clinical and electrophysiological examinations (Tables1and
2). Although similar results are obtained by VQT (Table 3), showing high sensitivity for detect-ing abnormal NCS (around 85%), VQT is less specific compared to VPT (Table 4). High
Table 2. Electrophysiological characteristics of CIDP patients with normal and abnormal VPT.
Total Cohort Normal VPT Elevated VPT p-value*
Nerve conduction parameters Median sensory
Amplitude (μV) 24.07±24.85 31.5±25.5 15.5±21.4 0.0004
Velocity (m/s) 43.45±11.30 46.4±9.8 40.0±12.1 0.02
Median motor
Amplitude (mV) 10.46±5.59 12.0±5.4 8.7±5.3 0.03
Velocity (m/s) 44.32±9.58 46.5±7.3 41.8±11.3 0.08
Sural
Amplitude (μV) 3.89±4.49 7.6±5.7 2.6±3.1 0.0003
Velocity (m/s) 36.19±6.09 42.3±5.6 34.0±4.6 <0.0001
Peroneal
Amplitude (mV) 3.11±2.78 4.6±3.5 2.4±2.1 0.01
Velocity (m/s) 34.52±6.97 39.5±5.8 32.7±6.5 0.0006
Tibial
Amplitude (mV) 6.37±6.97 12.4±6.7 4.3±5.8 <0.0001
Velocity (m/s) 32.27±8.16 37.7±7.4 30.4±7.6 0.002
EFNS criteria 30 (43%) 2 (13%) 28 (51%) 0.01
Responders, n (%) 35 (64%) 13 (93%) 22 (54%) 0.01
Responders*, n (%) 25 (52%) 11 (92%) 14 (54%) 0.03
For categorical variables, the results are given as frequency and percent. For continuous variables, the results include mean and standard deviation EFNS—European Federation of Neurological Societies
VPT—vibration perception thresholds
CIDP—Chronic inflammatory demyelinating polyneuropathy Responders*—excluding patients with diabetes.
sensitivity of VPT testing is also expressed by high ROC AUC, especially for sural nerve ampli-tude (0.83), conduction velocity (0.84), and tibial nerve motor ampliampli-tude (0.87) (Figs1and2).
As CIDP involves multiple sensory and motor nerves, it is not surprising that abnormal sen-sory testing in one sensen-sory modality, such as vibration, is associated with sensen-sory abnormalities in other modalities, and even with a trend for distal leg weakness. Similarly, there is
electrophysiological evidence not only for worse sensory NCS, but also for worse motor NCS, manifested by reduced amplitudes and lower conduction velocities. These findings imply that VPT testing is a reliable and a sensitive measure for CIDP.
An additional important finding in this study is the association of abnormal vibration test-ing and lower treatment response rates in CIDP patients. A similar association is shown after excluding CIDP patients with diabetes, although the have higher percentage of abnormal vibration sensation. Although 60 to 80 percent of CIDP patients are expected to respond to
Table 3. Electrophysiological characteristics and treatment response rates in the presence of normal and abnormal vibration manual testing in CIDP patients.
Total Cohort Normal VQT Elevated VQT p-value*
Sural
Amplitude (μV) 3.89±4.49 8.2±6.1 3.0±3.5 0.002
Velocity (m/s) 36.19±6.09 42.7±5.8 34.8±5.2 0.0002
Peroneal
Amplitude (mV) 3.11±2.78 4.5±2.8 2.7±2.7 0.02
Velocity (m/s) 34.52±6.97 38.9±5.2 33.6±7.0 0.02
Tibial
Amplitude (mV) 6.37±6.97 11.6±7.2 5.1±6.4 0.004
Velocity (m/s) 32.27±8.16 36.5±8.3 31.3±7.9 0.06
EFNS criteria 30 (43%) 3 (25%) 27 (47%) 0.17
Responders 35 (64%) 9 (100%) 26 (57%) 0.01
VQT—qualitative clinical vibration sense testing
CIDP—Chronic inflammatory demyelinating polyneuropathy EFNS—European Federation of Neurological Societies
doi:10.1371/journal.pone.0139689.t003
Table 4. Sensitivities and Specificities of Vibration perception thresholds and vibration manual testing for abnormal nerve conduction studies.
VPT VQT
Sensitivity Specificity Sensitivity Specificity
Sural
Amplitude (μV) 82% 57% 89% 43%
Velocity (m/s) 90% 68% 94% 47%
Peroneal
Amplitude (mV) 75% 50% 84% 36%
Velocity (m/s) 81% 64% 86% 36%
Tibial
Amplitude (mV) 87% 59% 91% 47%
Velocity (m/s) 83% 64% 87% 45%
VPT—vibration perception thresholds
VQT—qualitative clinical vibration sense testing
treatment, it is difficult to predict treatment responsiveness. Prediction of outcome has been related to the pattern of weakness[11], the presence of monoclonal gammopathy[12], distribu-tion patterns of conducdistribu-tion abnormalities[13,14], the selection of electrodiagnostic criteria[15], and disease duration[16].
Lower treatment response rates in CIDP patients with abnormal vibration perception might be expected at least theoretically, due to a more severe neuropathy, as reflected by worse clinical and electrophysiological findings, which might be associated with more widespread irreversible nerve fiber loss. However, the largest study of IVIG in CIDP patients to date has shown that advanced loss of axons does not lead to failure to respond to treatment[17,18]. Therefore, lower treatment response rates in this cohort of CIDP patients with abnormal vibration testing is sur-prising, suggesting vibration testing as a unique tool that might assist predicting treatment
Fig 1. VPT Finger.AUC for Median S Amp = 0.79 and Median S CV = 0.66. AUC for Median M Amp = 0.63 and Median M CV = 0.61.
doi:10.1371/journal.pone.0139689.g001
Fig 2. VPT Toe.AUC for Sural Amp = 0.83 and Sural CV = 0.84. AUC for Peroneal Amp = 0.75 and Peroneal CV = 0.72. AUC for Tibial Amp = 0.87 and Tibial CV = 0.75.
response rates in CIDP. Nonetheless, it should be emphasized that even in the presence of abnor-mal VPT, more than half the patients do respond to treatment. As a rule, we used IVIG as a first line treatment for CIDP patients (using a loading dose of 2 g/kg, followed by monthly infusions of 1 g/kg), utilizing additional immunomodulatory treatments in case of treatment failure.
The finding of an older age in CIDP patients with elevated VPT is not surprising, as age affects peripheral nerve function. In addition, higher VPT values were also found among older patients with diabetic polyneuropathy[5]. In contrast, we do not have a satisfying explanation for male predominance in CIDP patients with abnormal VPT in our study. Although age and sex does not affect treatment response rates, fulfilling EFNS/PNS electrophysiological criteria is known to be associated with higher treatment response rates[12,15]. Although a higher num-ber of CIDP patients with abnormal VPT in the current study fulfilled EFNS/PNS electrophysi-ological criteria for CIDP (51% vs. 13%, p = 0.01), surprisingly they had lower treatment response rates (54% vs. 93%, p = 0.01), implying that predicting treatment responsiveness using EFNS/PNS criteria might be limited. As abnormal VPT were associated with worse NCS, higher frequency for fulfilling EFNS/PNS criteria within these patients is not surprising.
The current study has several limitations. First, although only statistically significant results were considered, the numbers are low, mainly in CIDP patients with normal vibration testing. In addition, misclassification and selection bias are potential errors, as there are no biomarkers to make a definitive diagnosis of CIDP. There are additional neuropathies causing proximal weakness, such as diabetic radiculoplexopathies, and slowing of conduction velocity might be due to loss of ion channels in the inter-nodal region or other factors without true demyelin-ation. Current electrodiagnostic criteria for CIDP also have limited sensitivity, as they are research oriented, favouring specificity over sensitivity [19]. And finally, the lack of reliable biomarkers is not limited only for the diagnosis of CIDP, but also for assessing treatment responsiveness. Although this can be usually done reliably combining information from the clinical history, disability and functional questioners, and from clinical and electrophysiologi-cal examinations, misclassification is still a potential concern.
In conclusion, VPT examination is a simple tool, which is a reliable and sensitive measure not only for diabetic neuropathy, but also for evaluating CIDP severity. Moreover, in CIDP ele-vated VPT are also associated with lower treatment response rates, although still more than half of patients will respond to treatment. Prospective trials are required in order to confirm these findings, and further explore the utility of VPT testing in other neuropathies.
Supporting Information
S1 Database.
(XLS)
Acknowledgments
All authors reviewed the manuscript for scholarly content and accuracy. V.B. is the corre-sponding author and guarantor of this manuscript and, as such, had full access to all the data in the study and takes responsibility for the integrity of the data and the accuracy of the data analysis.
Author Contributions
References
1. Burns TM, Taly A, O'Brien PC, Dyck PJ. Clinical versus quantitative vibration assessment: improving clinical performance. J Peripher Nerv Syst. 2002; 7: 112–117. PMID:12090297
2. Dyck PJ, O'Brien PC. Quantitative sensation testing in epidemiological and therapeutic studies of peripheral neuropathy. Muscle Nerve. 1999; 22: 659–662. doi:10.1002/(SICI)1097-4598(199906) 22:6<659::AID-MUS1>3.0.CO;2-XPMID:10366218
3. Pestronk A, Florence J, Levine T, Al-Lozi MT, Lopate G, Miller T, et al. Sensory exam with a quantitative tuning fork: rapid, sensitive and predictive of SNAP amplitude. Neurology. 2004; 62: 461–464. PMID: 14872031
4. Bril V, Perkins BA. Comparison of vibration perception thresholds obtained with the Neurothesiometer and the CASE IV and relationship to nerve conduction studies. Diabet Med. 2002; 19: 661–666. PMID: 12147147
5. Martin CL, Waberski BH, Pop-Busui R, Cleary PA, Catton S, Albers JW, et al. Vibration perception threshold as a measure of distal symmetrical peripheral neuropathy in type 1 diabetes: results from the DCCT/EDIC study. Diabetes Care. American Diabetes Association; 2010; 33: 2635–2641. doi:10. 2337/dc10-0616PMID:20833868
6. Amato A, Russell J. Neuromuscular Disorders. McGraw Hill Professional; 2008.
7. Koski CL, Baumgarten M, Magder LS, Barohn RJ, Goldstein J, Graves M, et al. Derivation and valida-tion of diagnostic criteria for chronic inflammatory demyelinating polyneuropathy. 2009. pp. 1–8. doi: 10.1016/j.jns.2008.11.015
8. Claus D, Mustafa C, Vogel W, Herz M, Neundörfer B. Assessment of diabetic neuropathy: definition of norm and discrimination of abnormal nerve function. Muscle Nerve. Wiley Subscription Services, Inc., A Wiley Company; 1993; 16: 757–768. doi:10.1002/mus.880160711PMID:8505932
9. Dimitrakoudis D, Bril V. Comparison of sensory testing on different toe surfaces: implications for neu-ropathy screening. Neurology. 2002; 59: 611–613. PMID:12196660
10. Bolton CF, Benstead TJ, Grand'Maison F, Tardif GS, Weston LE. Minimum standards for electromyog-raphy in Canada: a statement of the Canadian Society of Clinical Neurophysiologists. The Canadian journal of neurological sciences. Le journal canadien des sciences neurologiques. 2000. pp. 288–291. PMID:11097517
11. Katz JS, Saperstein DS, Gronseth G, Amato AA, Barohn RJ. Distal acquired demyelinating symmetric neuropathy. Neurology. 2000; 54: 615–620. PMID:10680792
12. Simmons Z, Albers JW, Bromberg MB, Feldman EL. Presentation and initial clinical course in patients with chronic inflammatory demyelinating polyradiculoneuropathy: comparison of patients without and with monoclonal gammopathy. Neurology. 1993; 43: 2202–2209. PMID:8232929
13. Kuwabara S, Ogawara K, Misawa S, Mori M, Hattori T. Distribution patterns of demyelination correlate with clinical profiles in chronic inflammatory demyelinating polyneuropathy. J Neurol Neurosurg Psy-chiatr. 2002; 72: 37–42. PMID:11784822
14. Abraham A, Breiner A, Katzberg HD, Lovblom LE, Perkins BA, Bril V. Treatment responsiveness in CIDP patients with diabetes is associated with unique electrophysiological characteristics, and not with common criteria for CIDP. Expert Rev Clin Immunol. Informa UK, Ltd.London; 2015; 11: 537–546. doi: 10.1586/1744666X.2015.1018891PMID:25764107
15. Cocito D, ChiòA, Tavella A, Poglio F, Paolasso I, Ciaramitaro P, et al. Treatment response and electrophysiological criteria in chronic inflammatory demyelinating polyneuropathy. Eur J Neurol. Black-well Publishing Ltd; 2006; 13: 669–670. doi:10.1111/j.1468-1331.2006.01259.xPMID:16796598 16. Dunnigan SK, Ebadi H, Breiner A, Katzberg HD, Barnett C, Perkins BA, et al. The characteristics of
chronic inflammatory demyelinating polyneuropathy in patients with and without diabetes—an observa-tional study. Sommer C, editor. PLoS ONE. Public Library of Science; 2014; 9: e89344. doi:10.1371/ journal.pone.0089344PMID:24586703
17. Hughes RAC, Donofrio P, Bril V, Dalakas MC, Deng C, Hanna K, et al. Intravenous immune globulin (10% caprylate-chromatography purified) for the treatment of chronic inflammatory demyelinating poly-radiculoneuropathy (ICE study): a randomised placebo-controlled trial. Lancet Neurol. Elsevier; 2008; 7: 136–144. doi:10.1016/S1474-4422(07)70329-0PMID:18178525
18. Bril V, Banach M, Dalakas MC, Deng C, Donofrio P, Hanna K, et al. Electrophysiologic correlations with clinical outcomes in CIDP. Muscle Nerve. Wiley Subscription Services, Inc., A Wiley Company; 2010; 42: 492–497. doi:10.1002/mus.21733PMID:20665514