No Association of Maternal Gestational
Weight Gain with Offspring Blood Pressure
and Hypertension at Age 18 Years in Male
Sibling-Pairs: A Prospective Register-Based
Cohort Study
Elina Scheers Andersson1, Per Tynelius1, Ellen Aagaard Nohr2, Thorkild I. A. Sørensen3,4,5, Finn Rasmussen1*
1Department of Public Health Sciences, Child and Adolescent Public Health Epidemiology, Karolinska Institutet, Stockholm, Sweden,2Research Unit of Obstetrics and Gynecology, Institute of Clinical Research, University of Southern Denmark, Odense, Denmark,3Novo Nordisk Foundation Centre for Basic Metabolic Research, Section on Metabolic Genetics, Faculty of Health and Medical Sciences, University of
Copenhagen, Copenhagen, Denmark,4Institute of Preventive Medicine, Bispebjerg and Frederiksberg Hospital, Copenhagen, The Capital Region, Denmark,5MRC Integrative Epidemiology Unit, Bristol University, Bristol, United Kingdom
Abstract
Background
Maternal gestational weight gain (GWG) is associated with birth weight, obesity, and possi-bly blood pressure (BP) and hypertension in the offspring. These associations may however be confounded by genetic and/or shared environmental factors. In contrast to previous stud-ies based on non-siblings and self-reported data, we investigated whether GWG is associ-ated with offspring BP and hypertension, in a register-based cohort of full brothers while controlling for fixed shared effects.
Methods
By using Swedish nation-wide record-linkage data, we identified women with at least two male children (full brothers) born 1982-1989. Their BP was obtained from the mandatory military conscription induction tests. We adopted linear and Poisson regression models with robust variance, using generalized estimating equations to analyze associations between GWG and BP, as well as with hypertension, within and between offspring sibling-pairs.
Results
Complete data on the mothers’GWG and offspring BP was obtained for 9,816 brothers (4,908 brother-pairs). Adjusted regression models showed no significant associations be-tween GWG and SBP (β= 0.03 mmHg per 1-kg GWG difference, [95% CI -0.08, 0.14], or DBP (β= -0.03 mmHg per 1-kg GWG difference [95% CI -0.11, 0.05]), or between GWG
a11111
OPEN ACCESS
Citation:Scheers Andersson E, Tynelius P, Nohr EA, Sørensen TIA, Rasmussen F (2015) No Association of Maternal Gestational Weight Gain with Offspring Blood Pressure and Hypertension at Age 18 Years in Male Sibling-Pairs: A Prospective Register-Based Cohort Study. PLoS ONE 10(3): e0121202. doi:10.1371/journal.pone.0121202
Academic Editor:David B. Allison, University of Alabama at Birmingham, UNITED STATES
Received:November 14, 2014
Accepted:January 24, 2015
Published:March 20, 2015
Copyright:© 2015 Scheers Andersson et al. This is an open access article distributed under the terms of
theCreative Commons Attribution License, which
permits unrestricted use, distribution, and reproduction in any medium, provided the original author and source are credited.
Data Availability Statement:The original data was not collected by the authors, but made available by record-linkage, using the Swedish unique personal ID numbers by the following third parties: Statistics Sweden, The National Archives, The National Service Administration and The National Board of Health and Welfare. The final dataset with the record-linkage was created by a senior statistician (PT) at the
and offspring’s risk of hypertension (relative risk = 1.0 [95% CI 0.99, 1.02], neither within nor between siblings.
Conclusions
In this large sibling-pair study, we did not find any significant association between GWG and offspring BP or the risk of hypertension at 18y, when taking genetic and environmental fac-tors shared within sibling pairs into account. Further large sibling studies are required to confirm a null association between GWG and other cardiovascular risk factors.
Introduction
It is well known that maternal gestational weight gain (GWG) is associated with a number of pregnancy and birth-related outcomes [1–3]. GWG has in numerous studies been linked to greater adiposity in the offspring in both childhood [4–10] and adulthood [7,11–13]. From a public health point of view, it is important to determine if the observed association between maternal GWG and offspring adult BMI may also increase cardiovascular risk factors, such as elevated blood pressure (BP). As there may be an underlying association between GWG and BP only in the higher ranges of BP, it is also important to look at the relationship between GWG and hypertension. The majority of studies to date examining the association between higher GWG and BP in the offspring are limited to childhood [14–17]. We are only aware of three studies which have investigated whether GWG also is associated with BP in adulthood [12,18,19], and only one of them examined BP classified as hypertension [12]. The results from these studies are inconsistent, with one study finding a weak association between GWG and offspring SBP at 32 years of age [18], while the other two failed to find any statistically sig-nificant associations [12,19].
Due to the scarcity of studies in the area with long follow-up data, the evidence base still re-mains rather weak. Moreover, and perhaps more importantly, the association between exces-sive GWG and offspring adult BP in these studies may be confounded by shared familial environmental and/or genetic factors, e.g. socioeconomic status and life-style related character-istics. Family studies provide a way of addressing this type of confounding [20] as parents and their offspring share half of their genes, and so do full siblings on average.
Our objective was to examine the association between GWG and BP, as well as hyperten-sion, in male full sibling pairs at age 18, when genetic and environmental factors fixed from one pregnancy to the next were taken into account.
Materials and Methods
Ethics and data availability statement
Ethical approval for the study was granted by the Stockholm Regional Ethical Review Board for the analysis of record-linkage data in the cohort without individual consent (Ref no 2011/691–
31/2), in accordance with the Public Access to Information and Secrecy Act and the Personal Data Act. As stated in these regulations, individual consent is not needed when subjects are not actively participating, the information is treated with secrecy, and the results are presented at a group level where no individual is possible to identify. Subject information was anonymized and de-identified prior to analysis. With regards to the data availability, a complete dataset might be generated by Statistics Sweden by record-linkage of data from the public bodies not allowed to forward the record-linkage dataset with
information on individuals, made anonymous by Statistics Sweden, to other researchers outside the Department of Public Health Sciences, KI. Any researcher with approval from the Ethical Review Board in Stockholm is able to create an almost identical dataset by contacting Statistics Sweden (contact person: Andreas Blomquist; andreas.
[email protected]) and the third parties. Statistics
Sweden did not agree to save the current dataset with ID numbers for more than three months for correcting any potential errors. The principal investigator will provide metadata (tables) on request to other researchers, for example showing results of alternative analytic strategies.
Funding:This study was supported by a grant from the Swedish Research Council for Health, Working Life and Welfare (FORTE) (http://www.forte.se) (Grant No 2010-0671) and the Karolinska Institutet Faculty Funds (KID) (http://ki.se). The funders had no role in study design, data collection and analysis, decision to publish, or preparation of the manuscript.
described in theMethodssection. Access to the current dataset is restricted due to content of contract (detailed information on data availability can be found inS1 Text).
Data sources and study population
A database was created for this population-based cohort study by record-linkage of several na-tion-wide Swedish registers, based on the unique personal identification number assigned to all Swedish citizens. Biological parents were identified from the Multi-Generation Register, where parenthood was established from birth certificates. Although the possibility of false paternity (also referred to as non-paternity) has to be recognized, it has in previous studies been estimat-ed to account for less than 5% in other European countries with similar registers [21,22]. Infor-mation on the mothers’GWG was retrieved from the Medical Birth Register (which covers 99% of all births in Sweden) while data on BP was collected from the Military Service Conscrip-tion Register. We also linked informaConscrip-tion on level of educaConscrip-tion from Statistics Sweden’s Regis-ter of Education to the database.
Study sample and exclusions
Data on both exposure and outcome variables was available for all singleton men born in Swe-den between 1982 and 1989 (N = 281,522) who underwent military conscription induction tests from 2000 to 2008 (N = 89,829), to which we applied the following exclusions: births to mothers with only one child, mothers with early-pregnancy weight and delivery weight more than or equal to 99 kg (as the MBR had truncated these weights at 99 kg during the years of the study period), gestational age less than 30 weeks or 44 weeks or more and birth weight less than 700 g, as well as systolic BP (SBP) less than 90 mmHg or more than 180 mmHg and dia-stolic BP (DBP) less than 40 mmHg or more than 100 mmHg (to exclude extreme values due to measurement errors or data entry errors), men in families where only one brother had con-scripted, age at conscription less than 17 or more than 20 years, brothers born 3rdor 4thin the cohort (in order to base the analyses on the mothers’first and second male pregnancies during the study period) and men in families where only one brother had a valid BP measurement. Subsequently, we ended up with a study population of 9,816 full brothers for the main analyses. The data on BP was taken from medical examinations which are part of the military conscrip-tion inducconscrip-tion tests. Military conscripconscrip-tion was compulsory by law for all Swedish men during the period covered in this study, with only 2–3% being exempted due to severe handicaps or chronic disease.
Measurements of exposure variable and covariates
Maternal GWG, measured as a continuous variable, was the main exposure and was calculated by subtracting the weight at delivery (measured before, and in the same gestational week as de-livery) by early-pregnancy weight (measured at the first antenatal clinic assessment,10 weeks of gestation). Maternal height and weight (recorded at the first antenatal clinic assess-ment), parity, birth weight, gestational age, gestational diabetes and preeclampsia were all mea-sured by midwives, obstetricians, or medical doctors as part of normal clinical practice. The quality of the data, in terms of accuracy and completeness, has previously been shown to be
measured using analogue or digital scales. BMI (weight in kilograms divided by the square of height in meters) was categorized according to the World Health Organization’s (WHO) classi-fication of BMI cut-offs, into underweight (<18.50 kg/m2), normal (18.50 to 25 kg/m2), overweight (25 to 30 kg/m2) or obese (30 kg/ m2) [25]. Using Statistics Sweden’s Register for Education for the years 1990 to 2010, highest maternal education was categorized into: pri-mary or lower secondary (10y), secondary (<12y), full secondary (12y), higher education <15y and higher education15y.
Measurement of outcome variables
The main outcomes were BP at conscription (mean age 18.3 years), analyzed as a continuous variable, and the occurrence of hypertension, defined as SBP140 mmHg or DBP90 mmHg according to the WHO/International Society of Hypertension [26]. The measurements of SBP and DBP were taken after 5 to 10 minutes rest in the supine position with an appropriately sized cuff at heart level, according to a written protocol. The BP was assessed on a single occasion if SBP was 145 mmHg or below and DBP was between 50 and 85 mmHg. However, if SBP and/or DBP were outside these limits, BP was measured a second time on the next day. In these cases, the result of the second BP measurement was entered into the register.
Sensitivity analyses and handling of missing data
We carried out two separate sensitivity analyses in which we restricted the analyses to 1) off-spring born at term (week 37 up to 42 completed weeks) with birth weight of at least 1700 g (according to the criteria for accepted birth weights at gestational week 37, based on a paper by Källén [27], with data from the Swedish MBR on birth weight for gestational age standards) and 2) mothers without diseases during pregnancy (gestational diabetes and preeclampsia). We accounted for missing data in BP and BMI measurements through multiple imputation (MI) in Stata 12.1 using chained equations (20 datasets). However, as the results remained un-changed we only present the results using pairs with complete data (a description and justifica-tion of the sensitivity and the MI analyses can be found inS2 Text).
Statistical analysis
For the main analyses, we used generalized estimating equations (GEE) with robust variance to estimate associations within and between mothers. The regression analyses were performed using the xtgee command in Stata 12.1 (Stata Corp, College Station, Texas, USA). When using BP of the sons as a continuous outcome, the between siblings association was based on the means of GWG in the two pregnancies, and means of the sons’BP. By contrast, the within sib-lings association was based on the GWG difference from the mean between two pregnancies of the same mother, and difference in BP between two brothers as outcome. These within and be-tween-analyses are based on the formula:EðYijÞ ¼ b0þbwðXij
XiÞ þbB
Xi;where
Xi
repre-sents the mean value ofXfor sibling-pairiandβwis the within-pair regression coefficient and
βBis the between-pair regression coefficient. With this analytical approach of differences
In order to examine possible underlying associations in sub-groups of the study population, we conducted stratified analyses by the mothers’early-pregnancy BMI category. As only 6% of the mothers were underweight and less than 4% were obese, these subjects were combined into two categories:“underweight and normal weight (<25 kg/m2)”and“overweight and obese (25 kg/m2)”.
We addressed potential confounding for all types of analyses in three different models. In the basic model (model 1), adjustments were made for maternal age at birth, birth year and ges-tational age. We then added adjustments for the mothers’early-pregnancy BMI, parity and ma-ternal education (model 2). In order to account for potential systematic differences between the conscription centers with regards to BP measurements, we further adjusted for conscrip-tion center and offspring’s age at conscription (model 3).
Results
Descriptive statistics
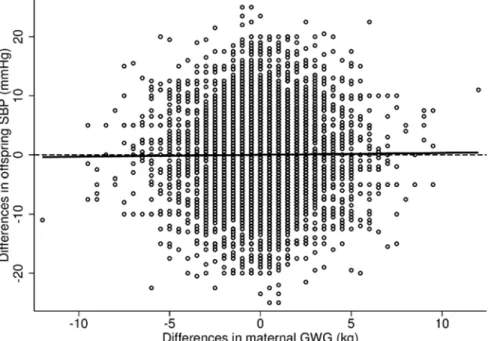
The characteristics of the mothers and their sons, stratified by birth order (first or second born son during the study period), are presented inTable 1. The mean GWG was approxi-mately 14 kg (SD = 4.2 kg), and was slightly lower for the second pregnancy compared to the first (13.8 kg (SD = 4.0 kg) and 14.0 kg (SD = 4.2 kg) respectively). The majority of the sons were normal weight at conscription (79%) and had a mean SBP of 131 mmHg (SD = 11.1 mmHg) and mean DBP of 69 mmHg (SD = 8.4 mmHg). As displayed inFig. 1, there was a considerable variation in GWG as well as in SBP differences. Additionally, the unadjusted lin-ear regression line, corresponding to the within analyses presented inTable 2, gave no indica-tion of any obvious associaindica-tion between differences in GWG and differences in SBP. The unadjusted prevalence of hypertension was 17% (SBP mean = 146 mmHg (SD = 5.0 mmHg), DBP mean = 75 mmHg (SD = 7.7 mmHg) and was similar across all quintiles of the GWG distribution, although a possible weak trend was observed in the prevalence of hypertension for the second born sons (a table on the prevalence of hypertension across the GWG quintiles can be found inS1 Table).
Regression analyses
Additional analyses
In the sensitivity analyses for which we excluded offspring born preterm or post-term (<37 or >42 weeks gestation, N = 773), as well as mothers with diseases during pregnancy (gestational diabetes and preeclampsia, N = 82), none of the results differed from those presented earlier and these observations were therefore kept in the analyses. Two additional stratifications were also carried out: in the first one we examined differences in GWG between the two pregnancies. In the second analysis, differences in maternal early-pregnancy weight were considered (a de-scription of the additional stratifications can be found inS3 Text). Similar to the initial strati-fied analysis, the results from these stratifications did not differ from the main results.
Table 1. Characteristics of the mothers and their sons stratified by birth order.a
Characteristics 1st son 2nd son
(N = 4,908) (N = 4,908) Mothers’characteristics
Early-pregnancy BMI categories [n(%)] 4,908 (100) 4,908 (100)
Underweight 346 (7.0) 297 (6.1)
Normal weight 4,128 (84.1) 4,011 (81.7)
Overweight 405 (8.3) 546 (11.1)
Obese 29 (0.6) 54 (1.1)
Mean early-pregnancy BMI (kg/m2) 21.6 (2.5) 21.9 (2.7)
GWG (kg) 14.0 (4.2) 13.8 (4.0)
Height (cm) 166.3 (5.8) 166.4 (5.8)
Age at birth (y) 26.7 (3.9) 29.4 (4.0)
Highest educational level achieved [n(%)] 4,908 (100) 4,908 (100)
Primary or lower secondary10 y 348 (7.1) 348 (7.1)
Secondary<12 y 1,506 (30.7) 1,506 (30.7)
Full secondary12 y 691 (14.1) 691 (14.1)
Higher education<15 y 996 (20.3) 996 (20.3)
Higher education15 y 1,367 (27.9) 1,367 (27.9)
Sons’characteristics at birth
Birth weight (g) 3595.6 (500.9) 3710.9 (497.3) Gestational age (w) 39.5 (1.6) 39.5 (1.4) Sons’characteristics at conscription
Age (y) 18.3 (0.3) 18.2 (0.3)
Weight (kg) 73.9 (10.9) 74.0 (10.8)
Height (cm) 180.7 (6.4) 180.6 (6.3)
BMI (kg/m2) 22.6 (3.0) 22.7 (2.9)
BMI category [n(%)] 4,908 (100) 4,908 (100)
Underweight 201 (4.1) 160 (3.3)
Normal weight 3,904 (79.5) 3,882 (79.1)
Overweight 658 (13.4) 756 (15.4)
Obese 145 (3.0) 110 (2.2)
Systolic BP (mmHg) 130.6 (11.0) 130.9 (11.1) Diastolic BP (mmHg) 69.9 (8.4) 68.9 (8.3)
Data are given as mean values (SD) or number of individuals (%). Abbreviations: GWG, gestational weight gain; BP, blood pressure; BMI, Body Mass Index.
aFirst or second born son during the study period (1982
–1989).
Fig 1. Observed differences in systolic blood pressure and gestational weight gain.The figure shows the unadjusted regression line and observed differences in systolic blood pressure (SBP), mmHg, and gestational weight gain (GWG), kg.
doi:10.1371/journal.pone.0121202.g001
Table 2. Associations of gestational weight gain with offspring systolic blood pressure, non-stratified and stratified by mother’s early-pregnancy body mass index, usingfixed effects regression model.
Within effectb Between effectc
Statistical modela N β[95% CI] β[95% CI] P-valued
Non-stratified 9,816
Model 1 0.03 [-0.06, 0.13] 0.03 [-0.04, 0.09] 0.93
Model 2 0.03 [-0.08, 0.14] 0.02 [-0.05, 0.09] 0.93
Model 3 0.03 [-0.08, 0.14] 0.03 [-0.04, 0.10] 0.95
Underweight and normal weight 8,782 (BMI<25 kg/m2)
Model 1 0.02 [-0.09, 0.13] 0.03 [-0.04, 0.10] 0.86
Model 2 0.02 [-0.10, 0.14] 0.02 [-0.05, 0.10] 0.97
Model 3 0.03 [-0.09, 0.15] 0.03 [-0.04, 0.10] 1.00
Overweight and obese 1,034 (BMI25 kg/m2)
Model 1 0.13 [-0.13, 0.39] -0.001 [-0.19, 0.19] 0.40
Model 2 0.06 [-0.25, 0.38] -0.01 [-0.21, 0.19] 0.67
Model 3 0.03 [-0.27, 0.34] -0.03 [-0.22, 0.17] 0.75
Abbreviations: CI, confidence interval; BMI, body mass index.
aModel 1 was adjusted for maternal age at birth, birth year and gestational age. Model 2 was adjusted as for model 1 plus early-pregnancy BMI, maternal education and parity. Model 3 was adjusted as for model 2 plus offspring’s age of conscription and conscription center.
bDifference in offspring SBP in mmHg per 1-kg difference in gestational weight gain. cDifference in offspring SBP in mmHg per 1-kg greater gestational weight gain. dP-value to test whether the within and between effects differ, obtained by a Wald test.
Discussion
This study investigated the relationship between maternal GWG and offspring BP and the risk of hypertension at 18 years, both within siblings (in order to account for shared environmental or genetic factors) and between unrelated families, however no significant associations were observed.
Table 3. Associations of gestational weight gain with offspring diastolic blood pressure, non-stratified and stratified by mother’s early-pregnancy body mass index, usingfixed effects regression model.
Within effectb Between effectc
Statistical modela N β[95% CI] β[95% CI] P-valued
Non-stratified 9,816
Model 1 -0.05 [-0.12, 0.02] -0.05 [-0.10, 0.004] 0.91
Model 2 -0.03 [-0.12, 0.05] -0.05 [-0.10, 0.004] 0.79
Model 3 -0.03 [-0.11, 0.05] -0.04 [-0.09, 0.01] 0.79
Underweight and Normal weight 8,782 (BMI<25 kg/m2)
Model 1 -0.05 [-0.13, 0.03] -0.05 [-0.10, 0.01] 0.92
Model 2 -0.04 [-0.14, 0.05] -0.05 [-0.11, 0.01] 0.93
Model 3 -0.03 [-0.12, 0.06] -0.04 [-0.09, -0.01] 0.84
Overweight and obese 1,034 (BMI25 kg/m2)
Model 1 -0.03 [-0.21, 0.14] -0.04 [-0.17, 0.10] 0.97
Model 2 0.01 [-0.22, 0.23] -0.05 [-0.19, 0.93] 0.69
Model 3 -0.02 [-0.24, 0.20] -0.06 [-0.19, 0.08] 0.78
Abbreviations: CI, confidence interval; BMI, body mass index.
aModel 1 was adjusted for maternal age at birth, birth year and gestational age. Model 2 was adjusted as for model 1 plus early-pregnancy BMI, maternal education and parity. Model 3 was adjusted as for model 2 plus offspring’s age of conscription and conscription center.
bDifference in offspring SBP in mmHg per 1-kg difference in gestational weight gain. cDifference in offspring SBP in mmHg per 1-kg greater gestational weight gain. dP-value to test whether the within and between effects differ, obtained by a Wald test.
doi:10.1371/journal.pone.0121202.t003
Table 4. Associations of differences in maternal gestational weight gain with increased risk of hypertension in the offspring at 18 years, usingfixed effects regression model (N = 9,816).
Within effect b Between effect c
Statistical modela RR [95% CI] RR [95% CI] P-valued
Model 1 1.00 [0.98, 1.02] 1.01 [1.00, 1.02] 0.54 Model 2 1.00 [0.98, 1.03] 1.01 [1.00, 1.02] 0.66 Model 3 1.00 [0.98, 1.03] 1.01 [1.00, 1.02] 0.61
Abbreviations: RR, relative risk; CI, confidence interval.
aModel 1 was adjusted for maternal age at birth, birth year and gestational age. Model 2 was adjusted as for model 1 plus early-pregnancy BMI, maternal education and parity. Model 3 was adjusted as for model 2 plus offspring’s age of conscription and conscription center.
bRelative risk of hypertension in the offspring per 1-kg difference in gestational weight gain. cRelative risk of hypertension in the offspring per 1-kg greater gestational weight gain. dP-value to test whether the within and between effects differ, obtained by a Wald test.
Interpretations of main findings
As mentioned briefly in the introduction, only three studies to date have examined the associa-tion between maternal GWG and cardiovascular risk factors such as BP in adulthood, with in-consistent results [12,18,19], and only one of them analyzed the association of GWG with the risk of hypertension in the offspring [12]. The latter study, based on an Australian birth-cohort of 2,432 individuals, found a modest, although non-significant, association of GWG with SBP at 21 years in the offspring of a sub-group of mothers who had an excessive GWG according to the USA Institute of Medicine guidelines [12]. However, this effect attenuated towards the null in their‘confounder- and mediator-adjusted model’. The study did not find that adults whose mothers had an excessive GWG had greater odds of hypertension. The other two studies were based on Israeli birth cohorts, one being nation-wide with 10,833 subjects and 17 years of fol-low-up [19] whereas the other study was restricted to the city of Jerusalem with 1,400 subjects and 32 years of follow-up in the offspring [18]. The smaller of the two studies found a weak, al-though statistically significant, association between GWG and SBP at 32 years in the offspring. In the larger nation-wide study, no association was found between maternal GWG and off-spring SBP and DBP at 17 years and their results were non-significant. As previously discussed, the aforementioned studies were based on unrelated subjects, and the positive findings might therefore be explained by shared environmental and/or genetic factors. Our work extends these previous studies, by taking possible confounding by shared mother-child genetic and environ-mental factors into account and the results do not suggest any associations between GWG and SBP, DBP or hypertension in young adulthood. As indicated earlier, we found a statistically sig-nificant overall association between GWG and SBP in the offspring in the larger cohort of 89,829 men (β= 0.03), but not in the smaller sibling cohort of 9,816 men (β= 0.03 (within and between)). The fact that the effect sizes were similar (albeit small) indicates that the analyses on the sibling cohort may suffer from too low statistical power. As stated briefly in the results sec-tion, we also found an indication of a possible trend in increasing prevalence for hypertension with increasing maternal GWG in the second born sons. However, the trend disappeared in the adjusted analysis when we analyzed the association between maternal GWG and the risk of hypertension as described above.
A possible explanation for the lack of association between GWG and young adult BP or hy-pertension could be that cardiometabolic outcomes such as BP are sensitive to weight gain dur-ing specific time windows in gestation. This has been suggested in two large European studies. The first one was conducted on 9-year old children from the United Kingdom where they ob-served that GWG only during mid-pregnancy (gestational weeks>14 to 36) was associated with cardiovascular risk factors [16]. The second study, based on 6-year old children from the Netherlands, found an independent association between higher GWG and SBP during both early and mid-pregnancy (gestational weeks>13.4 to 29.9), although this association was largely mediated by childhood adiposity [29]. Replication of these results are however neces-sary in studies with longer follow-up periods (into adulthood), but we were not able to do so as our data lacked repeated measurements of GWG.
It is also important to consider the possibility of publication bias, namely that there could be previous studies which have not found any association between GWG and adult BP and/or hy-pertension, which may not have been published due to the well-known issue that positive find-ings are more often being published than negative findfind-ings. Consequently, the overall
Methodological considerations
The major strengths of this study were its prospective design with objectively measured follow-up data in the offspring, availability of data on important confounding factors and its ability to assess the impact of GWG on BP and hypertension while controlling for unmeasured fixed ma-ternal or familial factors within sibling-pairs. These factors include, not only those which do not change from one pregnancy to the next (e g maternal height and possibly diet and lifestyle-patterns), but also those known to affect blood pressure in young adulthood (such as alcohol intake and physical activity [30,31]) which tend to be more concordant within families (among sibling-pairs) than between families (among non-siblings). Additionally, and in con-trast to some earlier studies, both exposure and outcome variables were extracted from national registers and were measured according to a standardized protocol by healthcare professionals, eliminating potential bias from self-reported data.
Our study was also afflicted with some limitations. Firstly, as military conscription tests were only mandatory for men and as the study was conducted in a Swedish population, the re-sults from this study cannot be generalized to women or to ethnic groups other than white Eu-ropean. As previously mentioned, the number of men who completed all the medical
examinations involved in the induction tests decreased during the early 2000s, resulting in some missing data for BMI and BP in our cohort. However, as previously acknowledged, the results from the MI analyses suggest that our null-findings were not likely biased due to these missing data.
Although the sibling-design used in our cohort controls for unmeasured shared familial fac-tors, e.g. factors which do not change from one pregnancy to the next, it does not control for unmeasured unshared factors which are pregnancy-specific, e.g. changes in the environment from one pregnancy to the next, such as different dietary and physical activity patterns. In order to limit bias from these unmeasured characteristics, we have however taken confounding factors such as maternal early-pregnancy BMI, age and parity into account in our analyses. It should also be mentioned that there are other unmeasured factors which could influence our outcome differently within the brother-pair (i.e. non-fixed variables, such as history of hyper-tension or other pre-existing conditions known to affect BP) which we could not take into ac-count in the analyses. However, as these potential confounding variables are likely to create spurious associations (dissimulating true null results), and as we in this study observe null-findings, we believe these factors to be less of an issue. It is further worth pointing out that stud-ies on full-siblings only partially control for genetic confounding, as full brothers on average share half of their parents’segregating genes. As we only had the possibility to examine one specific cardiovascular risk factor in this study, i.e. BP, and as our study was conducted in 18-year old men where the prevalence of hypertension is lower than in older populations, further large prospective sibling studies with data on other cardiovascular risk factors, as well studies with longer follow-up periods would be worthwhile to conduct.
In summary, the results from our study showed no associations between GWG and BP or the risk of hypertension at 18 years in the offspring when taking fixed genetic and shared envi-ronmental factors into account.
Supporting Information
S1 Table. Prevalence of hypertension in the five quintiles of the gestational weight gain dis-tribution.
S1 Text. Data availability statement.
(DOCX)
S2 Text. Description of the sensitivity and the Multiple Imputation (MI) analyses.
(DOCX)
S3 Text. Description of the additional stratifications.
(DOCX)
Author Contributions
Conceived and designed the experiments: ESA PT EAN TIAS FR. Analyzed the data: ESA PT FR. Wrote the paper: ESA PT EAN TIAS FR.
References
1. Margerison Zilko CE, Rehkopf D, Abrams B (2010) Association of maternal gestational weight gain with short- and long-term maternal and child health outcomes. Am J Obstet Gynecol 202: 574 e571–578. doi:10.1016/j.ajog.2009.12.007PMID:20132923
2. Frederick IO, Williams MA, Sales AE, Martin DP, Killien M (2008) Pre-pregnancy body mass index, ges-tational weight gain, and other maternal characteristics in relation to infant birth weight. Matern Child Health J 12: 557–567. PMID:17713848
3. Ludwig DS, Currie J (2010) The association between pregnancy weight gain and birthweight: a within-family comparison. Lancet 376: 984–990. doi:10.1016/S0140-6736(10)60751-9PMID:20691469
4. Ludwig DS, Rouse HL, Currie J (2013) Pregnancy Weight Gain and Childhood Body Weight: A Within-Family Comparison. Plos Med 10.
5. Oken E, Taveras EM, Kleinman KP, Rich-Edwards JW, Gillman MW (2007) Gestational weight gain and child adiposity at age 3 years. Am J Obstet Gynecol 196.
6. Beyerlein A, Nehring I, Rzehak P, Heinrich J, Mluler MJ, Plachta-Danielzik S, et al. (2012) Gestational Weight Gain and Body Mass Index in Children: Results from Three German Cohort Studies. PloS one 7.
7. Schack-Nielsen L, Michaelsen KF, Gamborg M, Mortensen EL, Sorensen TIA (2010) Gestational weight gain in relation to offspring body mass index and obesity from infancy through adulthood. Int J Obesity 34: 67–74. doi:10.1038/ijo.2009.206PMID:19918246
8. Oken E, Rifas-Shiman SL, Field AE, Frazier AL, Gillman MW (2008) Maternal Gestational Weight Gain and Offspring Weight in Adolescence. Obstet Gynecol 112: 999–1006. doi:10.1097/AOG.
0b013e31818a5d50PMID:18978098
9. Crozier SR, Inskip HM, Godfrey KM, Cooper C, Harvey NC, Cole ZA, et al. (2010) Weight gain in preg-nancy and childhood body composition: findings from the Southampton Women's Survey. Am J Clin Nutr 91: 1745–1751. doi:10.3945/ajcn.2009.29128PMID:20375187
10. Sridhar SB, Darbinian J, Ehrlich SF, Markman MA, Gunderson EP, Ferrara A, et al. (2014) Maternal gestational weight gain and offspring risk for childhood overweight or obesity. Am J Obstet Gynecol. 11. Reynolds RM, Osmond C, Phillips DIW, Godfrey KM (2010) Maternal BMI, Parity, and Pregnancy
Weight Gain: Influences on Offspring Adiposity in Young Adulthood. J Clin Endocr Metab 95: 5365–5369. doi:10.1210/jc.2010-0697PMID:20702520
12. Mamun AA, O'Callaghan M, Callaway L, Williams G, Najman J, Lawlor DA. (2009) Associations of Ges-tational Weight Gain With Offspring Body Mass Index and Blood Pressure at 21 Years of Age Evidence From a Birth Cohort Study. Circulation 119: 1720–U1752. doi:10.1161/CIRCULATIONAHA.108. 813436PMID:19307476
13. Stuebe AM, Forman MR, Michels KB (2009) Maternal-recalled gestational weight gain, pre-pregnancy body mass index, and obesity in the daughter. Int J Obes (Lond) 33: 743–752. doi:10.1038/ijo.2009. 101PMID:19528964
14. Dello Russo M, Ahrens W, De Vriendt T, Marild S, Molnar D, Moreno LA, et al. (2013) Gestational weight gain and adiposity, fat distribution, metabolic profile, and blood pressure in offspring: the IDE-FICS project. Int J Obes (Lond) 37: 914–919. doi:10.1038/ijo.2013.35PMID:23567926
16. Fraser A, Tilling K, Macdonald-Wallis C, Sattar N, Brion MJ, Benfield L, et al. (2010) Association of Ma-ternal Weight Gain in Pregnancy With Offspring Obesity and Metabolic and Vascular Traits in Child-hood. Circulation 121: 2557–U2548. doi:10.1161/CIRCULATIONAHA.109.906081PMID:20516377
17. Clark PM, Atton C, Law CM, Shiell A, Godfrey K, Barker DJ, et al. (1998) Weight gain in pregnancy, tri-ceps skinfold thickness, and blood pressure in offspring. Obstet Gynecol 91: 103–107. PMID:9464730
18. Hochner H, Friedlander Y, Calderon-Margalit R, Meiner V, Sagy Y, Avgil-Tsadok M, et al. (2012) Asso-ciations of Maternal Prepregnancy Body Mass Index and Gestational Weight Gain With Adult Offspring Cardiometabolic Risk Factors The Jerusalem Perinatal Family Follow-Up Study. Circulation 125: 1381–1389. doi:10.1161/CIRCULATIONAHA.111.070060PMID:22344037
19. Laor A, Stevenson DK, Shemer J, Gale R, Seidman DS (1997) Size at birth, maternal nutritional status in pregnancy, and blood pressure at age 17: population based analysis. Brit Med J 315: 449–453. PMID:9284660
20. Mann V, De Stavola BL, Leon DA (2004) Separating within and between effects in family studies: an ap-plication to the study of blood pressure in children. Stat Med 23: 2745–2756. PMID:15316951
21. Macintyre S, Sooman A (1991) Non-paternity and prenatal genetic screening. Lancet 338: 869–871. PMID:1681226
22. Sykes B, Irven C (2000) Surnames and the Y chromosome. American journal of human genetics 66: 1417–1419. PMID:10739766
23. Cnattingius S, Ericson A, Gunnarskog J, Kallen B (1990) A quality study of a medical birth registry. Scandinavian journal of social medicine 18: 143–148. PMID:2367825
24. (2013) Pregnancies, deliveries and newborn infants. The Swedish Medical Birth Register 1973–2011. Assisted Reproduction, treatment 1991–2010. Sweden: National Board of Health and Welfare 25. (2000) Obesity: preventing and managing the global epidemic. Report of a WHO consultation. World
Health Organization technical report series 894: i-xii, 1–253.
26. Afridi I, Canny J, Yao CH, Christensen B, Cooper RS, Kadiri S, et al. (2003) 2003 World Health Organi-zation (WHO)/International Society of Hypertension (ISH) statement on management of hypertension. J Hypertens 21: 1983–1992. PMID:14597836
27. Kallen B (1995) A birth weight for gestational age standard based on data in the Swedish Medical Birth Registry, 1985–1989. European journal of epidemiology 11: 601–606. PMID:8549738
28. Gardiner JC, Luo ZH, Roman LA (2009) Fixed effects, random effects and GEE: What are the differ-ences? Stat Med 28: 221–239. doi:10.1002/sim.3478PMID:19012297
29. Gaillard R, Steegers EA, Franco OH, Hofman A, Jaddoe VW (2014) Maternal weight gain in different periods of pregnancy and childhood cardio-metabolic outcomes. The Generation R Study. Int J Obes (Lond).
30. Chen L, Davey Smith G, Harbord RM, Lewis SJ (2008) Alcohol intake and blood pressure: a systematic review implementing a Mendelian randomization approach. Plos Med 5: e52. doi:10.1371/journal. pmed.0050052PMID:18318597