www.spsp.org.br
REVISTA PAULISTA
DE PEDIATRIA
1984-0462/$ - see front matter © 2014 Sociedade de Pediatria de São Paulo. Published by Elsevier Editora Ltda. All rights reserved. KEYWORDS
Child; Adolescent;
Nutrition assessment; Anthropometry
Abstract
Objective: To evaluate the nutritional status of schoolchildren, resident in a semiarid region in the Northeastern Brazil.
Methods: This is a cross-sectional study, involving 860 children and adolescents aged from 5-19 years-old, enrolled in three public schools in the county. The selection of schools was non-probabilistic type and unintentional. The initial population, which integrated the
database, was composed by 1,035 children and teenagers, and 175 students (16.9%) were
excluded because of inconsistency in the anthropometric data, resulting in a sample of 860
students. The following outcomes were considered: stunting (malnutrition), overweight and obesity (overweight), being the height/age and body mass index/age (BMI/Age),
indices respectively used. Children and adolescents with height <-2 standard deviations
and overweight and obese weight z score ≥1 were considered stunted. The statistical
analysis was descriptive.
Results: The prevalence of stunting and overweight/obesity was 9.1% and 24.0%,
respectively. Overweight and stunting were higher in adolescents aged 15 and over, compared to other age groups analyzed. In relation to gender, malnutrition presented itself in a similar way, but overweight was more frequent among females.
Conclusions: The results revealed that excess weight, here represented by the sum of
overweight and obesity, was more prevalent than stunting (malnutrition), highlighting
the urgent need for attention to this problem in order to design interventions capable of contributing to the improvement of schoolchildren nutritional status.
© 2014 Sociedade de Pediatria de São Paulo. Published by Elsevier Editora Ltda. All rights reserved.
ORIgINAL ARTICLE
Nutritional status of children and adolescents from a town in the
semiarid Northeastern Brazil
☆Elyssia Karine Nunes Mendonça Ramires
a, Risia Cristina Egito de Menezes
a,*,
Juliana Souza Oliveira
b, Maria Alice Araújo Oliveira
a, Tatiane Leocádio Temoteo
a,
Giovana Longo-Silva
a, Vanessa Sá Leal
b, Emília Chagas Costa
b, Leiko Asakura
aaUniversidade Federal de Alagoas (UFAL), Maceió, AL, Brazil b Universidade Federal de Pernambuco (UFPE), Recife, PE, Brazil
Received 25 October 2013; accepted 23 February 2014
DOI refers to: 10.1590/1984-0462201432309
☆Study conducted at Faculdade de Nutrição, Universidade Federal de Alagoas, Alagoas, AL, Brazil. *Corresponding author.
PALAVRAS-CHAVE Criança;
Adolescente; Avaliação nutricional; Antropometria
Estado nutricional de crianças e adolescentes de um município do semiárido do Nordeste brasileiro
Resumo
Objetivo: Avaliar o estado nutricional dos escolares de um município do semiárido nor-destino.
Métodos: Estudo transversal de crianças e adolescentes de 5-19 anos, matriculados em três escolas da rede pública de ensino do município. A população inicial foi composta
por 1.035 crianças e adolescentes matriculados na rede, sendo excluídos 175 alunos (17%) por inconsistência de dados antropométricos, resultando 860 estudantes. Foram
consideradas como variáveis desfechos, o deficit estatural (desnutrição) e o sobrepeso e obesidade (excesso de peso), sendo utilizados os índices altura/idade e o índice de massa corporal/idade (IMC/idade), respectivamente. Foram considerados com deficit
estatural crianças e adolescentes com altura <-2 desvios-padrão e, com sobrepeso e
obesidade, escore z do peso ≥1. A análise estatística foi descritiva.
Resultados: A prevalência de deficit estatural e a de sobrepeso/obesidade foi 9,1% e 24,0%, respectivamente. O excesso de peso e o deficit estatural foi maior nos adoles-centes maiores de 15 anos. Em relaçao ao sexo, a desnutriçao apresentou-se de forma similar, e o excesso de peso acometeu mais os do sexo feminino.
Conclusões: Os resultados revelaram que o excesso de peso, aqui representados pelo somatório das duas condições – sobrepeso/obesidade –, apresentou maior prevalência que o deficit estatural (desnutrição), deixando clara a necessidade da atenção a esse
problema para viablizar intervenções que contribuam com a melhoria do estado nutri-cional de escolares.
© 2014 Sociedade de Pediatria de São Paulo. Publicado por Elsevier Editora Ltda. Todos os direitos reservados.
Introduction
Brazil is undergoing a clear process of nutritional transi-tion marked by distinct characteristics and stages, which shows a marked increase in the prevalence of overweight and obesity at different stages of life, whereas malnutri-tion, among other nutritional deficiencies, still remains a health problem to overcome.1
According to the Household Budget Survey (HBS), con -ducted in 2008-2009, the percentage of children with
growth retardation in Brazil is 6.8%.2 The height/age index
is one of the indicators that helps detect child malnutri-tion by presenting the delay in the child’s linear growth, a fact that continues to arouse the concern of health authorities and researchers in the area of child health. Paradoxically, data from this same study revealed that
the prevalence of excess weight affects 33.5% of children aged 5 to 9 years, and 21.7% and 19% of male and female
adolescents, respectively.
Epidemiological studies have shown that the prevalence of excess weight has surpassed that of malnutrition in all age groups and social and demographic strata. This rep-resents a risk factor in the short and long term for the
increase of non-communicable chronic diseases (NCCD),
which have been shown to be more frequent and of earlier onset in contemporary society.3,4
Children and adolescents are biologically more vulner-able to these diseases, and thus, as a group, they are a good indicator of the presence of nutritional disorders in the population.5 In this context, among the public policies
of prevention and control of nutritional disorders and of
health promotion in children and adolescents, the Health
at School Program (HSP) was established through a presi -dential decree, as a result of a partnership between the
Brazilian Ministries of Health and Education.
This policy aims to expand health interventions among students from public schools, as well as the evaluation of health status, health promotion, and disease prevention.6
This study aimed to assess the nutritional status of schoolchildren, participants of the School Health
Mobilization Week, in Maribondo, a city located in semi -arid Northeastern Brazil, promoted by the HSP in 2012, and to compare the nutritional profile of this group with that
established by the reference curves proposed by the World Health Organization (WHO).7
Method
This was a cross-sectional study, conducted based on data from the 1st School Health Mobilization Week of the HSP in
Maribondo, a municipality in the state of Alagoas, in semi -arid Northeastern Brazil.
Maribondo is a small Brazilian city, whose population is
estimated at around 14,000 inhabitants in an area slightly
larger than 171 km², which has a Human Development Index (HDI) of 0.64, calculated according to the Atlas of
Human Development/UNDP.8 The HDI in the semiarid region
is less than 0.65 in approximately 82% of the municipalities,
with a deficit in regard to income and education indicators,
among others. The municipality of Maribondo has an urban
lacks access to basic sanitation, including municipal water supply and sewage or garbage collection services. There
are six Basic Health Units (BHUs), and 25 public schools in
the municipality, with 4,029 students attending elementary and high school.9 Thus, this municipality was intentionally
chosen for its high degree of poverty, here represented by the low HDI, to assess the nutritional status of children and adolescents.
The actions of the HSP, which in 2012 prioritized the prevention of obesity in childhood and adolescence, are
developed by teams from the Family Health Strategy (FHS)
linked to BHUs, who visit the schools to examine and eval-uate children’s health status and to develop educational practices for health promotion and disease prevention.6
More detailed information on the design and methodologi -cal aspects of the HSP is available in official publications of the Brazilian government.10
The study assessed children and adolescents aged 5 to 19 years enrolled at three public school schools of the municipality, using a non-probabilistic and random sam-pling method of school selection, respecting the municipal school network’s decision to join the HSP. The initial popu-lation, which integrated the database of the HSP in 2012, consisted of 1,035 children and adolescents enrolled in three schools from the public network, with two located in the urban area and one in the countryside. A total
of 175 students (16.9%) were excluded due to inconsis -tent anthropometric data, i.e. missing measurements of weight and/or height, resulting in a sample population of 860 students.
Anthropometric assessments were performed after staff training, according to the technical procedures
recom-mended by the WHO in 199511 and the Brazilian Ministry
of Health.12 Data were collected by FHS professionals and
the nutritionist who coordinated the actions of the HSP in the municipality. Anthropometric data were recorded on a specific form.
Body weight was measured using an anthropometric digi-tal scale graduated from 0 to 150 kg with a precision of 0.05 kg, and height was measured with a portable stadi-ometer fixed to the wall, ranging from 0 to 200 cm, with a precision of 0.2 cm.
The body mass index (BMI) was calculated by dividing body weight (kg) by height squared (m2).
To assess the nutritional status, the height/age index
and the BMI/age index were used to diagnose growth delay and excess weight, respectively. The growth curves of WHO
2006 were used as reference for both.13
Children and adolescents with height <-2 standard devi-ations below the expected median for age and gender, expressed in z-scores, were considered as stunted. Children
whose z-scores were ≥-2 standard deviations were
con-sidered appropriate height/age.
The classification of children and adolescents,
accord-ing to BMI/age, was also expressed as z-score, by adoptaccord-ing
the following cutoffs for categorization of results:
under-weight, z-scores ≤-2; adequate under-weight, z-scores >-2 to <1;
and excess weight, here represented by the sum of the two
conditions; overweight/obesity, with z-scores ≥1.
Data analysis included the following variables: weight, age, gender, and geographical location of the school,
which was also inferred as the location of the residence. Age was calculated in months and was obtained by the difference between the date of data collection and date of birth. For the analysis, children and adolescents were categorized into three groups: under 10, 10-15, and older than 15 years.
AnthroPlus-2007 software (WHO AnthroPlus for personal
computers: software for assessing growth of world’s
chil-dren and adolescents. Geneva, Switzerland) was used
in the assessment of nutritional status. All data were entered in duplicate and validated using Epi-Info
soft-ware, release 6.04 (Centers for Disease Control and Prevention. Atlanta, USA).
To classify the nutritional status and define the preva-lence of malnutrition and excess weight, descriptive sta-tistics were used, by simple frequency according to age, gender, and geographical location of the school and the home.
Nutritional status was also assessed by the means of the z-scores and their respective standard deviations accord-ing to age, gender, and geographical location of the school and the home.
The dependent variables height/age and BMI/age were
analyzed as categorical. Statistical associations were esti-mated in relation to these indices, as they represent the highest prevalence of malnutrition and excess weight; this prevalence is currently considered the most characteristic epidemiological expression, and representative of anthro-pometric deviations in the Brazilian pediatric population.14
The chi-squared test was used to compare categorical vari-ables of the groups. This test, with Yates correction, was applied to dichotomous variables, considering a statistical significance of p≤0.05.
To compare the growth curves of the studied
popula-tion with the WHO reference curves, graphs were drawn for height/age and BMI/age indices, using the AnthroPlus 2007 software.
As this was a study based on secondary data related to data from an official government program, the munici-pal managers of this program were asked for a letter of consent allowing the analysis of data and disclosure of results. The project was approved by the Research Ethics
Committee of the Centro de Estudos Superiores de Maceió.
Results
Of the 860 children and adolescents evaluated, 51.7% were males, and 48.3% females. When stratifying by age, 60.7% were younger 10 years, 32.6% were between 10 and 15 years, and 6.7% were older than 15 years. Regarding geo
-graphical location, 84.1% resided and studied in schools located in the urban area, and 15.9% in rural areas. A prevalence of malnutrition of approximately 9% was found,
according to the height/age index, for the population as
a whole. For BMI/age, the prevalence of excess weight, according to the used cutoff, was 24.0% (Table 1).
The prevalence of malnutrition was within the range
of 6% to 21%. The highest prevalence of malnutrition was found in the group of students aged >15 years (20.7%), fol
Table 1 Characterization of the population of children and adolescents, by gender, age, geographical location of the school/home, and nutritional status. Maribondo, AL, 2012
Variables N %
gender
Male 445 51.7
Female 415 48.3
Total 860 100
Age (years)
<10 522 60.7
10-15 280 32.6
>15 58 6.7
Total 860 100
geographical location of the school/home
Urban 723 84.1
Rural 137 15.9
Total 860 100
Height/age
Height deicit 78 9.1
Adequate height 782 90.9
Total 860 100
BMI/age
Malnutrition 17 2.0
Normal weight 637 74.1
Overweight/obesity 206 24.0
Total 860 100
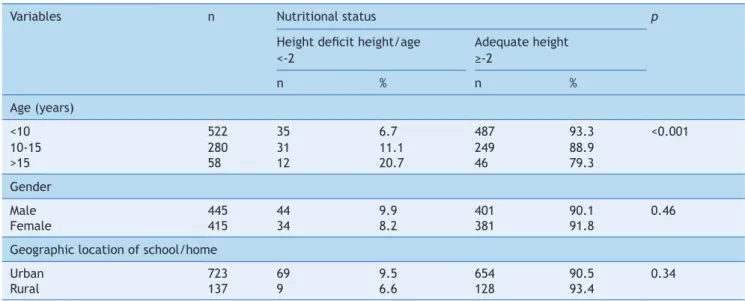
Table 2 Classiication of the nutritional status of children and adolescents according to age, gender, and geographical location of the school/home by height/age index. Maribondo, AL, 2012
Variables n Nutritional status p
Height deicit height/age <-2
Adequate height ≥-2
n % n %
Age (years)
<10 522 35 6.7 487 93.3 <0.001
10-15 280 31 11.1 249 88.9
>15 58 12 20.7 46 79.3
gender
Male 445 44 9.9 401 90.1 0.46
Female 415 34 8.2 381 91.8
geographic location of school/home
Urban 723 69 9.5 654 90.5 0.34
Rural 137 9 6.6 128 93.4
For the other variables, gender and geographic location of school and home, no statistically significant differences
were found between the analyzed categories (Table 2).
Regarding the classification of nutritional status
according to BMI/age, the observed prevalence of over
-weight/obesity ranged between 23.2% and 34.5%, with
no significant differences between the analyzed
catego-ries (Table 3).
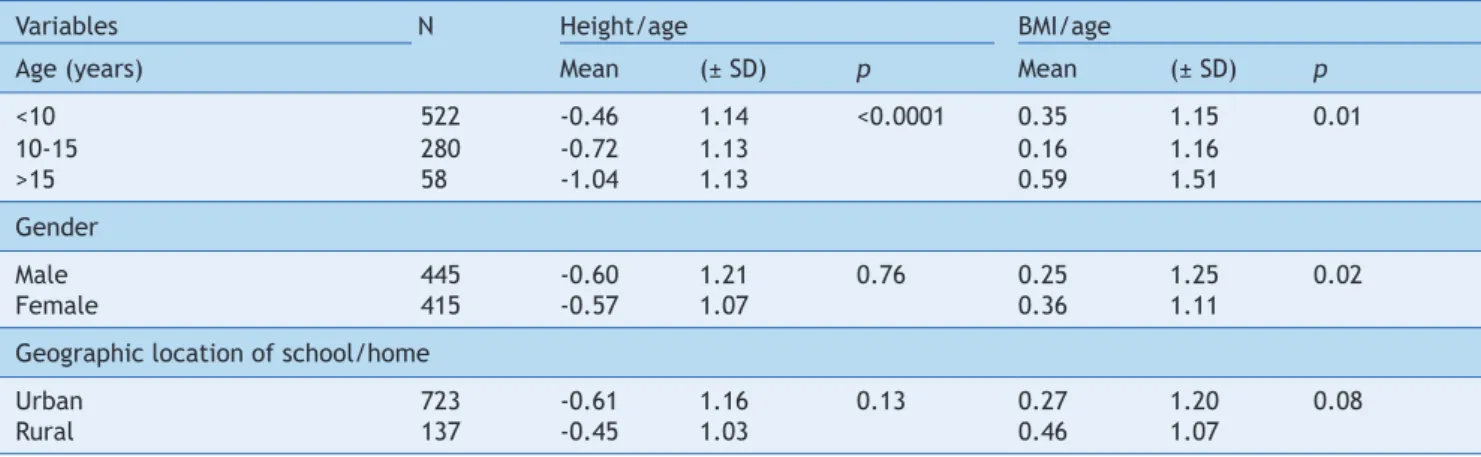
Regarding the z-score values, one can observe lower means for height/age index in the population aged
>15 years. For the BMI/age index, higher values of z-score were also found among those aged >15 years, and in female children and adolescents (Table 4).
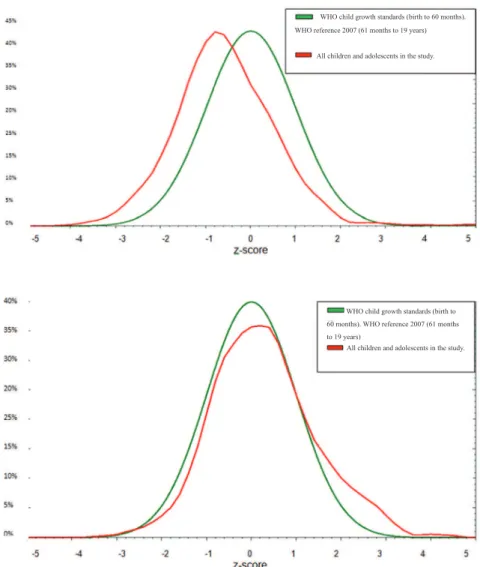
Figure 1 shows the comparison of the height/age
index and BMI/age index curves of the study population
when compared with reference curves proposed by the
World Health Organization. Children and adolescents in
the present study showed, in general, lower values of
z-score for height/age index and higher values for BMI/
age index, when compared to the analyzed reference points.
Discussion
In spite of its enormous potential, the Brazilian semiarid region is marked by great social inequality.15 The results
here demonstrate that the prevalence of excess weight
(24.0%) and stunting (9%) among the assessed children and
adolescents consolidates an antagonism between malnutri-tion and excess weight trends, characteristic of an unfin-ished nutritional transition, and therefore shows the devel-opment of a complex epidemiological profile, marked by the coexistence of malnutrition and obesity, as observed in the Brazilian population in general.1-3,16
Regarding stunting at the age range of 5 to 9 years, which affects the students from public schools in the study municipality, it resembles the situation found in the
Household Budget Survey (HBS)17 for Brazilian children,
in which the prevalence of low height was 6.8%, slightly higher among males (7.2%) than in females (6.3%). To assess
the nutritional status of the adolescent population studied
by Household Budget Survey (HBS) 2008-2009, the authors considered only the anthropometric BMI/age index, not
Table 3 Classiication of the nutritional status of children and adolescents according to age, gender, and geographical location of the school/home by BMI/age index. Maribondo, AL, 2012
Variables n Nutritional status p
Malnutrition <-2
Normal weight -2 to 2
Overweight/obesity
n % n % n %
Age (years)
<10 522 7 1.3 394 75.5 121 23.2 0.14
10-15 280 8 2.9 207 73.9 65 23.2
>15 58 2 3.4 36 62.1 20 34.5
gender
Male 445 12 2.7 330 74.2 103 23.1 0.26
Female 415 5 1.2 307 74.0 103 24.8
geographic location of school/home
Urban 723 16 2.2 535 74.0 172 23.8 0.51
Rural 137 1 0.7 102 74.5 34 24.8
Table 4 Mean z-scores of children and adolescents by variables: age, gender, and geographical location of the school/home, according to height/age and BMI/age indexes. Maribondo, AL, 2012
Variables N Height/age BMI/age
Age (years) Mean (± SD) p Mean (± SD) p
<10 522 -0.46 1.14 <0.0001 0.35 1.15 0.01
10-15 280 -0.72 1.13 0.16 1.16
>15 58 -1.04 1.13 0.59 1.51
gender
Male 445 -0.60 1.21 0.76 0.25 1.25 0.02
Female 415 -0.57 1.07 0.36 1.11
geographic location of school/home
Urban 723 -0.61 1.16 0.13 0.27 1.20 0.08
Rural 137 -0.45 1.03 0.46 1.07
As for the height/age index, a high percentage of
stunt-ing (20.7%) was observed in adolescents aged 15-19, show -ing a statistically significant difference compared to the
other assessed age ranges. When comparing the means of
the z-scores for the height/age index of the age groups analyzed, a statistical difference was observed between the values, confirming the presence of stunting also among those older than 15 years.
These differences between the age groups analyzed may be explained by the decrease in stunting, as shown in the
Brazilian population, with a decrease from 29.3% (1974-75) to 7.2% (2008-9) in boys, and 26.7% to 6.3% in females
between 5 and 9 years, according to data from nation-wide studies developed in Brazil in the last decades.18,19
In accordance with these data, Ferreira et al, analyzing the temporal trend of stunting in children younger than 5
years in the state of Alagoas, found a decrease from 22.5% to 11.4% in its prevalence between 1992 and 2005.20
Regarding excess weight, the study also observed a higher than expected prevalence for the entire population
studied, ranging from 23.2% to 35.5% in all age groups rep -resented. It is noteworthy that there were more female
children and adolescents with excess weight, corroborat-ing the studies by Vieira et al21 and guedes et al,22 which,
when investigating the prevalence of excess weight among children and adolescents, found that female gender was a significant associated factor.
Excess weight in children and adolescents, in general, may be a reflection of changes related to lifestyle observed in large cities, with similar trends also appearing to occur in small towns.3 Another noteworthy fact is the progression
of excess weight with increasing age observed in this study. Previous studies have warned that there is a high risk for obese adolescents to become obese adults, when compared to individuals who were only obese in childhood.23,24
Moreover, at this phase of life, habits are deeply influ -enced by friends or imposed by the media, thus constitut-ing a difficult phase to adopt healthy eatconstitut-ing habits and prevent a sedentary life style. Children and adolescents are increasingly exposed to diets with excess fats that are poor in fruits and vegetables, and there is a positive association between hours spent on sedentary activities
(television, video games, computer) and the increase in
Regarding the variable geographical location of the school
and home, the two diseases in question (malnutrition and excess weight) do not appear to differ in terms of
preva-lence in the analyzed categories. There was no difference between the assessment of the nutritional status of chil-dren and adolescents who studied and lived, respectively, in schools and homes located in the urban and rural areas of the municipality. Studies have shown that living in small towns and, in general, in rural areas, may be a protective factor for diseases such as obesity.27 However, the
epidemio-logical data found in the present study provided evidence that this reasoning does not reflect the reality in all regions. Regarding the growth standards of the children and ado-lescents evaluated, it was observed that they follow the
international standards proposed by the WHO, although
demonstrating a deficit regarding the expected standard
for height/age and for BMI/age, a shift that also indicates
higher proportions of excess weight in this population, when compared to the reference. Therefore, the curve shows a shift to the left for the height/age index, and a
shift to the right for the BMI/age index.
This nutritional assessment, performed throughout Brazil
and promoted by the Brazilian Ministries of Health and
Education, was shown here as the portrait of the nutritional status of schoolchildren from 5 to 19 years in a northeast-ern municipality. Therefore, it is concluded that the preva-lence of stunting and excess weight among schoolchildren
in Maribondo during the studied period affected all age
groups analyzed and, more markedly, individuals older than 15 years and the female gender. These results indicate the occurrence of nutritional transition, now nearing comple-tion in developed countries, are also being consolidated in small cities, as it has been occurring in the Brazilian popu-lation – a fast decrease in the occurrence of malnutrition and an increasing prevalence of overweight and obesity.
Despite the limitations inherent to studies with non-probabilistic sampling procedures, the demographic and socioeconomic indicators of the population studied here are homogeneous among populations living in the semiarid Northeast Region, assuming that the findings have exter-nal validity for regions with similar characteristics.28 Thus,
the results of the present study demonstrate that, in this population, the issue of excess weight should be treated, in terms of public policy, with the same attention and care demanded by malnutrition, in order to contribute to the improvement of schoolchildren’s nutritional status.
Figure 1 Comparison of the growth curve of children and adolescents with the
World Health Organization (WHO) curve, according to height/age and BMI/age indexes. Maribondo, AL-2012. WHO child growth standards (birth to 60 months).
WHO reference 2007 (61 months to 19 years)
All children and adolescents in the study.
For that, the authors emphasize the importance of involving not only the health and education sectors in the process, but also understanding the importance of partner-ships to overcome the determinants of the health-disease process, defining different actions by different Brazilian ministries (Education, Cities, Sport, Land Development, Social Development, Environment, Agriculture/EMBRAPA, Labor, and Planning), and non-governmental organizations, businesses, and civil society, in order to enable interventions that will have a positive impact on the decrease of over-weight/obesity and to achieve the goals proposed by the Strategic Action Plan Against Chronic Non-Communicable Diseases in Brazil, created by the Ministry of Health, which
includes reducing the prevalence of obesity in children and adolescents.29
Considering the presented facts and the innumerable social inequalities found in the semiarid setting, it is sug-gested that further studies are conducted in order to imple-ment actions that contribute to ensure access to health care, education, and quality of life, preventing disorders, especially nutritional, which may compromise the growth and development of these children and adolescents.
Conlicts of interest
The authors declare no conflicts of interest.
References
1. Batista Filho M, Rissin A. Nutritional transition in Brazil: geographic and temporal trends. Cad Saude Publica 2003;19:181-91.
2. Brasil - Instituto Brasileiro de Geograia e Estatística. Pesquisa de Orçamentos Familiares 2008-2009: antropometria e estado nutricional de crianças, adolescentes e adultos do Brasil. Rio de Janeiro; 2010.
3. Leal VS, Lira PI, Oliveira JS, Menezes RC, Sequeira LA, Arruda Neto MA et al. Overweight in children and adolescents in Pernambuco state, Brazil: prevalence and determinants. Cad Saude Publica 2012;28:1175-82.
4. Menezes RC, Lira PI, Oliveira JS, Leal VS, Santana SC, Andrade SL et al. Prevalence and determinants of overweight in preschool children. J Pediatr (Rio J) 2011;87:231-7.
5. Monteiro CA, Conde WL, de Castro IR. The changing relationship between education and risk of obesity in Brazil (1975-1997). Cad Saude Publica 2003;19 (Suppl 1):S67-75.
6. Brasil - Presidência da República. Decreto nº 6.286, de 5 de dezembro de 2007. Institui o Programa Saúde na Escola - PSE, e dá outras providências. Brasília: DOU; 2007.
7. World Health Organization. Multicentre growth reference study group. Who child growth standards: length/height-for-age, weight-for-age, weightfor-for-length, weight-for- height and body mass index-for-age: methods and development. geneva: WHO; 2006.
8. Brasil – Secretaria de Estado do Planejamento e do Desenvolvimento Econômico [homepage on the Internet]. Peril Municipal – Maceió, 2012 [cited 2013 Feb 20]. Available from: http://informacao.seplande.al.gov.br/peril-municipal/ relatorios/Municipal_Maribondo_2012.pdf
9. Programa das Nações Unidas para o Desenvolvimento [homepage on the Internet]. Atlas do desenvolvimento humano
no Brasil [cited 2013 Feb 20]. Available from: http://www. pnud.org.br/rdh
10. Brasil - Presidência da República. Portaria nº 357, de 1º de março de 2012. Institui a Semana Anual de Mobilização Saúde na Escola (Semana Saúde na Escola) e o respectivo incentivo inanceiro, e estabelece regras especíicas para a execução no ano de 2012. Brasília: DOU; 2012.
11. World Health Organization. Physical status: the use and interpretation of anthropometry. Geneva: WHO; 1995. 12. Fagundes AA, de Barros DC, Duar HA, Sardinha LM, Pereira MM,
Leão MM. Vigilância Alimentar e Nutricional - SISVAN: orientações básicas para a coleta, o processamento, a análise de dados e a informação em serviços de saúde. Brasília: Ministério da Saúde; 2004.
13. World Health Organization. Anthro plus for personal computers: software for assessing growth and development of the world’s children. 2nd ed. Geneva: WHO; 2007.
14. Monteiro CA, Conde WL. Secular trends in malnutrition and obesity among children in S. Paulo city, Brazil (1974-1996). Rev Saude Publica 2000;34:52-61.
15. Cavalcanti ER, Coutinho SF, Selva VS. Desertiicação e desastres naturais na região do semi-árido brasileiro. Rev Cad Estudos Sociais 2006;22:19-31.
16. Leal VS, Lira PI, Menezes RC, Oliveira JS, Costa EC, Andrade SL. Malnutrition and excess weight in children and adolescents: a review of Brazilian studies. Rev Paul Pediatr 2012;30:415-22 17. Instituto Brasileiro de Geograia e Estatística - IBGE. Pesquisa
de orçamentos familiares 2008-2009: antropometria e estado nutricional de crianças, adolescentes e adultos no Brasil. Rio de Janeiro: IBgE; 2010.
18. Brasil - Instituto Nacional de Alimentação e Nutrição. Pesquisa Nacional sobre Saúde e Nutrição: peril de crescimento da população brasileira de 0 a 25 anos. Brasília: INAN; 1990. 19. Brasil - Instituto Brasileiro de Geograia e Estatística. Estudo
Nacional da Despesa Familiar: consumo alimentar e antropometria - regiões I e II. Rio de Janeiro: IBgE; 1993. 20. Ferreira HS, Cesar JA, Assunção ML, Horta BL. Time trends
(1992-2005) in undernutrition and obesity among children under i ve years of age in Alagoas state, Brazil. Cad Saude Publica 2013;29:793-800.
21. Vieira MF, Araújo CL, Hallal PC, Madruga SW, Neutzling MB, Matijasevich A et al. Nutritional status of irst to fourth-grade
students of urban schools in Pelotas, Rio grande do Sul state, Brazil. Cad Saude Publica 2008;24:1667-74.
22. guedes DP, Paula Ig, guedes JE, Stanganelli LC. Overweight and obesity prevalence in children and adolescents from a private school in Recife. Rev Bras Educ Fis Esp 2006;20:151-63. 23. Lindsay AR, Hongu N, Spears K, Idris R, Dyrek A, Manore MM.
Field Assessments for obesity prevention in children and adults: physical activity, itness, and body composition. J Nutr Educ Behav. In press 2013.
24. Chagas DC, Silva AA, Batista RF, Simões VM, Lamy ZC, Coimbra LC et al. Prevalence and factors associated to malnutrition and excess weight among under ive year-olds in the six largest cities of Maranhão. Rev Bras Epidemiol 2013;16:146-56.
25. Henriques P, Sally EO, Burlandy L, Beiler RM. Regulation of publicity for children’s food as a strategy for promotion of health. Cien Saude Colet 2012;17:481-90.
26. Rech RR, Halpern R, Costanzi CB, Bergmann ML, Alli LR, Mattos AP et al. Prevalence of obesity and overweight in schoolchildren aged 7 to 12 years from a city in southern Brazil. Rev Bras Cineantropom Desempenho Hum 2010;12:90-7.
28. Medeiros SS, Ccavalcante AM, Perez Marin AM, Tinôco LBM, Hernan SI, Pinto TF. Sinopse do censo demográico para o semiárido brasileiro. Instituto Nacional de Seminário (INSA). Campina grande: INSA; 2012.