Bull Pan Am He& Organ
E(3),
1981.
PROTEIN-CALORIE
MALNUTRITION
IN THREE
BRAZILIAN
STATE CAPITALS:
SdO LUfS,
RECIFE,
AND SdO PAULOlJ
Malaquias
Batista Filho, 3 Maria Anunciada Ferraz de Lucena,3 and
Heloisa de Andrade Lima Coelho3
A stuaj~ of protein-calorie malnutrition in the Brazilian state capitals of Reci- fe, Sr70 Lu$ and Srio Paul0 was conducted to compare the situation prevail-
ing in those cities and to assess dtjknt rnethoak of nutritional evaluation. The results clear& showed sign$cant di&rences in the protein-caloric mal- nutrition patterns prevailing in the three cities.
Introduction
Because they relate to an essentially ecolog-
ical problem, protein-calorie malnutrition
patterns can be quantitatively and qualita-
tively differentiated in terms of a population’s
demographic characteristics, food consump-
tion, and non-nutrition-related pathologies.
Indeed, the comparative study of malnutrition
(with regard to both its magnitude and mani-
festations) represents one of the most valid
descriptive and analytical methods of epi-
demiologic evaluation.
Obviously, however, inferences drawn
from comparative studies will only be con-
sistent when uniform, standardized method-
ologies are used, it being impossible to gmer-
alize when similar situations are evaluated
with different methods. Moreover, the pro-
visional nature of the tools for gauging nutri-
tional status has led to a multiplicity of meth-
ods being employed-making close compar-
‘Also published in Portuguese in the B&tin de la Of;- ck Sanitarih Panmerkana 90(1):48-58, 1981.
ZCollection of the Recife and SZo Luis data was sup- ported by the World Health Organization, and collection of the SZo Paul0 data was supported by the Ford Founda- tion.
3Assistant Professor, Department of Nutrition, Federal University of Pernambuco; and research fellow, National Council of Scientific and Technological Development (Brazil).
ison of results impossible and removing all op-
portunity for obtaining a geographic overview
of the nutrition problem.
These fundamental observations suggested
that it would be desirable to conduct a nutri-
tional survey in several major Brazilian cities
with the broad goal of detecting similarities
and differences in the prevailing patterns of
protein-calorie malnutrition (PCM). The
cities selected for this purpose were SBo Lufs
(in Maranhgo State), Recife (in Pernambuco
State), and SZo Paul0 (in SZo Paul0 State).
Although nutritional surveys had been con-
ducted fairly recently in the three cities
(3, II, 21), different surveys were developed
independently, and so the potential for com-
parison was limited. Specifically, in SZo Lufs
and Recife the study populations’ nutritional
status had been defined in terms of the G6mez
(15), Jelliffe (17), and Waterlow (33) classi-
fications, with the Harvard table (29) being
used as the anthropometric standard. In SZo
Paulo, on the other hand, the subjects were evaluated in terms of the G6mez (15), Ariza-
Ma&as (I), Seoane-Latham (modified by
one of ourselves) (31, and Kanawati-McLaren
(20) classifications; and the anthropometric
standard used was the Santo And& IV stan-
dard officially recommended by the Brazilian
Pediatric Society and the National Food and
Nutrition Institute (24).
Figure 1. A map of Brazil showing the location of the three
state capitals included in the study.
Nevertheless, the availability of anthro-
pometric data on children under five years of age in each of these cities presented an oppor-
tunity to develop various lines of study of
PCM in these areas through application of a
single methodology. Such work, it was felt,
would enhance the possibilities for drawing in-
ferences about the geographic distribution of
PCM in Brazil.
Background Data
SIo Luis is a city of 300,000 inhabitants in
the western part of the Brazilian Northeast.
Information based on hospital statistics sug-
gests that the prevalence of kwashiorkor is
higher there than would normally be expected
in other cities. During a visit to the Children’s
Hospital of SZo Luis, one of the authors con-
firmed that more than half the children admit-
ted had edema or a history of edema. The
rural areas near the city are inhabited largely
by families engaged in the cultivation of rice,
cassava, and corn and the extraction of ba-
bassu-palm oil. This pattern of activities pre-
sumably exerts a strong influence on both mi- gratory flows affecting the city and the food supplied to the population.
Recife, a Northeast city with 1,300,OOO in-
habitants, is in an area economically domi-
nated by sugar-based agroindustry and has at-
tained an intermediate level of industrial de-
velopment. The city thus presents a cultural
and economic picture quite different from that of SIo Luis. Data from the Inter-American
Investigation of Mortality in Childhood (31)
Batista et al. l PCM IN BRAZIL 233
nutrition associated with infections in the
mortality “model” found locally in Recife.
SZo Paul0 is now Latin America’s most
populous city and largest industrial center; it
attracts immigrants from all parts of Brazil
and even from other countries (notably Japan,
Italy, Portugal, and Spain). It therefore pos-
sesses characteristics markedly different from
those of both SZo Luis and Recife. And even
though the Inter-American Investigation of
Mortality in Childhood found a frequent as-
sociation between PCM and mortality in SHo
Paul0 (31), the United Nations Food and
Agriculture Organization (FAO) has classified
SZo Paul0 (like the rest of southern Brazil) as
an area where PCM is probably not a public
health problem (30).
Objectives
It was felt that application of uniform para-
meters, besides detecting quantitative nutri-
tional differences, would be likely to show
qualitative differences in the forms of mal-
nutrition prevailing in each of these cities.
Such qualitative differences would be attrib-
utable to variations in prevailing environ-
ment, agent, and host relationships resulting
in different levels of adaptation in each area.
And so, by identifying the “adaptational bio-
types” (22) associated with the nutritional
status of a given population, it should be
possible to arrive at a reasonably reliable
determination of the end result of the interac-
tion of these three elements.
It is also very possible that prevalences of
the various types of PCM in Brazil’s state
capitals and major cities can be fundamentally
represented as intermediate between those
found in SBo Paul0 on the one hand and SBo Luis and Recife on the other. That is, it can be assumed with reasonable assurance that the
prevalence of PCM in the major Brazilian
cities ranges between minimum values (such
as those found in SBo Paulo) and maximum values (such as those found in Recife and S?io
Luis). For few large Brazilian cities have con-
ditions significantly better than SIo Paulo’s,
while Recife and SIo Luis provide notable ex-
amples of poor urban communities. Conse-
quently, the information collected could be
used as a possible point of reference for assess-
ing the prevalence of PCM throughout the
country, or at least for constructing prelimi-
nary geographic models of PCM distribution
in densely populated urban areas.
Another objective was to study the meth-
odology for evaluating nutritional status. For
the most part, anthropometric indicators-or
at least the criteria employed to interpret
them-can still be considered experimental.
With the exception of the GBmez classification
and arm-circumference measurement (2,4,8,
l&12,13,14,16,19, and 25), these indicators
have not been extensively applied to diverse
populations using standardized techniques.
This situation is doubly inconvenient; besides
impeding comparative studies of different re-
gions, it also makes it hard to evaluate the ef-
fectiveness of the indicator used; for such an
evaluation obviously depends upon the indi-
cator’s performance (sensitivity and speci-
ficity) in a variety of diverse situations. In this vein, the project described here ex-
plored two subjects in a preliminary manner.
These were (a) correspondence between the
GBmez weight-for-age classification (1.5) and
the Ariza-Macias height-for-age classification
(I), and (b) the potential for qualitatively dis-
criminating between four nutritional states
( no malnutrition, recent malnutrition,
chronic malnutrition, and previous malnu-
trition) by means of the modified Seoane-
Latham height-for-age and weight-for-height
classification (3). These hypothetical relation-
ships satisfactorily incorporate most of the
basic clinical and epidemiologic data used to
characterize PCM morbidity. Indeed, they
were proposed with the aim of finding a bat-
tery of nutritional indicators that could be
used in epidemiologic surveillance programs.
In sum, the objectives of the project de-
scribed here were as follows:
. to make a comparative study of the prev-
Paulo, and to present the outlines of an
epidemiologic model of PCM in each of those
cities;
l to provide points of reference useful for
estimating the extent and severity of malnu-
trition in other major Brazilian cities; and
l to study indicators of nutritional status
that might be incorporated into epidemiologic
surveillance programs, or that might even be
used as tools for clinical characterization of
malnutrition.
Materials and Methods
The study included 2,929 children (1,006 in
S”ao Luis, 1,169 in Recife, and 754 in SHo
Paulo). The children in the SFio Paulo sample were chosen from 165 separate areas by select- ing two or three families in each area to be in- cluded in the study. In Recife, streets and families in 20 areas were chosen at random; and in SZo Luis, families were chosen at ran- dom from three areas denoted by the Maran-
hZo State Institute of Economic and Social
Research as being representative of that city.
Table 1 shows the composition of the sample
by city and age group.
The nutritional status of the children was
determined by applying the G6mez (15), Ari-
za-Ma&as (l), and modified Seoane-Latham
(3) criteria. The Santo Andre IV scale (24)
was adopted as the standard for determining
anthropometric normality.
Data from some children in the present
study, especially ones in the Recife sample,
were not included in Tables 4 and 5 because these children could not be rated in terms of
the measurements listed in the Brazilian table
of anthropometric standards, and so they
could not be classified. The children involved included some of those O-5 and 12-23 months old in Recife and O-5 months old in Sgo Luis that are listed in Table 1.
Statistical analysis of the results employed a
proportionality test (percentage error dif-
ference), accepting 5 per cent as the critical
value for risk of false rejection of the negative
hypothesis. The study only considered the
Table 1. Children included in the study in SPo Paula, Recife, and SZo Lufs, by age group.
No. of children in each city 4~ BTOUP
(in months) o- 5 6 - 11 12 - 23 24 - 35 36 - 47 48 - 59 Total
Sal Paul0 Recife szo Luh
- 132 127
132 118 89
155 244 228
164 233 205
158 238 167
145 204 190
754 1,169 1,006
prevalence of malnutrition in the total sample
from each city, making no comparisons be-
tween the different age groups.
Results
Height-for-Age
In the SZo Paul0 sample, 5.4 per cent of the children were found to be shorter than -2 S.D.
on the standard table, and were therefore clas-
sified as cases of markedly short stature
(nanism) according to the criteria of Mar-
condes (23). In Recife the percentage of sub-
jects exhibiting nanism was higher (22.6 per
cent), and in Sfo Luis it was higher still (36.1 per cent). The differences between these vari-
ous figures are significant at the 5 per cent
level. As Table 2 shows, the percentage of
Recife and Sgo Luis subjects exhibiting na-
nism was notable even among infants in their first six months of life.
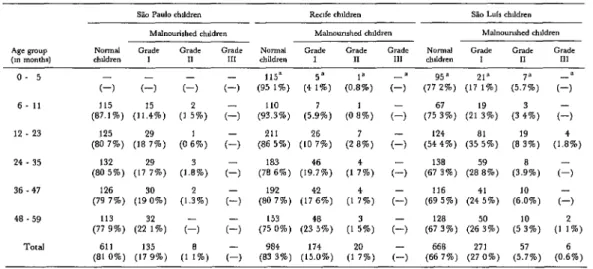
Weight-for-Age
Of the children surveyed in SZo Paulo, 3 1.5
per cent were malnourished according to the
G6mez classification, but only 3.6 per cent
were suffering from grade II or grade III mal-
nutrition. In Recife the respective figures
were 47.3 per cent (total) and 11.5 per cent (grades II and III), and in SIo Luis they were 71.5 per cent (total) and 25.7 per cent (grades
Batista et al. l PCM IN BRAZIL 235
Table 2. Cases of naoism (markedly abort stature) found amang study child ren in the three cities, by age group.
S-do Paul0 Recife sio his
o- 5 - - - - 111 84 1 21 15.9 112 88.2 15 11.8
6. 11 131 99.2 1 0.8 95 80.5 23 19.5 72 80 9 17 19.1
12 23 148 95 5 7 45 192 78.7 52 21 3 133 58 3 95 41 7 24 35 152 92.7 12 7.3 169 72.5 64 27.5 107 52 2 98 47 8 36 - 47 150 94.9 8 5.1 178 74.8 60 25.2 103 61 7 64 38 3 48 - 59 132 91 0 13 90 160 78 4 44 21.6 116 61 1 74 38 9 TCd 713 94.6 41 54 905 77 4 264 22.6 643 63 9 363 36 1
these data appears in Table 3. Again, the dif- ferences between the total percentage of mal-
nourished children in each city sample and
between the percentage in each sample with
grade II or III PCM were statistically signifi-
cant.
Weziht-for-Height
Applying the Ariza-Ma&as weight-for-
height criteria (‘1) as shown in Table 4, 19 per
cent of the children in the S?io Paulo sample
were found to be malnourished, 17.9 per cent
exhibiting grade I malnutrition (10 to 20 per
cent below the normal weight-for-height). The
respective figures for Recife were 16.7 and 15 per cent, and for SLo Luis were 33.3 and 27 per cent. No cases of severe (grade III) mal-
nutrition were found by applying these cri-
teria to subjects in SZo Paul0 or Recife.
Overall, by these criteria SBo Luis appeared to
differ significantly from the other two cities.
Seoane-Latham Classification
According to the Seoane-Latham classifica-
tion, as modified by one of us, the cases where height is adequate for age and weight is ade-
quate for height can be rated “normal”; the
cases where height is adequate for age but
weight is low for height can be rated “recent
malnutrition’ ’ ; the cases where height is low
for age and weight is low for height can be
rated “chronic malnutrition”; and the cases
where height is low for age but weight is ade-
quate for height can be rated “previous
malnutrition. ”
Applying this classification, there appeared
Table 3. Nutritional status of the study children as indicated by the GBmcz weight-for-age classification, by age group, showing the number and percentage (in parentheses) of children in each group within each nutritional category.
6. 11 12 - 23 24 - 35 36 47 48 59
Sll Pado rhddrcn Rcufc Lhlldren sio Luir chrldmn Malnounshed lhlkh” Maln<~“rnhed hldre” Ma,“u”nrhed <h&ire” Nwrd Grack Gradr Cradr NIlrId Grade Cradr Grade NWlll‘d Cradc Grade Grade rhddrcn I II 111 hldre” I II III lhlkk” I II 111
(1) c-1 (1) c-, (66878%) (243:%) (6 k&X) (2 ,“%) (52687%) (33”:%, (lo’:%) (3 9”%)
101
(76 5%) (,s%, (7) (1) (647:%/,) (2S384%) (4 2%) (2 ,“%) (47422%) (32’,‘%, (16’85%) (3 :%) I LO
(71 0%) (25480%) (1 g”%, (1 32%) (5b202%) (368:%) (l,::%) (2:%) (225:%) (39?%) (317:%) (7’:%) 107
(65 2%) (3d:W) (4 :%) c-, 117
(502%) (358:%) (12208%) (2 :w, (22”,‘%, (5:O;w) (22405%) (3 :%) 102
(646%) (32”,‘%, (1 93%) (O;%) (5:,%, (40g:%) (132;%) -
(-) (2Oas%, (5E%) (*4244%) (4:%0/o) (66”,%, (25”:%, (7’j%) (7 (45’:%, (41’:%) (11284%) (1 43%) (234:%) (50905%) (23”:%, (2 65%) TO&Xl 517 210
Table 4. Nutritional status of the study children as indicated by the A&a-Ma&s weight-for-height classification, by age group, ahowing the number and percentage (in parentheses) of child ren in each group within each nutritional category.
Slo Paula chlldm” Rec~fe chlldre” Sk, Luls chlldre” Malnourished chJdre” Malnounshed chddren Malnounshcd ch,,drc” Normal Grade Grade Grade Normal Grade Grade Grade Nomal Grade Grade Grade chlldm” 1 I1 III chiidrr” I II III chddrc” I II III o- 5
c-1 c-1 6- 11
12. 23 (80 7%) 125 (18279%)
(1)
(I :%)
115” (95 1%)
110 (93.3%)
(4 :;, (O.&i)
a a
(77g25%) (u2:%) (75?%) (2lYW)
(5.:;) (3 43%)
a (1, (1)
4
c-1
(1)
c-1
(1)
(1,
(1)
(0 iw, (2 s7%, (5.9%) (0 i%, (86 5%) 211 (10276%)124
(54 4%) (35s:%) (8?% ) (3.98%)
(1.84%)
24 . 35 132
(80 5%) (17279%)
(1.83%)
183(78 6%) (19?%) (1 :w, (I :,, (l,“%) (*270%)
138
(67 3%) (28589%) (1,
(1,
(1 :w,
(O.,“,,
36 .47 (79 7%) 126 (19300%) 48 .59 (77 9%) 113 (223fW)
Total 611 135
(81 0%) (17 9%)
(1.32%)
192 (80 7%)153 (75 0%)
984 (83 3%)
(17462%/.)
116 (69 5%) (244:%)
128 (67 3%) (265:%)
668 271 (66 7%) (27 0%)
(6!,“%)
(5?%) (5?%, (23458%) 174 (15.0%)to be little difference in the rates of recent sated” malnutrition (3.4 per cent in SZo
(short-duration) malnutrition in the samples, Paulo, 5.5 per cent in Recife, and 15 per cent
the rates being 11.2 per cent in Recife, 17.0 in SZo Luis) were also found.
per cent in Go Paulo, and 18.1 per cent in
Go Luis. However, as Table 5 shows, there Discussion
was a marked difference in the rates of chronic
malnutrition observed in %o Paul0 (2.0 per So Paul0
cent) and in Recife and SZo Luis (17 and 2 1
per cent, respectively). Important differences The nutritional status of the study children
between the rates of previous or “compen- in each city conforms closely to predictions of
Table 5. Nutritional statw of the study children aa indicated by the modified Seoane-Latham classification. by age group, showing the number and percentage (in parentheses) of children in each group within each nutritional category.
o- 5
6-11 114
(86 4%)
(1,
t-,
(1,
(1,
(0 l%,
a 4’ (81’89%) (3 3%)
a
(13’26%)
(I:;,
a .I
(6g8:%) (192:%,
a 4a (SIP%) (3 3%) (IO :,, (9 it%) (15386%) (*5599%) (12?%) (75649%) (5 f%, (1 :,, (65528%) (15’74%)
(38868%) (194:%) 12 - 23 122
(78 7%) 24 - 35 125
(76 2%) 36 - 47 121
(76 6%)
(16286%) (2 ,“%, (3 ,“%, (I ,“%,
(1 s”%,
(70 9%) L73d (7’89%) 4 139(59 7%) (12390%) 144
(60 5%) (,4334%) 123 (60 3%) (183:%)
767 130 (66 3%) (II 2%)
(4 :,,
(1844%)
(2046%) (la70%, 197 (17 0%)
(387:%) (Id:%, (427:%) (Id:%, (426:%, (le396%)
460 181 (45 9%) (I8 I %)
(306:%) (16364%) (264:%) (I I’:%) (25*38%) (U276%)
211 150 (21 0%) (15 0%) (3 :,,
(6l90% ) (3’,“%,
TOtal 585
(77 6%)
Batista et al. l PCM IN BRAZIL 237
Berg (9) and Jelliffe (18) stating that applica-
tion of the weight-for-age criteria will show
between one-third and two-thirds of the chil-
dren in the developing world to be malnou-
rished. Nevertheless, a WHO map of PCM’s
worldwide distribution (30) indicates the
states of southern Brazil (including Slo Paulo)
as being areas, in theory, where endemic
PCM is not a public health problem. A previ-
ous paper by one of the authors (3) based on
our Slao Paulo data arrived at conclusions
along the latter lines contradicting those of
Rosenberg (32).
In terms of our study’s findings, although
the G6mez weight-for-age criteria indicated
that nearly a third of the SEo Paul0 children had PCM, only small percentages were found to be suffering from moderate or severe mal-
nutrition (3.2 and 0.4 per cent, respectively).
Since these latter are the forms of PCM asso-
ciated with mortality and sequelae, that find-
ing indicates the problem has less epidem-
iologic significance than would otherwise be
the case. In fact, it suggests that the problem is first and foremost a social one, raising serious
questions about the population’s quality of life
but relegating the immediate public health
risks to a level of secondary importance.
In general, the marked predominance of
mild (grade I) or “recent” malnutrition cases
among those indicated by applying the Ariza-
Macias and Seoane-Latham classifications
supports this conclusion, Basically, what was
found in SZo Paulo was sporadic malnutrition
of short duration, possibly associated with in-
fectious processes that were also sporadic and
probably primary. Thus, a model emerged in
which sequelae occurred only rarely, and in
which only 5.4 per cent of the children sur-
veyed appeared to exhibit nanism according
to the Marcondes criteria (see Table 2). Con-
sidering that the frequency of nanism among
children defined as anthropometrically nor-
mal by the Santo Andre IV standard (24) is
2.5 per cent, this 5.4 per cent prevalence is
low. Overall, the 2.9 per cent difference be-
tween the two figures represents the probable
impact of PCM on the growth pattern of SZo Paul0 children under five years of age.
Before generalizing on the basis of these
conclusions, certain reservations should be
noted. First, the SBo Paulo data cannot be ex-
trapolated to cover all of southern Brazil; for
Monteiro, working in the Ribeira Valley of
SZo Paul0 State, has shown that the PCM pic-
ture is far different from that prevailing in the
city of SZo Paulo (27,28). Second, there is
evidence that malnutrition is becoming more
common among children less than 1 year of
age in the city of SZo Paulo (3,28). This trend, consistent with those reported from other ur- ban centers by various authors (5,7,16,26,34),
points to a health problem that unquestion-
ably merits serious attention.
Comparisons with Recije and So Luis
As already noted, the PCM picture found in Recife and %io Luis differed markedly from that found in SZo Paul0 in terms of both PCM
prevalence and PCM severity. The combined
cases of moderate (grade II) and severe (grade
III) PCM were three times more prevalent in
Recife and seven times more prevalent in SHo
Luis than they were in S?io Paulo-even
though the prevalence of all kinds of malnu-
trition (including grade I) was only 1.5 times
as high in Recife and 2.2 times as high in Slo Luis.
This appears to be a comparative parameter
of critical importance. That is, besides the
overall prevalence of malnutrition being
higher, the higher prevalence of grade II and
grade III PCM denotes the relatively worse
nutritional situations in Recife and SBo Luis.
This is especially true in the case of S&o Lufs,
a city where the distribution of PCM is re-
garded as representative of the PCM situation
in all of northeastern Brazil (6).
In contrast, the Ariza-Macias weight-for-
height classification did not reveal marked dif-
ferences in the patterns of malnutrition pre-
vailing in SZio Paulo, Recife, and SIo Lufs,
the modified Seoane-Latham classification
show such differences. It appears premature
to draw any hard and fast conclusions from
our experience to date, but there are strong
indications that children with deficient weight
for age in the former classification system
could not be expected to exceed 25 per cent of
any given population. In other words, major
variations in frequency would not normally be
expected. These points lead to the important
methodological conclusion that it would be in-
advisable to use the weight-for-height ratio for
purposes of epidemiologic assessment, be-
cause markedly different areas with very di-
verse nutritional situations could appear as
uniform or at least not very different.
However, when the Seoane-Latham clas-
sification is used to separate subjects without
malnutrition or with “recent” malnutrition
from subjects with “chronic” or “previous”
malnutrition, then the epidemiology of the
problem becomes clear. For example, in terms
of the “chronic” and “previous” forms of
malnutrition (i.e., the duration of marked
malnutrition capable of compromising skeletal
growth) Recife and SZo Luis are clearly
distinguished from S”ao Paulo. However, the
weights of many of the children with nanism
show satisfactorily adjusted bodily propor-
tions, which is to say an adequate weight for height, suggesting that these are at least tem-
porarily compensated forms of malnutrition.
Overall, our data indicate that nutritional
nanism arising from “chronic” or “previ-
ous” malnutrition is the most distinctive an-
thropometric feature of the PCM problem in
these two northeastern cities.
The nutritional patterns observed in Recife
and S”ao Luis also differ quantitatively and
qualitatively from each other. Application of
the G6mez and Ariza-Macias classifications
suggest significantly higher incidences of
moderate and severe malnutrition, nanism,
and “previous” malnutrition in %o Luis
than in Recife. Obviously, the PCM problem
is much more serious in SZo Luis. It should be
reiterated, however, that from a methodologic
viewpoint the Ariza-Macias classification does
not show the relevant differences in nutri-
tional status so clearly as the other two
methods.
In general, it appears likely that few large
or small Brazilian cities have a nutritional
situation significantly less favorable than that
found in SHo Luis. But conversely, few cities
would seem likely to possess nutritional situa-
tions much better than those found in SZo Paulo. And, at least so far as major cities are
concerned, it seems likely that the country’s
true urban nutritional profile, in anthropo-
metric terms, falls within the limits indicated by the patterns found in Sgo Paul0 and SBo
Luis. Overall, for purposes of further
analysis, this study demonstrates the impor-
tance of working with complementary evalua-
tion methods-because existing differences in
the nutritional status of different populations
tend to remain hidden if only one measure-
ment technique is applied.
SUMMARY
For the purpose of detecting similarities and dif- scale (24) was adopted as the standard of anthro-
ferences in prevailing patterns of protein-calorie pometric measurement.
malnutrition (PCM), a study was conducted of This procedure revealed notable differences be-
samples of children under 5 years of age in the Bra- tween PCM patterns in the southern industrial
zilian state capitals of Recife, SZo Luis, and SZo metropolis of SHo Paulo and the less developed
Paulo. A total of 2,929 children (1,006 from Szio northeastern cities of Recife and SBo Luis. For one
Luis, 1,169 from Recife, and 754 from S?to Paulo) thing, although 3 1.5 per cent of the S~O Paulo sam-
were included in the study. The G6mez (H), Mar- ple appeared malnourished in terms of weight for
condes (23), Ariza-Macias (l), and modified age (the G6mez classification), only 3.6 per cent ap-
Seoane-Latham (3) classification systems were ap- peared to be suffering from grade II or grade III
Bat&a et al. l PCM IN BRAZIL 239
terns found in Recife and SZo Lufs, where 11.5 per cent and 25.7 per cent, respectively, appeared to show grade II or grade III malnutrition. Evaluation of the samples in terms of height for age (the Mar- condes criteria) yielded similar results. Similar re- sults were also obtained with the moditied Seoane- Latham classification, in terms of relatively greater
percentages of children with “chronic” or “pre-
vious” malnutrition being found in the Recife and Slo Luis samples.
In contrast, the Ariza-Ma&as weight-for-height
classification did not reveal marked differences be-
tween patterns of malnutrition in the three cities.
Though this does not provide a basis for drawing
firm conclusions, the available evidence suggests that this classification system cannot be expected to show marked variations, and that it is not a con- venient type of classification to use for purposes of epidemiologic evaluation of nutritional status.
The study also showed marked differences be- tween the PCM patterns in Recife and S?io Luis, with the situation appearing considerably worse in Sio Luis. Overall, it appears likely that the relative- ly favorable PCM picture in SZo Paulo and the relatively unfavorable one in Slo Luis provide points of reference marking extremes between which the PCM patterns prevailing in nearly all Brazilian cities can be found.
(1) Ariza Macfas, J. MCtodo para la evaluation de1 crecimiento de hombres y mujeres desde el na- cimiento hasta 10s 20 aiios, para uso a nivel na- cional e intemacional. Arc/z Latinoam N&r (Caracas) 22(4):531-546, 1972.
(2) Amhold, R. The arm circumference as a
public health index of protein-calorie malnutrition in early childhood: 27. The QUAC Stick: A field
measure used by the Quaker service team in Ni-
geria. J Trop Pediatr 15(4):243-247, 1969.
(3) Bat&a Filho, M. Preval&ncia e estagios da
desnutri@io pro&co-calbrica em criarqas da cidade
de SHo Paulo. Thesis. School of Public Health, SPo Paulo University, SIo Paulo, 1975, 125 pp.
(4) Beghin, I. The arm circumference as a public health index of protein-calorie malnutrition of early childhood: 18. Assessment of effectiveness of a nu- trition rehabilitation centre at Fond-Parisien, Hai- ti. J Trap Pediatr 15(4):248-250, 1969.
(5) Beghin, I. Desnutricio prottico-calorica:
Considera@es sobre sua epidemiologia. Rev&a Bra-
sileira de Medicina (Rio de Janeiro) 29(6):278-283, 1973.
(6) Beghin, I. Improvement of the nutritional status of infants and children: Considerations of
Northeast Brazil programs. In Proceedings, Western
Hemisphere Nutrition Congress III (Miami Beach, 1971). Futura, New York, 1972, pp. 93-98.
(7) BChar, M. La desnutricion coma problema de
medicina social. Archives de1 Cole&o Medico de El Sal-
vador 25(2):96-103, 1972.
(8) Bennett, F. J. The arm circumference as a public health index of protein-calorie malnutrition of early childhood: 15. A rapid screening test in
emergency child feeding in Kivu, Congo. J Trop
Pediatr 15(4):238-240, 1969.
(9) Berg, A. The Nutrition Factor: Its Role in Na-
tional Development. The Brookings Institute, Wash- ington, D.C., 1973, 290 pp.
(10) Blankhart, D. M. The arm circumference as
a public health index of protein-calorie malnu-
trition of early childhood: 8. Experience in Sierra
Leone and Zambia. J Trap Pediatr 15(4):205-208,
1969.
(11) Coelho, H. A. L. Estado nutritional e con- di@es socio-econ8micas. Thesis. Universidade Fe- deral de Pernambuco, Instituto de NutricIo, 1975, 51 PP.
(12) Cook, R. The arm circumference as a public health index of protein-calorie malnutrition of early childhood: 6. The arm circumference in a field sur-
vey in Ankole, Uganda. J Trap Pediatr 15(4):198-
200, 1969.
(13) Davis, L. E. Epidemiology of famine in the Nigerian crisis: rapid evaluation of malnutrition by height and arm circumference in large populations.
Am J Clin Nutr 24(3):358-364, 1971.
(14) El Lozy, M. The arm circumference as a public health index of protein-calorie malnutrition of early childhood: 3. A modification of Wolanski’s
standards for the arm circumference. J Trap Pediatr
15(4): 193-194, 1969.
(15) Gomez, F. Desnutricion. Bol Med Hasp Infant
Mex 3(4):543-551, 1946.
(16) Gurney, J. M. The arm circumference as a public health index of protein-calorie malnutrition of early childhood: 16. Rapid assessment in a ref-
ugee camp in Nigeria. J Trop Pediatr 15(4):241-242,
1969.
(17) Jelliffe, D. B. The Assessment of the Nutritional Status of the Communiv. WHO Monograph Series,
No. 53. World Health Organization, Geneva,
1968, 291 pp.
tion programs for pre-school children. Am J Clin
Nutr 25(6):595-605, 1972.
(19) Kanawati, A. A., N. Haddad, and D. S.
McLaren. The arm circumference as a public
health index of protein-calorie malnutrition of early
childhood: 14. Preliminary results with mid-arm
and muscle mid-arm circumferences used as nu- tritional screening procedures for pre-school chil-
dren in Lebanon. J Trap Pediatr 15(4):233-237,
1969.
(20) Kanawati, A. A., and D. S. McLaren. As-
sessment of marginal malnutrition. Nature 228:573-
575, 1970.
(21) Lucena, M. A. F. Estudo antropom&trico de criancas de la 60 meses em duas cidades do Nor- deste brasileiro: Recife (PE) e SZo Luis (MA).
Thesis. Universidade Federal de Pernambuco,
Instituto de Nutriclao, Recife, 1975.
(22) Luna-Jaspe, G., H.; J. Ariza-Macias; R.
Rueda-Williamson; J. 0. Mora Parra; and F. Par- do-TCllez. Estudio sectional de crecimiento, desa- rrollo y nutrition en 12.138 niiios de Bogota, Co- lombia: II. El crecimiento de niiios de dos clases socioeconbmicas durante sus primeros seis anos de
vida. Arch Latinoam Nutr 20(2):151-165, 1970.
(23) Marcondes, E. Nanismo por detici&ncia
nutritional. Jomal de Pediatria (Rio de Janeiro) 39
(3-4):58-64, 1974.
(24) Marques, R. M., E. Berquo, J. Yunes, and E. Marcondes. Crescimento de criancas brasileiras: Peso e altura Segundo idade e sexo; influ&ncia de
fatores socio-econ6micos. Anais Nestle (Slao Paulo)
84(Suppl. 2):22, 1974.
(25) McKay, D. A. The arm circumference as a public health index of protein-calorie malnutrition of early childhood: 10. Experience with the mid- arm circumference as a nutritional indicator in field
surveys in Malaysia. J Tro,b Pediatr 15(4):213-216,
1969.
(26) Monckberg, F. Factors conditioning mal- nutrition in Latin America, with Special Reference
to Chile: Advice for a Volunteer Action. In P.
Gyorgi and 0. L. Kline. Malnutrition Is a Problem of
Ecology. Karger Basel, New York, 1970.
(27) Monteiro, C. A. Epidemiologia da desnu- tri5Z-o prot&co-calbrica em nucleos rurais do vale do Ribeira. Thesis. School of Public Health, SZo Paulo University, Sio Paulo, 1977, 84 pp.
(28) Monteiro, C. A., and M. F. Rta. A classi-
tica+ antropomCtrica coma instrument0 de inves-
tiga@o epidemiblogica da desnutri@o proteico-
calorica. Rev Saline Ptiblica (Slo Paulo) 11(3):353-
361, 1977.
(29) Nelson, W. E., V. C. Waugham III, and R. J. McKay.Textbook of Pediatrics. W. B. Saunders,
Philadelphia, 1969, pp.42-43.
(30) Organization de las Naciones Unidas para
la Agricultura y la Alimentacidn, Grupo Asesor de
Proteinas. Vidas en peligro: Las proteinas y los niiios.
Rome, 1970, 132 pp.
(31) Puffer, R. R., and C. V. Serrano. Patterns of
Mortality in Childhood: Report of the Inter-Awican In- vestigation of Mortali in Childhood. PAHO Scientific Publication 262, Pan American Health Organiza- tion, Washington, D.C., 1973, 490 pp.
(32) Rosenberg, 0. Observa$es sobre dados re- lativos ao estado de nutricZo de criancas entre 0 e 4 anos de idade, no municfpio de SIo Paulo. Thesis. School of Public Health, SSro Paul0 University, SIo Paulo, 1970.
(33) Waterlow, J. C. Note on the assessment and
classification of protein-energy malnutrition in
children. Lancet 2(7819):87-89, 1973.
(34) Waterlow, J. C., and G. A. 0. Alleyne. Ma’
nutri>Zo prot&o-calorica em crianps: evoltqdo dos conhe- cimentos nos liltimos 10 anos. Nestle, SBo Paulo, 1974,
120 pp.
(35) World Health Organization. Joint FAO/
WHO Expert Committee on Nutrition: Eighth Report.