ABSTRACT
http://dx.doi.org/10.1590/1678-7757201302380
Post-curing conversion kinetics as functions of
the irradiation time and increment thickness
Nicola SCOTTI1 2, Francesco Andrea Coero BORGA3, Damiano PASQUALINI4, Davide Salvatore PAOLINO5, Francesco GEOBALDO6, Elio BERUTTI7
1- DDS, Assistant Professor, Department of Surgical Sciences, Dental School Lingotto, University of Turin, Turin, Italy. 2- PhD, Department of Material Science and Chemical Engineering, Politecnico di Torino, Turin, Italy.
3- DDS, Department of Surgical Sciences, Dental School Lingotto, University of Turin, Turin, Italy.
4- DDS, Assistant Professor, Department of Surgical Sciences, Dental School of Lingotto, University of Turin, Turin, Italy. 5- PhD, Assistant Professor, Department of Mechanics, Politecnico di Torino, Turin, Italy.
6- PhD, Associate Professor, Department of Material Science and Chemical Engineering, Politecnico di Torino, Turin, Italy. 7- MD, DDS, Dean and Professor, Department of Surgical Sciences, Dental School Lingotto, University of Turin, Turin, Italy.
Corresponding address: Dr. Nicola Scotti - Via Nizza, 230 - 10125 - Torino - Italy - Phone: +39(0)11/6331568 - Fax: +39(0)11/6690602 - e-mail: nicola. [email protected]
! "#"$%%& '$(%
O
bjective: This study evaluated the variation of conversion degree (DC) in the 12 hours following initial photoactivation of a low-shrinkage composite resin (Venus Diamond). Material and Methods: The conversion degree was monitored for 12 hours using Attenuated ! cured for 10 or 20 seconds with a LED lamp. ATR spectra were acquired from the bottom "# # # $%&'*+'" %&',"# $%& / 34! during the post-curing period. Interactions between thickness (T), irradiation time (I) and "!% 34 " "!678 ! "9 ; !;* < # % " * ##%&'%&',! " # #%&',%& "! #" !! DC values with the low-shrinkage composite resin tested in this study. Moreover, both = !" 344"9 Increased irradiation time may be useful in obtaining a high conversion degree (DC) with a low-shrinkage nano-hybrid composite resin, particularly with 2 mm composite layers.Key words: Post-curing. Thickness. Irradiation time. LED. Low-shrinkage composite.
INTRODUCTION
Light-cured composite resins are widely used in restorative dentistry due to their aesthetic advantage, ease of handling and their capability to bond with dental structures15. These materials
contain a blend of hard inorganic particles of different properties, bound together by an organic resin matrix. The composite resins are cured with a free radical polymerization mechanism. The photochemical initiation is obtained by a light source of appropriate wavelength. The polymerization of composite resins occurs through the formation of a polymer network that is always correlated to a volumetric contraction between 1.5% and
5%13,17. The immediate consequence of composite
shrinkage is a competition between the contraction forces and the strength of the bond to the dental structures. This generates a stress along the cavity walls during the polymerization process6. Several
studies that have investigated composite shrinkage conclude that an important shrinkage occurs during visible light curing of the resin matrix due to radical polymerization5. Shrinkage was also shown to
occur during the 24 hours after photoactivation32:
this latter phenomenon is usually called “post-polymerization”21. The temperature at which the
the oral temperature (36.2°C). Therefore, following $; # ! * the free radicals and molecules containing double bonds that have not reacted remain entrapped in <" /H $ * has been observed that, owing to photoactivation, once the composite material has reached its vitreous form, some “free spaces” remain. After the exothermic reaction of the polymerization, the composite resin reduces in temperature to that of the oral cavity. A relaxation process follows which is necessary for the structure to reach a more stable crystalline form and this is associated with a partial reduction of the “free spaces” present within the polymer network. This physical phenomenon is responsible for the spontaneous approach of free radicals to the residual double bonds. These may react, allowing the composite material to further increase the conversion degree (DC)33. A previous
"" /"#; J"* 32 (2006)
concluded that, during the 24 hours following polymerization, the DC of composites resins do not !; < K 7 studies have shown that a continuous increase of contraction stress occurs for different periods of time after the photoactivation process20,27. The increase
of stress following light exposure is associated with an additional polymerization and with the occurrence of thermal shrinkage in the restorative composite2,14,15,27. These contraction stresses, which
occur in the composite resin during polymerization, could generate many clinical problems, such as: cohesive fractures resulting in microcracks, debonding at the filler particle/resin interface, adhesive fractures that may lead to marginal gap formation, marginal discoloration, post-operative sensitivity, and secondary caries8. The clinical
consequences of polymerization shrinkage represent the main reason for the premature replacement of composite resin restorations11. Several clinical
solutions have been proposed to compensate for volumetric composite contraction and contraction
stress, such as different layer-by-layer filling techniques34 or incremental curing protocols1.
In recent years the most innovative attempt at compensating polymerization shrinkage has been the introduction of composite resins with a reduced volumetric contraction. Within low-shrinkage composite resins, a previous study suggested that the Venus Diamond has a strongly reduced contraction stress value24. However, no study has
been conducted on the conversion degree kinetics of low-shrinkage composite resins. For this reason, the analysis of the photoactivation kinetics of the Venus Diamond must be studied.
The aim of this in vitro study was to evaluate
the variation of DC in the 12 hours following photoactivation of a low-shrinkage composite resin. " ;# 34 "! "! !; affected by both the composite thickness and the irradiation time.
MATERIAL AND METHODS
Specimen preparation
A commercially available nano-hybrid composite resin (Venus Diamond, Heraeus Kultzer, Hanau, Germany), shade A2, was selected for this study (Table 1). Aluminium rings, all of 10 mm diameter, with different thickness (1 mm or 2 mm), were placed, one at a time, inside the Attenuated Total [\<,,*J"= 7 S.p.A.) so that the position of the ATR diamond crystal always corresponded with the centre of the aluminium ring. A total of 32 samples were prepared for in vitro study, 16 for each thickness (group
A: 1 mm thickness; group B: 2 mm thickness). The composite resin was bulk-placed inside the "" ! ! ! obtain a uniform thickness. It was covered with a _;# " " "# polymerization. The lamp tip was placed in contact with the triacetate and the photoactivation was
GROUP SUBGROUP Irradiation Time
Sample Thickness
P=0 P=0.5 P=12 "DC increase (P0-P0.5)"
"DC increase (P0.5-P12)"
A
10 sec 1 mm 31.773%
(±1.732)
44.586% (±1.200)
52.377% (±1.906)
40.33% 17.47%
20 sec 1 mm 40.518%
(±1.378)
47.808% (±1.220)
54.172% (±1.933)
17.99% 13.31%
B
10 sec 2 mm 24.036%
(±4.493)
36.196% (±5.802)
43.158% (±7.122)
50.59% 19.23%
20 sec 2 mm 38.592%
(±2 .642)
45.281% (±1.981)
52.595% (±2.137)
17.33% 16.15%
Table 1-!"#!$
performed.
Curing protocol
The curing device employed in this study was a light emitting diode (LED) light (Translux Power Blue, Heareus Kultzer, Hanau, Germany). Prior to the study, the output of the curing unit was $ ; * /` same level of irradiance was used for all specimens (as measured at the surface of the specimen, 1000 mW/cm2). Sixteen samples, eight for each
thickness, were cured for 10 seconds (subgroups 1), while the remaining 16 were cured for 20 seconds (subgroups 2). All experiments were performed at room temperature (22±1°C).
Experimental data collection
Methacrylate monomer conversion in the resin was accomplished before polymerization / " " # Infrared (ATR F-TIR)(Eqinox 55, Bruker Optics S.p.A.), equipped with a MCT detector and ATR sample compartment containing a diamond crystal, under the following conditions: range 4000-600 cm -1, resolution 2 cm-1, 32 scans at 25°C±1°C. Each
sample was submitted to the curing protocol and the DC at the bottom surface of the sample was measured.
The infrared (IR) spectra presented a peak at 1716 cm-1 (carbon oxygen double bond stretching), a
peak at 1636 cm-1 (carbon double bond), and a peak
at 1532 cm-1 (aromatic double bond). The intensity
of each peak was calculated after an appropriate baseline correction and the polymerization rate was calculated using the follow equation:
% K& {|+|},+}{|+|}{,+ x 100
PR, polymerization rate; I, intensity of the peak
in the cured resin; I°, intensity of the peak in the non-cured resin.
ATR spectra were acquired immediately after $ %&'* +' " # ~ %&', " # $ %& / 34 progression during the post-curing period (Figure 1). The sample was not removed from the ATR machine to ensure better reproducibility of the test.
Statistical analysis
In order to evaluate the interactions of thickness (T), irradiation time (I) and post-curing (P), and " 34# resin, an analysis of variance (ANOVA) was performed. Statistical analyses were carried out using SW Minitab v.15 (Minitab Inc., State College, PA, USA) and a p value of <0.05 was considered !;
RESULTS
The mean DC (±standard deviation [SD]) / ## !" # %&'* %&', %&* ! # 34 is summarized in Table 2. Percentage increase < 34 $" / %&'* %&',%&
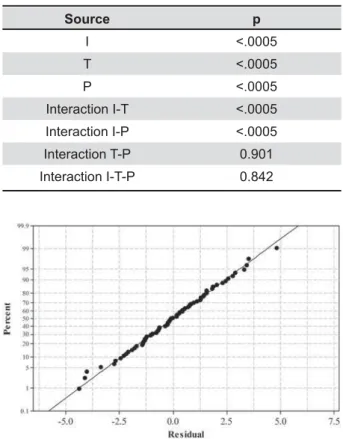
Source p
I <.0005
T <.0005
P <.0005
Interaction I-T <.0005
Interaction I-P <.0005
Interaction T-P 0.901
Interaction I-T-P 0.842
Table 2- &$' *$$ p) of the interactions of thickness (T), irradiation time (I) and post-curing (P) tested in the investigation
Figure 1- Conversion degree (DC) progression during the 12-hour post-curing period acquired through F-TIR
The residuals followed a normal distribution (Figure 2). With the exception of the T-P interaction, ; !; !" + " # 678 test showed that I (p<.0005), T (p<.0005) and P ''',!;" 34 ~ " # % # alone, two further ANOVA tests were conducted. When the P level corresponding to 12 hours was * %#!;" ##%&'%&','''', 678 * % $ !%&' eliminated and the P factor was again shown to !;" ##%&',%& (p<0.0005). Together, these results demonstrate *"! ##%&'%&',*# %&',%&* !; change in DC value. The DC values obtained in J* ##%&' %&',! " ## %&',%& $!!$" #34/ 1, Figure 3).
DISCUSSION
Since only the irradiation time showed a !; "!/ $ of the DC, the results of this in vitro study lends
partial support to the null hypothesis.
No previous studies described a correlation between curing time, composite thickness and conversion degree evolution overtime.
This in vitro study was designed to test a
low-shrinkage nano-hybrid composite resin, thus the Venus Diamond was selected for this study. This
product is constituted of a resin based on TCD-DI-HEA [bis-(acryloyloxymethyl)tricycle (5.2.1.0.sup.2,6) decane] and UDMA (urethanedimethacrylate). This composite already showed excellent shrinkage stress behavior. In factit has been recently demonstrated by Marchesi, et al.24 (2010) that Venus Diamond
showed a lower contraction stress when compared with both silorane-based and dymethacrilate-based restorative materials24. However, no studies on the
DC behavior during the post-polymerization period of this composite resin have ever been conducted.
The degree of conversion of the composite resin was assessed through FTIR analysis, a reliable and sensitive method of evaluation7,26,29,32.
The determination of the degree of conversion was carried out on the non-irradiated surface of specimens in order to consider the sample thickness. The evaluation of the conversion degree at the bottom surface of composite samples is clinically relevant because it simulates what happens at the bottom of adhesive restorations, as pointed out by D’Alpino, et al.9 (2007). The
degree of conversion was measured immediately # ! %&' # +' " %&', " %& the clinical practice where the dentist may require / "#; " an immediate masticatory loading, and because the mechanical properties of the composite resin " / 34/ "! photoactivation16,23. After the initial curing, samples
were left in the ATR machine for the following 12 hours in order to evaluate the DC progression, which represent an innovative way to study DC kinetics. It has been documented that the DC progression
Figure 3-;$'=*$=>?!$G;H$
increases during the post-curing phase28,32. The DC
/ # %&'* +' " # %&',"# %& "
The results of this in vitro study indicated that
both the irradiation time and the composite thickness !; 34" in group A and in group B. If evaluated immediately # $ %&'* # irradiation time from 10 to 20 seconds produced !; # 34H $ * 34 / !;! than for 2 mm samples. These results concur with those obtained from previous studies11,12,20-22. The
greatest amount of energy density supplied by the LED lamp to the composite resin during 20 seconds of irradiation immediately resulted in a faster release of free radicals and, consequently, a greater opening of the double bonds within the methacrylic groups and a higher DC of the material. Previous studies argued that the degree of conversion and, # * ~ * " by the amount of energy emitted to the composite, which is derived from both the irradiation time and the power of the curing device10. However,
it is well known that the high power associated with short irradiation times reduce the DC of the composite resins due to limitations in the mobility of reactive groups imposed by the rapid formation of a polymeric chain30. Consequently, an increase in
$ " 34 the bottom surface of the samples. Gritsch, et al.18
(2008) demonstrated that an increased irradiation time associated with low power improved the depth of cure due to a delay in the formation of rigid grid links between the polymer chains18.
This study indicates that a reduced irradiation time is associated with an increased composite thickness. This was shown by group B1 where the 34/ $ %&'*%& result supports previous studies which demonstrate 34# " / the interaction between composite thickness and irradiation time3,4,10,21,25,31. The increase of composite
thickness required longer irradiation times in order to obtain a comparable DC. This phenomenon can be explained by the effect of light energy incident on the surface of a material, during the attempt to */ #; # " to the physical characteristics of the material itself (Lambert Law).
" $" ; # DC during the post-curing period. The statistical analysis showed that only the interaction between the irradiation time (I) and post-curing (P) was !!;/ / this study showed that in both group A1 and group J 34 ! / %&'
%&*"! 34 ! !" %&%&* 34#!"* which were always measured on the non-irradiated surface of the samples, did not show any statistically significant difference. Furthermore, the most !;34 ! / %&' %&','++K*" / %&',%&K3 / # research evaluating the DC progression during the post-curing period on the non-irradiated surface of a low-shrinkage composite resin, the results achieved in this in vitro study can be explained by
the ability of the tested composite to receive and capture energy during irradiation and to release it slowly during the next 12 hours. Therefore, it can be assumed that the energy released to the ;' # ~ was enough to open a greater quantity of double bonds within the methacrylic groups during the 12-hour post-curing period, and hence determined a / ;34/ !"34.
This was despite a reduced activation of free radicals * \" * " 34%&'!" B, the DC behaved in a similar manner to groups A during the post-curing period. The statistical analysis showed a non-significant interaction between thickness (T) and post-curing (P). The 34 ! < / %&' %&', !" J ,',K !" J (+17.33%), as illustrated in the 1 mm samples. $ * ## 34 ! %&'* remained almost unchanged following 12 hours of post-polymerization. It has been shown that the DC of the composite resin depends on the energy density released to the material. Hence, in order to achieve the same degree of conversion in 2 mm samples, an increased energy density is necessary19.
A recent study24 underlined that, according to the
contraction stress curves, the Venus Diamond cures very slowly. This would contribute to its reduced * !; !|K$" The TCD monomer contained in the Venus Diamond may cure slowly due to the presence of large rings accounting for steric hindrance during curing. For this reason, post-curing analysis of other composite resins is necessary.
Diamond reached ideal mechanical properties after the 12-hour post-curing period. This provides the rationale for further investigation of the mechanical properties during the post-curing period.
CONCLUSIONS
The results obtained in this in vitro investigation
lend partial support to the null hypothesis since the DC of the tested nano-hybrid composite show an important increase during the post-curing period. Moreover, the DC registered at the non-irradiated "# %&'!; / material thickness and the irradiation time.
REFERENCES
1- Alonso RC, Cunha LG, Correr GM, Cunha Brandt W, Correr-Sobrinho L, Sinhoreti MA. Relationship between bond strength and marginal and internal adaptation of composite restorations photocured by different methods. Acta Odontol Scand 2006;64(5):306-13.
2- Aravamudhan K, Floyd CJ, Rakowski D, Flaim G, Dickens SH, Eichmiller FC, et al. Light-emitting diode curing light irradiance and polymerization of resin-based composite. J Am Dent Assoc. 2006;137:213-23.
3- Bala O, Olmez A, Kalayci S. Effect of LED and halogen light curing on polymerization of resin-based composites. J Oral Rehabil. 2005;32:134-40.
4- Bouschlicher MR, Rueggeberg FA, Wilson BM. Correlation of bottom-to-top surface microhardness and conversion ratios for a variety of composite resin compositions. Oper Dent. 2004;29:698-704.
5- Braga RR, Ballester RY, Ferracane JL. Factors involved in the development of polymerization shrinkage stress in composite resins: a systematic review. Dent Mater. 2005;21:962-70. 6- Choi KK, Condon JR, Ferracane JL. The effects of adhesive thickness on polymerization contraction stress of composite. J Dent Res. 2000;79:812-7.
7- Conti C, Giorgini E, Landi L, Putignano A, Tosi G. Spectroscopic and mechanical properties of dental composite resins cured with different light sources. J Molecular Struct. 2005;744-7:641-6. 8- Correr AB, Sinhoreti MA, Correr-Sobrinho L, Tango RN, Schneider LF, Consani S. Effect of the increase of energy density on Knoop hardness of dental composites light-cured by conventional QTH, LED and xenon plasma arc. Braz Dent J. 2005;16:218-24. 9- D'Alpino PH, Svizero NR, Pereira JC, Rueggeberg FA, 4$ H* % 3 " # !"! " polymerization reaction kinetics of a restorative system. Am J Dent. 2007;20:46-52.
10- Davidson CL, Feilzer AJ. Polymerization shrinkage and polymerization shrinkage stress in polymer-based restoratives. J Dent. 1997;25:435-40.
3 H*"#; J"3*3 $"<* "8" contraction in photocured dental resins: the shrinkage-conversion relationship revisited. Dent Mater. 2006;22:359-65.
12- Fan PL, Schumacher RM, Azzolin K, Geary R, Eichmiller FC. Curing-light intensity and depth of cure of resin-based composites tested according to international standards. J Am Dent Assoc. 2002;133:429-34.
13- Feilzer AJ, De Gee AJ, Davidson CL. Curing contraction of composites and glass-ionomer cements. J Prosthet Dent. 1988;59:297-300.
14- Ferracane JL. Correlation between hardness and degree of $ "! ! #"; $ resins. Dent Mater. 1985;1:11-4.
15- Ferracane JL. Composite resin - state of the art. Dent Mater. 2011;27:29-38.
16- Ferracane JL, Greener EH. The effect of resin formulation on the degree of conversion and mechanical properties of dental restorative resins J Biomed Mater Res. 1986;20:121-31. 17- Gonçalves F, Pfeifer CS, Ferracane JL, Braga RR. Contraction stress determinants in dimetacrylate composites. J Dent Res. 2008;87:367-71.
18- Gritsch K, Souvannasot S, Schembri C, Farge P, Grosgogeat B. " #! ! of two nano-hybrid composites. Eur J Oral Sci. 2008;116:77-82. 19- Halvorson RH, Erickson RL, Davidson CL. An energy conversion $ #$ ; #" # resin-based composite. Oper Dent. 2003;28:307-14.
20- Inoue K, Hayashi I. Residual monomer (Bis-GMA) of composite resins. J Oral Rehabil. 1982;9:493-7.
21- Leung RL, Fan PL, Johnston WM. Post-irradiation polymerization of visible light-activated composite resin. J Dent Res. 1983;62 363-5.
22- Lindberg A, Peutzfeldt A, van Dijken JW. Effect of power density of curing unit, exposure duration, and light guide distance on composite depth of cure. Clin Oral Invest. 2005;9:71-6. + ~" $ * 3= 3 ! # " #" # < ; " wet and dry conditions. Dent Mater. 2008;24:778-85.
24- Marchesi G, Breschi L, Antoniolli F, Di Lenarda R, Ferracane J, Cadenaro M. Contraction stress of low-shrinkage composite materials assessed with different testing systems. Dent Mater. 2010;26:947-53.
25- Mills RW, Uhl A, Jandt KD. Optical power outputs, spectra and dental composite depths of cure, obtained with blue light emitting diode (LED) and halogen light curing units (LCUs). Br Dent J. 2002;193:459-63.
26- Moraes LG, Rocha RS, Menegazzo LM, Araújo EB, Yukimito K, Moraes JC. Infrared spectroscopy: a tool for determination of the degree of conversion in dental composites. J Appl Oral Sci. 2008;16:145-9.
7; *34*6 $ 3*H"* 4 In situ evaluation of polymerization kinetics and corresponding evolution of the mechanical properties of dental composites. Polymer Test. 2003;22:77-81.
28- Pianelli C, Devaux J, Bebelman S, Leloup G. The micro-Raman spectroscopy, a useful tool to determine the degree of conversion of light-activated composite resins. J Biomed Mater Res. 1999;48:675-81.
29- Ribeiro BC, Boaventura JM, Brito-Gonçalves JD, Rastelli 6* J! 8* 3 ! # $ # ; and microhybrid composite resins photo-activated by different generations of LEDs. J Appl Oral Sci. 2012;20:212-7.
30- Scotti N, Venturello A, Migliaretti G, Pera F, Pasqualini D, Geobaldo F, et al. New-generation curing units and short irradiation time: the degree of conversion of microhybrid composite resin. Quint Int. 2011;42:89-95.
31- Tsai PC, Meyers IA, Walsh LJ. Depth of cure and surface microhardness of composite resin cured with blue LED curing lights. Dent Mater. 2004;20:364-9.
+ "#; J" 3* 3 " 4! * 3 $"< * Biebuyck JJ, Mestdagh M, Larbanois P, et al. A physico-chemical explanation of the post-polymerization shrinkage in dental resins. Dent Mater. 2006;22:405-12.
++ "#; J" 3* ~ * 3 " 4! * 3 $"<*H !H*4! J* ;## radicals trapped in solid methacrylated resins. J Polymer Sci. 2003;41:1691-9.