Flexibility Assessment: Normative Values for Flexitest from 5 to 91
Years of Age
Claudio Gil Soares de Araújo
Clínica de Medicina do Exercício (CLINIMEX), Programa de Pós-Graduação em Educação Física da Universidade Gama Filho, Rio de Janeiro, RJ - Brazil
Mailing address: Claudio Gil Soares de Araújo •
Rua Siqueira Campos, 93/101, Copacabana, 22031-070, Rio de Janeiro, RJ - Brazil
E-mail: [email protected]
Manuscript received October 30, 2007; revised manuscript received December 03, 2007; accepted January 08, 2008.
Summary
Background: Physical exercise plays a role in health-promotion policies and its prescription should be scientifically based. Flexibility is one of the major components of health-related and performance-related physical fitness, and is defined as the maximum physiological passive range of motion of a given joint movement. According to its specificity, the assessment of flexibility should, ideally, incorporate multiple movements. Introduced in 1980 and with redesigned evaluation maps published in 1986, Flexitest consists of the assessment of mobility with the use of a scale from 0 to 4. By adding the individual results of the 20 joint movements assessed, it is possible to obtain a global score called Flexindex.
Objective: To present Flexitest updated normative values.
Methods: Data were obtained from 4711 non-athlete subjects (2943 men and 1768 women) with age ranging from 5 to 91 years, and were collected by experienced raters. Approximately 70% of the data were collected by the author of the method himself.
Results: Considering the data heteroscedasticity and non-parametric distribution, we chose to use age and gender-percentile tables. Flexindex decreases with age and the median results for females are higher than for males of the same age since childhood. This trend becomes stronger with physical development and, later, with the aging process.
Conclusion: These normative data contribute to a better knowledge of the flexibility behavior with age and gender and will be useful for professionals who assess flexibility in their professional practice. (Arq Bras Cardiol 2008; 90(4): 257-263)
Key words: Flexibility; joints; motor activity; range of motion articular; exercise.
what has been conventionally called specificity of flexibility13. Additionally, genetic characteristics seem to play an important role, especially in the cases of hyperlaxity14,15.
Unlike other physical fitness-related variables such as maximal aerobic power and muscle strength, very high levels of flexibility do not always seem to be associated with a better physical performance or health condition4. Despite these considerations, exercises targeted at improving flexibility are usually included in any exercise plan, both for athletes and for individuals with a sedentary lifestyle and even for those with several diseases and particularly for individuals older than 65 years of age, according to recent institutional recommendations of the American Heart Association and of the American College of Sports Medicine2,3, and they may result in improved quality of life16. On the other hand, there is a consensus that a well-prescribed and customized exercise plan should be based on data from a judicious, reliable and valid evaluation. This being considered, it seems appropriate, in this setting, to provide methods of flexibility measurement and the respective criteria for evaluation.
By the end of the 1970’s, Pável and Araújo17 started to develop a method for the measurement and evaluation of flexibility-Flexitest-, which is based on the comparative analysis between the mobility actually obtained and that recorded in standardized evaluation maps for 20 joint movements. The
Introduction
maps were later redesigned18 and a series of studies were conducted19-21, culminating in a doctoral thesis22 in which a preliminary database with approximately 500 cases was presented. However, it was only in September 2003, with the publication of a specific book on Flexitest in the United States4 and of its Portuguese23 and Spanish24 versions, both in 2005, that the first normative patterns for the evaluation of the measurements taken with Flexitest considering age and gender, and including slightly more than 3000 cases, were formally presented. Thus, the routine use of Flexitest for flexibility assessment in different situations became even more feasible. However, with the continued use of Flexitest in the past years, the database could be further improved, not only with a larger number of individuals but also with a broader age range considered.
In the past years, we have observed an increasing utilization of Flexitest in Brazil. For instance, the Air Force incorporated part of the method in the physical evaluation of their staff, which culminated in the proposition of specific normative values for this military force (REF). This also reflects in the scientific sphere, because in addition to Exercise Medicine25, other fields of Medicine, such as Nephrology26, Geriatrics27, and Physical Medicine28 have also published original articles in which Flexitest was used for the assessment of flexibility; this also occurs in the field of Physical Education29.
Within this context, the objective of this article is to present an update on the normative data regarding Flexitest, originally published in 2003 for individuals between five and 91 years of age, and which had its assessment process improved with the use of the method.
Methods
Sample
Among all Flexitest data made available to the author, only the measurements taken by raters experienced in the technique, all of them trained directly by the author of the method, were considered to set the normative values. After careful selection, a total of 4711 non-athlete individuals, of whom 2943 were males and 1768 were females, with ages ranging from five to 91 years, were included to comprise the sample used to set up the database. In approximately 70% of the cases, Flexitest was administered by the study author himself. Although a specific ethnical evaluation had not been made, the great majority of individuals were primarily of Caucasian origin. Approximately 85% of the individuals of the sample were evaluated in the Exercise Medicine Clinic – CLINIMEX, Rio de Janeiro, RJ. As recommended in scientific practice, a written informed consent was obtained from all participants or their legal representatives, in the case of underage individuals, before Flexitest was administered.
Flexitest
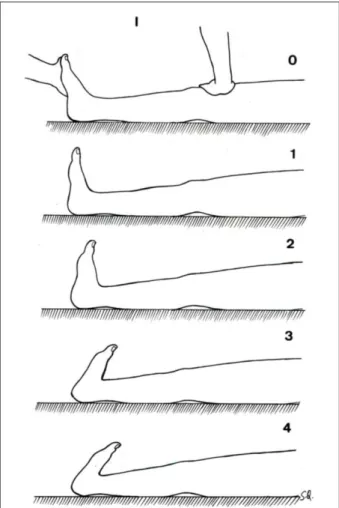
Briefly, the method consists of measuring and evaluating the maximum passive range of motion of 20 body joint movements (36 if considered bilaterally), including the ankles, knees, hips, “trunk”, wrists, elbows and shoulders. Eight movements are performed in the lower limbs, three in the trunk and the remaining nine in the upper limbs. The movements are
numbered in a distal-proximal direction. Each one of the movements is measured in a growing discontinuous scale of whole numbers from zero to four, thus comprising a total of five possible values (see example in Figure 1). The measurement is taken with the movement being slowly performed until the point of maximum range of motion is reached; this measurement is further compared with the evaluation maps. In general, the point of maximum range of motion is easily detected because of the great mechanical resistance against the continuation of the movement and/or because of the local discomfort experienced by the individual being assessed. The usual time spent to take the 20 measurements is of approximately three minutes for a rater experienced in the method. A detailed description, evaluation maps and strategies for rater training are available in another reference23.
Because of the nature of the scale and the way the evaluation maps were purposely designed, a Gaussian data distribution is observed, so that the central trend is two, the one and three values are less frequent, and the extreme values,that is, 0 and 4 are very uncommon. Thus, although the analysis of Flexitest can and should be performed for each movement and/or joint, it is valid to add the results obtained in the 20 individual movements to obtain a global index of flexibility or joint mobility called Flexindex4. Additionally, with
the Gaussian nature of the scale for each movement and of the global scale, it is possible to study the entire mobility spectrum, since the extreme values – 0 and 80 points – have never been obtained in practice. Accordingly, the so-called ceiling and/or floor effects, which significantly impair the clinical utilization of certain simpler tests, did not occur. Several studies on intra and interobserver reliability conducted with pictures of models or with real measurements in individuals showed systematically high intraclass correlation coefficients for Flexitest measurements and, in particular, for Flexindex4,30-32.
Statistical Analysis
The individuals were initially stratified by gender – male and female – and then by age – in a total of 22 different ages or age ranges – for determination of the respective values and percentile curves of Flexindex. For inferential analyses, the t-test for dependent samples and the Pearson product-moment correlation were used. The statistical significance level was set at 5%.
Results
Flexindex values for 23 different percentiles for each one
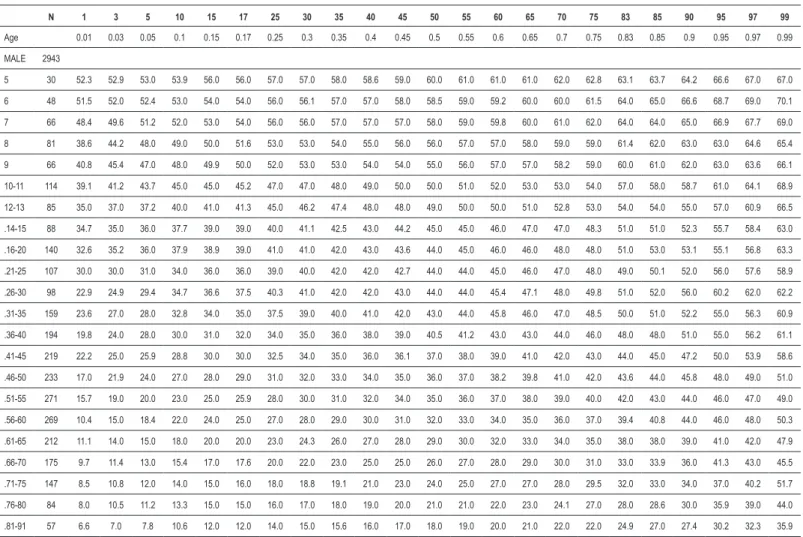
Table 1 - Flexindex percentiles for males – 5 to 91 years of age (n = 2943)
N 1 3 5 10 15 17 25 30 35 40 45 50 55 60 65 70 75 83 85 90 95 97 99
Age 0.01 0.03 0.05 0.1 0.15 0.17 0.25 0.3 0.35 0.4 0.45 0.5 0.55 0.6 0.65 0.7 0.75 0.83 0.85 0.9 0.95 0.97 0.99
MALE 2943
5 30 52.3 52.9 53.0 53.9 56.0 56.0 57.0 57.0 58.0 58.6 59.0 60.0 61.0 61.0 61.0 62.0 62.8 63.1 63.7 64.2 66.6 67.0 67.0
6 48 51.5 52.0 52.4 53.0 54.0 54.0 56.0 56.1 57.0 57.0 58.0 58.5 59.0 59.2 60.0 60.0 61.5 64.0 65.0 66.6 68.7 69.0 70.1
7 66 48.4 49.6 51.2 52.0 53.0 54.0 56.0 56.0 57.0 57.0 57.0 58.0 59.0 59.8 60.0 61.0 62.0 64.0 64.0 65.0 66.9 67.7 69.0
8 81 38.6 44.2 48.0 49.0 50.0 51.6 53.0 53.0 54.0 55.0 56.0 56.0 57.0 57.0 58.0 59.0 59.0 61.4 62.0 63.0 63.0 64.6 65.4
9 66 40.8 45.4 47.0 48.0 49.9 50.0 52.0 53.0 53.0 54.0 54.0 55.0 56.0 57.0 57.0 58.2 59.0 60.0 61.0 62.0 63.0 63.6 66.1
10-11 114 39.1 41.2 43.7 45.0 45.0 45.2 47.0 47.0 48.0 49.0 50.0 50.0 51.0 52.0 53.0 53.0 54.0 57.0 58.0 58.7 61.0 64.1 68.9
12-13 85 35.0 37.0 37.2 40.0 41.0 41.3 45.0 46.2 47.4 48.0 48.0 49.0 50.0 50.0 51.0 52.8 53.0 54.0 54.0 55.0 57.0 60.9 66.5
.14-15 88 34.7 35.0 36.0 37.7 39.0 39.0 40.0 41.1 42.5 43.0 44.2 45.0 45.0 46.0 47.0 47.0 48.3 51.0 51.0 52.3 55.7 58.4 63.0
.16-20 140 32.6 35.2 36.0 37.9 38.9 39.0 41.0 41.0 42.0 43.0 43.6 44.0 45.0 46.0 46.0 48.0 48.0 51.0 53.0 53.1 55.1 56.8 63.3
.21-25 107 30.0 30.0 31.0 34.0 36.0 36.0 39.0 40.0 42.0 42.0 42.7 44.0 44.0 45.0 46.0 47.0 48.0 49.0 50.1 52.0 56.0 57.6 58.9
.26-30 98 22.9 24.9 29.4 34.7 36.6 37.5 40.3 41.0 42.0 42.0 43.0 44.0 44.0 45.4 47.1 48.0 49.8 51.0 52.0 56.0 60.2 62.0 62.2
.31-35 159 23.6 27.0 28.0 32.8 34.0 35.0 37.5 39.0 40.0 41.0 42.0 43.0 44.0 45.8 46.0 47.0 48.5 50.0 51.0 52.2 55.0 56.3 60.9
.36-40 194 19.8 24.0 28.0 30.0 31.0 32.0 34.0 35.0 36.0 38.0 39.0 40.5 41.2 43.0 43.0 44.0 46.0 48.0 48.0 51.0 55.0 56.2 61.1
.41-45 219 22.2 25.0 25.9 28.8 30.0 30.0 32.5 34.0 35.0 36.0 36.1 37.0 38.0 39.0 41.0 42.0 43.0 44.0 45.0 47.2 50.0 53.9 58.6
.46-50 233 17.0 21.9 24.0 27.0 28.0 29.0 31.0 32.0 33.0 34.0 35.0 36.0 37.0 38.2 39.8 41.0 42.0 43.6 44.0 45.8 48.0 49.0 51.0
.51-55 271 15.7 19.0 20.0 23.0 25.0 25.9 28.0 30.0 31.0 32.0 34.0 35.0 36.0 37.0 38.0 39.0 40.0 42.0 43.0 44.0 46.0 47.0 49.0
.56-60 269 10.4 15.0 18.4 22.0 24.0 25.0 27.0 28.0 29.0 30.0 31.0 32.0 33.0 34.0 35.0 36.0 37.0 39.4 40.8 44.0 46.0 48.0 50.3
.61-65 212 11.1 14.0 15.0 18.0 20.0 20.0 23.0 24.3 26.0 27.0 28.0 29.0 30.0 32.0 33.0 34.0 35.0 38.0 38.0 39.0 41.0 42.0 47.9
.66-70 175 9.7 11.4 13.0 15.4 17.0 17.6 20.0 22.0 23.0 25.0 25.0 26.0 27.0 28.0 29.0 30.0 31.0 33.0 33.9 36.0 41.3 43.0 45.5
.71-75 147 8.5 10.8 12.0 14.0 15.0 16.0 18.0 18.8 19.1 21.0 23.0 24.0 25.0 27.0 27.0 28.0 29.5 32.0 33.0 34.0 37.0 40.2 51.7
.76-80 84 8.0 10.5 11.2 13.3 15.0 15.0 16.0 17.0 18.0 19.0 20.0 21.0 21.0 22.0 23.0 24.1 27.0 28.0 28.6 30.0 35.9 39.0 44.0
.81-91 57 6.6 7.0 7.8 10.6 12.0 12.0 14.0 15.0 15.6 16.0 17.0 18.0 19.0 20.0 21.0 22.0 22.0 24.9 27.0 27.4 30.2 32.3 35.9
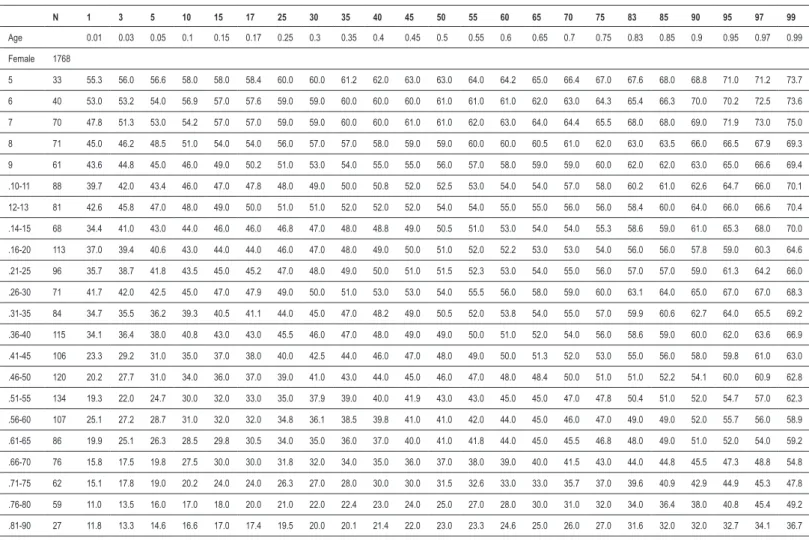
of the 22 age ranges or ages with respective sample sizes are shown in Tables 1 – males, and 2 – females. Median values tend to be systematically higher in women than in men, even at younger ages. For better visualization, a summary of these data is presented in Figures 2 and 3, illustrating the main percentiles for the male and female genders, respectively, thus permitting the identification of a similar and progressive, but not linear, reduction with age.
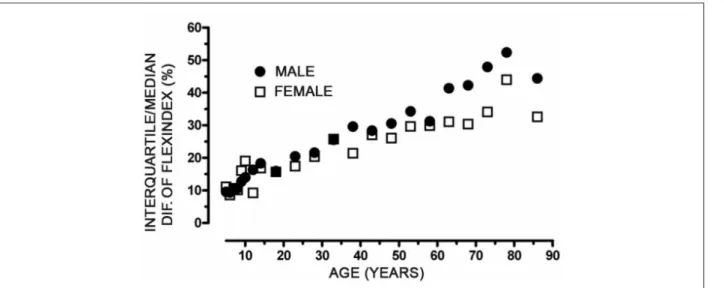
There is a direct relationship between age and the interquartile differences, ranging from 5 to 13 points in the male and female samples for Flexindex, going from a plateau at approximately 10% of the median value in childhood to approximately 40 to 50% in the higher age ranges. The correlation coefficients were 0.69 and 0.59 (p < 0.001) for the male and female genders, respectively (Figure 4).
Table 2 - Flexindex percentiles for females – 5 to 91 years of age (n = 1768)
N 1 3 5 10 15 17 25 30 35 40 45 50 55 60 65 70 75 83 85 90 95 97 99
Age 0.01 0.03 0.05 0.1 0.15 0.17 0.25 0.3 0.35 0.4 0.45 0.5 0.55 0.6 0.65 0.7 0.75 0.83 0.85 0.9 0.95 0.97 0.99
Female 1768
5 33 55.3 56.0 56.6 58.0 58.0 58.4 60.0 60.0 61.2 62.0 63.0 63.0 64.0 64.2 65.0 66.4 67.0 67.6 68.0 68.8 71.0 71.2 73.7
6 40 53.0 53.2 54.0 56.9 57.0 57.6 59.0 59.0 60.0 60.0 60.0 61.0 61.0 61.0 62.0 63.0 64.3 65.4 66.3 70.0 70.2 72.5 73.6
7 70 47.8 51.3 53.0 54.2 57.0 57.0 59.0 59.0 60.0 60.0 61.0 61.0 62.0 63.0 64.0 64.4 65.5 68.0 68.0 69.0 71.9 73.0 75.0
8 71 45.0 46.2 48.5 51.0 54.0 54.0 56.0 57.0 57.0 58.0 59.0 59.0 60.0 60.0 60.5 61.0 62.0 63.0 63.5 66.0 66.5 67.9 69.3
9 61 43.6 44.8 45.0 46.0 49.0 50.2 51.0 53.0 54.0 55.0 55.0 56.0 57.0 58.0 59.0 59.0 60.0 62.0 62.0 63.0 65.0 66.6 69.4
.10-11 88 39.7 42.0 43.4 46.0 47.0 47.8 48.0 49.0 50.0 50.8 52.0 52.5 53.0 54.0 54.0 57.0 58.0 60.2 61.0 62.6 64.7 66.0 70.1
12-13 81 42.6 45.8 47.0 48.0 49.0 50.0 51.0 51.0 52.0 52.0 52.0 54.0 54.0 55.0 55.0 56.0 56.0 58.4 60.0 64.0 66.0 66.6 70.4
.14-15 68 34.4 41.0 43.0 44.0 46.0 46.0 46.8 47.0 48.0 48.8 49.0 50.5 51.0 53.0 54.0 54.0 55.3 58.6 59.0 61.0 65.3 68.0 70.0
.16-20 113 37.0 39.4 40.6 43.0 44.0 44.0 46.0 47.0 48.0 49.0 50.0 51.0 52.0 52.2 53.0 53.0 54.0 56.0 56.0 57.8 59.0 60.3 64.6
.21-25 96 35.7 38.7 41.8 43.5 45.0 45.2 47.0 48.0 49.0 50.0 51.0 51.5 52.3 53.0 54.0 55.0 56.0 57.0 57.0 59.0 61.3 64.2 66.0
.26-30 71 41.7 42.0 42.5 45.0 47.0 47.9 49.0 50.0 51.0 53.0 53.0 54.0 55.5 56.0 58.0 59.0 60.0 63.1 64.0 65.0 67.0 67.0 68.3
.31-35 84 34.7 35.5 36.2 39.3 40.5 41.1 44.0 45.0 47.0 48.2 49.0 50.5 52.0 53.8 54.0 55.0 57.0 59.9 60.6 62.7 64.0 65.5 69.2
.36-40 115 34.1 36.4 38.0 40.8 43.0 43.0 45.5 46.0 47.0 48.0 49.0 49.0 50.0 51.0 52.0 54.0 56.0 58.6 59.0 60.0 62.0 63.6 66.9
.41-45 106 23.3 29.2 31.0 35.0 37.0 38.0 40.0 42.5 44.0 46.0 47.0 48.0 49.0 50.0 51.3 52.0 53.0 55.0 56.0 58.0 59.8 61.0 63.0
.46-50 120 20.2 27.7 31.0 34.0 36.0 37.0 39.0 41.0 43.0 44.0 45.0 46.0 47.0 48.0 48.4 50.0 51.0 51.0 52.2 54.1 60.0 60.9 62.8
.51-55 134 19.3 22.0 24.7 30.0 32.0 33.0 35.0 37.9 39.0 40.0 41.9 43.0 43.0 45.0 45.0 47.0 47.8 50.4 51.0 52.0 54.7 57.0 62.3
.56-60 107 25.1 27.2 28.7 31.0 32.0 32.0 34.8 36.1 38.5 39.8 41.0 41.0 42.0 44.0 45.0 46.0 47.0 49.0 49.0 52.0 55.7 56.0 58.9
.61-65 86 19.9 25.1 26.3 28.5 29.8 30.5 34.0 35.0 36.0 37.0 40.0 41.0 41.8 44.0 45.0 45.5 46.8 48.0 49.0 51.0 52.0 54.0 59.2
.66-70 76 15.8 17.5 19.8 27.5 30.0 30.0 31.8 32.0 34.0 35.0 36.0 37.0 38.0 39.0 40.0 41.5 43.0 44.0 44.8 45.5 47.3 48.8 54.8
.71-75 62 15.1 17.8 19.0 20.2 24.0 24.0 26.3 27.0 28.0 30.0 30.0 31.5 32.6 33.0 33.0 35.7 37.0 39.6 40.9 42.9 44.9 45.3 47.8
.76-80 59 11.0 13.5 16.0 17.0 18.0 20.0 21.0 22.0 22.4 23.0 24.0 25.0 27.0 28.0 30.0 31.0 32.0 34.0 36.4 38.0 40.8 45.4 49.2
.81-90 27 11.8 13.3 14.6 16.6 17.0 17.4 19.5 20.0 20.1 21.4 22.0 23.0 23.3 24.6 25.0 26.0 27.0 31.6 32.0 32.0 32.7 34.1 36.7
Figure 3 -Percentile curves for Flexindex in 1768 female individuals between 5 and 91 years of age.
Figure 4 -Relationship between the interquartile/median differences of the Flexindex results and age for men and women.
to only 4 to 10 points in the absolute result of the sum of mobility scores measured for each of the 20 movements.
Discussion
Created and developed more than 25 years ago, Flexitest has been largely used in Brazil for the assessment of flexibility. Initially, by means of several university extensions and of the inclusion of the topic in several lists of disciplines of graduation and post graduation in Physical Education throughout the country, Flexitest became more widely known and used. Later, with the publication of several scientific studies and several postgraduate dissertation and theses defenses using Flexitest, the method became increasingly more widely known. Nonetheless, it was mainly with the publication of the Flexitest
book by Human Kinetics and with its subsequent Portuguese and Spanish versions that the number of professionals knowing and using the method in several countries worldwide significantly increased. The original book is available in more than 160 university libraries of English-speaking countries, and both the English and Spanish versions are available in the National Library of Medicine in Bethesda.
Box 1 - Comparison between the Main Flexibility Assessment Methods
Item Criterion Flexitest Leighton Goniometry Beighton-Hóran Sit-and-Reach
1 Mode of performance Passive Active Active Active Active
2 No. of movements 20 Up to 30 > 30 9 1
3 No. of joints per test item Single Single Single Single Multiple
4 No. of movements per test items Single Compound CompoundSingle/ Single Compound
5 Total no. of joint movements Large Large Large Large Small
6 Possibility of global score Yes No No Yes No
7 Measurement unit Points Degrees Degrees Points Centimeters
8 Equipment required None Flexometer Goniometer None Bench
9 Reliability High High High Intermediate High
10 Clinical and sports applicability Very high Very high Very high Low Intermediate
11 Ease to perform Great Intermediate Little Great Great
12 Characteristics of results distribution Parametric Parametric Parametric Non-parametric Parametric
score – Flexindex, c) the analysis of variability components, d) absence of a ceiling and floor effect (in practice, no minimum and maximum limits were ever found), and e) availability of a large normative database (Tables 1 and 2).
In order to prepare these normative data, we purposely chose to exclude all individuals engaged in regular competitive sports activity regardless of modality, since athletes tend to present distinct flexibility levels as compared to those of the general population. Normative values can be expressed in different manners. In the setting of laboratory tests, the tendency is to present a range of reference values considered statistically normal, probably obtained from the determination of mean values plus or minus two standard deviations in an enough large sample of healthy individuals. Depending on the nature of the variable, genders are occasionally discriminated and, less frequently, age groups, such as children, premenopausal and postmenopausal women. However, this strategy has several limitations. First, it assumes that the variables have a Gaussian distribution (which hardly ever occurs with the majority of the variables, such as hematocrit, blood glucose, etc); and, second, it does not allow a reliable detection of the impact of subtle changes that may occur within a given normal range.
Another quite common form of representing the relationship of a determined variable with age is to express it in simple (linear, exponential, polynomial, etc), multiple (ideally stepwise), or logistic regression models. Almost all these models assume that data distribution presents homoscedasticity and generates some estimate error value at the end. By analyzing the association between the 22 interquartile (P75-P25) variability measurements and respective ages (mean values for the age ranges), we obtained significant correlation coefficients for both genders, which clearly indicates that flexibility variability increases with age despite the absolute Flexindex reduction, thus going against the basic premise for the use of regression models. Actually, when there is reason to suspect heteroscedasticity or a non-parametric data distribution and, on the other hand, when the sample size is large enough, the most suitable analysis alternative is likely the definition of percentile curves to establish normative values. This usually
occurs with growth and development charts for height and body weight. Taking these issues into consideration, this was precisely the choice we made to analyze Flexindex.
Data regarding normative values of Flexindex presented in this article significantly contribute to a more detailed interpretation of results obtained in the flexibility assessment performed with Flexitest. In comparison with the data made available in 2003, data from the present study represent an increase by approximately 50% in the sample size, with wider and more subdivided age ranges. Additionally, the great majority of the sample distortions could be corrected, thus enabling all age ranges of both genders to include at least 30 cases, except for the female 81+ group (with 27 cases). Determination of the different percentiles was thus made easier.
An interesting aspect is that there is a greater tendency of variation of Flexindex values over the years, so that the interquartile differences tend to increase both in males and females. Like for other variables of the human performance, this is probably due to the progressively greater differences in relation to the regular physical activity pattern of individuals when they reach adulthood and in subsequent years. Further longitudinal studies should contribute to explain whether the loss of flexibility over the years bears any relation to the degree of global flexibility observed in childhood.
References
1. Araújo CG, Carvalho T, Castro CL, Costa RV, Moraes RS, Oliveira Filho JA, et al. Normatização dos equipamentos e técnicas da reabilitação cardiovascular supervisionada. Arq Bras Cardiol. 2004; 83 (5): 448-52.
2. Haskell WL, Lee IM, Pate RR, Powell KE, Blair SN, Franklin BA, et al. Physical Activity and Public Health. Updated Recommendation for Adults From the American College of Sports Medicine and the American Heart Association. Circulation. 2007; 116 (9): 1081-93.
3. Nelson ME, Rejeski WJ, Blair SN, Duncan PW, Judge JO, King AC, et al. Physical Activity and Public Health in Older Adults. Recommendation From the American College of Sports Medicine and the American Heart Association. Circulation. 2007; 116 (9): 1094-105.
4. Araújo CGS. Flexitest: an innovative flexibility assessment method. Champaign: Human Kinetics; 2003. 205 p.
5. Beighton P, Hóran F. Dominant inheritance in familial generalised articular hypermobility. J Bone Joint Surg Br. 1970; 52: 145-7.
6. Beighton P, Solomon I, Soskolne CL. Articular mobility in an African population. Ann Rheum Dis. 1973; 32: 413-8.
7. Brown DA, Miller WC. Normative data for strength and flexibility of women throughout life. Eur J Appl Physiol. 1998; 78 (1): 77-82.
8. Corbin CB, Noble I. Flexibility: a major component of physical fitness. Journal of Physical Education and Recreation. 1980; 51: 57-60.
9. Harris ML. A factor analytic study of flexibility. Res Quart. 1969; 40: 62-70.
10. Holland GJ. The physiology of flexibility: a review of the literature. Kinesiology Review. 1968; 1: 49-62.
11. Leighton JR. Flexibility characteristics of males 10 to 18 years of age. Arch Phys Med Rehabil. 1955; 36: 571-8.
12. Rubini EC, Costa AL, Gomes PS. The effects of stretching on strength performance. Sports Med. 2007; 37 (3): 213-24.
13. Dickinson RV. The specificity of flexibility. Res Quart. 1968; 39: 792-4.
14. Araujo CG, Chaves CP. Adult women with mitral valve prolapse are more flexible. Br J Sports Med. 2005; 39 (10): 720-4.
15. Grahame R. Pain, distress and joint hyperlaxity. Joint Bone Spine. 2000; 67: 157-63.
16. Coelho CW, Araújo CGS. Relação entre aumento da flexibilidade e facilitações na execução de ações cotidianas em adultos participantes de programa de exercício supervisionado. Revista Brasileira de Cineantropometria e Desempenho Humano. 2000; 2 (1): 31-41.
17. Pável RC, Araújo CGS. Flexiteste - nova proposição para avaliação da flexibilidade. In: Anais do Congresso Regional Brasileiro de Ciências do Esporte; 1980; Volta Redonda. 1980.
18. Araújo CGS. Flexiteste: uma nova versão dos mapas de avaliação. Kinesis.
1986; 2: 251-67.
19. Araújo C. Existe correlação entre flexibilidade e somatotipo? - uma nova metodologia para um problema antigo. Medicina do Esporte. 1983; 7 (3-4): 7-24.
20. Araújo C, Haddad P. Efeitos do aquecimento ativo sobre a flexibilidade passiva. Comunidade Esportiva. 1985; 35: 12-7.
21. Araújo C, Perez A. Características da flexibilidade em pré-escolares e escolares dos dois sexos. Boletim da Federação Internacional de Educação Física. 1985; 55 (2): 20-31.
22. Araújo CGS. Medida e avaliação da mobilidade articular: da teoria à prática. [dissertação]. Rio de Janeiro: Universidade Federal do Rio de Janeiro; 1987.
23. Araújo CGS. Flexiteste: um método completo de avaliação da flexibilidade. São Paulo: Manole; 2005.
24. Araújo CGS. Flexitest - el método de evaluación de la flexibilidad. Barcelona: Paidotribo; 2005.
25. Nóbrega ACL, Paula KC, Carvalho AC. Interaction between resistance training and flexibility training in healthy young adults. J Strength Cond Res. 2005; 19 (4): 842-6.
26. Medeiros RH, Pinent CEC, Meyer F. Aptidão física de indivíduo com doença renal crônica. J Bras Nefrol. 2002; 24 (2): 81-7.
27. Berlezi EM, Rosa PV, Souza ACA. Comparação antropométrica e do nível de aptidão física de mulheres acima de 60 anos praticantes de atividade física regular e não praticantes Rev Bras Geriatr Gerontol. 2006; 9 (3): 1-13.
28. Lima RCM, Pessoa BF, Martins BLT, Freitas DBN. Análise da durabilidade do efeito do alongamento muscular dos isquiotibiais em duas formas de intervenção. Acta Fisiatr. 2006; 13 (1): 32-8.
29. Paiva Neto A, Peres FP, Oliveira A. Comparação da flexibilidade intermovimentos entre homens e mulheres: um estudo a partir do flexiteste adaptado. Movimento & Percepção. 2006; 6 (9): 124-33.
30. Araújo CGS, Pável RC. Flexiteste - análise preliminar de sua objetividade e confiabilidade. In: Congresso Regional Brasileiro de Ciências do Esporte; 1980; Volta Redonda. 1980.
31. Silva LPS, Palma A, Araújo CGS. Validade da percepção subjetiva na avaliação da flexibilidade de adultos. Rev Bras Ciên e Mov. 2000; 8 (3): 15-20.
32. Araújo CGS, Perez AJ, Pável RC. Resultados práticos de um curso teórico-prático de 18 horas em flexibilidade na aplicação do Flexiteste. In: Congresso Regional Brasileiro de Ciências do Esporte; 1982; Volta Redonda. 1982.
33. Wells KF, Dillon EK. The sit and reach: a test of back and leg flexibility. Res Quart. 1952; 23: 115-8.
34. American Academy of Orthopedic Surgeons. Joint Motion: method of measuring and recording. Edinburgh: Churchill Livingstone; 1965. development and aging processes as regards flexibility, as
well as the chronic effects of physical training or detraining. Additionally, it will represent a useful tool for professionals adopting the recommendation for the inclusion of flexibility exercises in the broader scope of exercise prescription.
Potential Conflict of Interest
Copyright is received on the sale of books published in Brazil (Editora Manole), in the United States (Human Kinetics) and Spain (Paidotribo), as well as on commercial
softwares developed in Brazil (Micromed) which include or deal with Flexitest.
Sources of Funding
This study was funded by Conselho Nacional de Desenvolvimento Científico e Tecnológico (CNPq).
Study Association