Cardiorespiratory and Perceptual Responses to Walking and
Running at the Same Speed
Walace David Monteiro
1,2e Claudio Gil Soares de Araújo
3,4Instituto de Ciências da Atividade Física (ICAF / Aeronáutica)1; Universidade Salgado de Oliveira (UNIVERSO)2; Clínica de Medicina do Exercício (CLINIMEX) 3; Universidade Gama Filho (UGF)4, Rio de Janeiro - Brazil
Summary
Background: : It is possible that different forms of locomotion, when carried out at the same speed, may have a distinct influence on the physiological and perceptual responses to exercise.
Objective: To compare the cardiorespiratory responses and the subjective perception of the effort to walk and run at the same speed, as determined from the walk-run transition speed (WRTS).
Methods: From an initial sample of 453 subjects enrolled in the compulsory military service, 12 young adult men were selected and carefully homogenized as to age, sex, anthropometric characteristics, aerobic condition and experience in a treadmill. In preliminary sessions, the individual WRTS was determined. Thereafter, on three different days, the subjects walked and ran in balanced order, in each of the following speeds: WRTS; WRTS - 0.5 km/h; WRTS + 0.5 km/h, so as to obtain exhaled gases, heart rate (HR) and perception of effort measurements.
Results: The protocol for WRTS detection was highly reproducible (r = 0.92, p <0.05). In an intensity of exercise above the WRTS, the perceived effort, the HR, and the ventilatory variables—VE, VO2, VCO2 and R—showed higher values
during walking than during running (p <0.05), whereas at the WRTS and at the speed of 0.5 km/h below WRTS, the form of locomotion did not affect the cardiorespiratory and perceptual variables (p> 0.05).
Conclusion: Walking at a speed above the WRTS tends to be more stressful to the subject, from a physiological and perceptual point of view. It seems appropriate to individualize the WRTS and standardize the form of locomotion for determining a more accurate and physiological intensity of the aerobe exercises. (Arq Bras Cardiol 2009; 93(3) : 389-395)
Key Words: Walking; running; oxygen consumption; heart rate; exercise.
Mailing address: Claudio Gil Soares de Araújo •
Rua Siqueira Campos, 93/101 – Copacabana - 22071-030 - Rio de Janeiro, RJ - Brazil
E-mail: [email protected], [email protected]
Manuscript received September 09, 2008; revised manuscript received November 11, 2008; accepted November 11, 2008.
Introduction
The energy expenditure of exercise varies according to its characteristics1. Man, being bipedal, uses only walking and
running as natural forms locomotion. When the displacement speed is increased, there is a critical moment in which there is a transition from walking to running, which characterizes the walk-run transition speed (WRTS). Several factors influence the WRTS. Key features are the anthropometric characteristics, the level of physical fitness, the duration of the activity and the perception of the intensity of the effort.
But what exactly makes an individual choose to walk or run at a given speed? The answer to this question is far from settled2-6. Whatever the mechanism responsible for the WRTS,
the knowledge of the physiological responses to walking and running, at a speed near the WRTS can provide important data
for the prescription for aerobic exercise in healthy subjects and in patients with cardiovascular diseases. This becomes practical whenever it is necessary to combine walking and running at specified intervals of time in the same session of exercises. The analysis of these alternatives becomes even more relevant for individuals who tend to have a maximum oxygen uptake between 6 and 10 METs, for whom walking involves little effort, while running is an effort above the ventilatory anaerobe threshold (VAT) .
Unfortunately, few experiments have investigated the physiological responses obtained just above or below the WRTS7-9. Furthermore, methodological limitations of the
studies complicate inferences on the subject. Among the main limitations are the lack of reproducibility of the protocol for WRTS detection, the small number of subjects in the samples and the variability of their anthropometric characteristics, and the limited time to monitor the activities7,10.
anthropometric characteristics, aerobic condition and adaptation to work on a treadmill.
Methods
Sample
To homogenize the sample, we selected men aged between 18 and 19 years, enrolled in the military service. From a total of 453 subjects, all suitable for physical activity by a medical evaluation, those selected ranged between the 35th and 65th
percentiles in height for the group. Then, we identified those whose body mass values were closest to the median value of the group, totaling 53 volunteers. Subsequently, we excluded those who participated in competitive sports or that were accustomed to training in a treadmill. Next, we excluded 12 subjects who had the lowest limb lengths in the group. Among the remaining, we selected 24 volunteers with more homogeneous values of aerobe condition, obtained in a field test (using the same strategy: median ± 12). In addition to selecting individuals to be submitted to a cardiopulmonary exercise test, the field test aimed to eliminate a possible influence of the VAT in the detection of the WRTS. To make sure that the members of the sample reached the WRTS below the VAT speed, we identified, initially, the subjects whose VAT was over 9 METs in the field test. Considering that the VAT in non-athletes usually occurs between 60% and 70% of the peak oxygen uptake (VO2peak), the members of the study should have, at least, maximum aerobic power values between 14 and 16 METs, which would correspond to distances between 2700 and 3200 m in the 12-minute field test11.
For the 24 selected subjects, a treadmill adaptation training was conducted, consisting of a 15-minute running on two different days, as an adaptation of the original proposal by Wall and Charteris12,13. Finally, a maximal cardiopulmonary exercise
testing was conducted, using a ramp treadmill protocol, from which 12 subjects were selected among those who met the criteria of the maximal exercise test and whose VAT and VO2peak results were closer to the median value shown by the
group. Thus, 12 subjects were selected, carefully homogenized as to the following features (minimum and maximum): a) gender and age: men aged 18.6 ± 0.5 years (18 to 19); b) body mass of 66.4 ± 1.1 kg (64 to 68); c) height of 174.5 ± 1.4 cm (174 to 176); d) length of lower limbs of 83.3 ± 1.2 cm (81 to 85.4); e) VO2 peak of 52.2 ± 2.2 ml.kg-1.min-1 (50
and 57.1); f) VAT of 39.8 ± 2.6 ml.kg-1.min-1 ( 36.5 and 45.6).
Prior to participation in the experiment the volunteers signed a term of free informed consent and the study protocol was approved by the Institutional Ethics Committee.
Monitored variables
The monitored cardiorespiratory variables were oxygen uptake (VO2), pulmonary ventilation (VE) and carbon dioxide production (VCO2), obtained through the Medical Graphics metabolic analyzer, model GPX / D (Saint Louis, USA); and heart rate (HR), measured by the Polar monitor model Accurex Plus (Kempele, Finland). We also calculated the pulse of oxygen (O2 Pulse), the ventilatory equivalent of oxygen (VE/VO2) and of carbon dioxide (VE/VCO2), and the respiratory exchange
ratio (R). Data were monitored continuously and their average values were recorded at each minute of exercise.
The perception of effort was assessed by the Borg CR10 Scale, using separate values for local and general effort perceptions, at every minute of exercise. For local perception of effort, after standardized instructions on the proper way to quantify the perceived effort14, the subject was required
to report the symptoms observed in the lower limbs. Due to the inability to verbally express the values of the Borg scale because of the apparatus used to measure the ventilatory variables, the evaluator pointed to the values on a scale located in front of the treadmill, and the subject indicated the estimated value of perceived exertion at each moment.
Determination of the individual WRTS
As the WRTS determination is protocol-dependent7,10, we
initially determined its reproducibility, with an application on three separate days for 48 hours. After a 2-minute warm up at 4.5 km/h, the protocol began at a speed of 5.5 km/h, which was increased at every 15 seconds by 0.1 km/h. After reaching the WRTS, the subject continued in the protocol for another minute and thirty seconds. Finally, the speed was reduced to 4.5 km/h for two minutes, and the protocol was ended. To identify the exact moment in which each volunteer modified the form of locomotion, the tests were filmed, and the WRTS was determined using a video-tape, to identify the exact moment in which the individual spontaneously showed, in a definitive manner, the flight phase that characterizes running.
Evaluation of responses during different forms of locomotion
In this stage, the subjects were instructed to walk and run for eight minutes, with an intensity of effort corresponding to the individual WRTS, and at a speed equivalent to the WRTS ± 0.5 km/h. The choice of this time span to monitor the locomotion was due to the fact that individuals find it extremely difficult to remain walking above the WRTS, after the limit of eight minutes is exceeded. Thus, to standardize the comparison of the monitored variables, the same activity was applied to all speeds and forms of locomotion. The cardiorespiratory variables were monitored continuously and registered at the end of each minute of activity. As for perceived exertion, the subjects were asked to report it at the end of each minute of activity. For comparison purposes, we used the average value for eight minutes of activity. In addition, in order to stabilize the values of R, the subjects first walked at 5 km/h for two minutes. After this, the speed and form of locomotion selected for each day were applied. Data collection was performed during three days, in which the subjects carried out two activities at each visit, with an interval of one hour, minimizing the possibility of fatigue. The order of implementation of the various activities was balanced. In separate test days for each volunteer, the data were collected at the same time, and the subjects always used the same sport shoes.
Statistical treatment
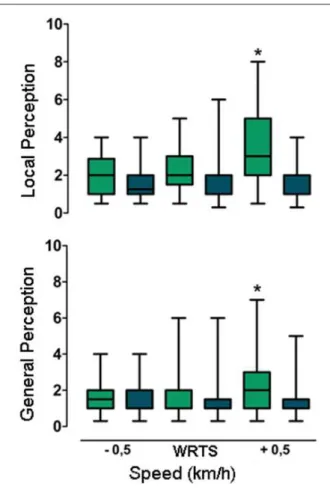
Figure 1 -Values for the Borg Scale (mean ± standard deviation) of local
and general perceptions of effort reported at the walk-run transition speed (WRTS), and at a speed below (-0.5 km/h) and above ( +0.5 km/h) the WRTS. * P <0.05.
Figure 2 -Values of HR (mean ± standard deviation) obtained at the WRTS and
at a speed below (-0.5 km/h) and above (+0.5 km/h) the WRTS. * P <0.05.
Figure 3 -Values of VO2 (mean ± standard deviation) obtained at the WRTS and at a speed below (-0.5 km/h) and above (+0.5 km/h) the WRTS. * P <0.05.
responses and the general and local perception of effort during walking and running, in three speeds studied, we used an ANOVA for repeated measures of an entry accompanied by a post-hoc verification of Bonferroni ( p <0.05). The software STATISTICA for Windows, version 6.0, Statsoft Incorporation (Tulsa, USA), was used for all data analyses. The figures were prepared with GraphPad Prism 5 (San Diego, USA).
Results
In the WRTS detection, we observed very similar values within three days of tests, reflecting a low interday variability (8.2 km/h; 8.1 km/h; 8.1 km/h, respectively, p> 0, 05). In addition, the protocol was highly reproducible and showed an intraclass correlation coefficient of 0.92 (p <0.05).
The physiological responses to exercise differed in the speeds and forms of locomotion that were assessed in the study. The general and local effort perceptions also showed different behaviors (Figure 1), tending to be higher during walking, especially above the WRTS (p <0.05). The results for local perception of effort were consistently higher than those reported for general perception (p <0.05).
The HR and VO2 responses increased with the increase in speed. However, statistical differences (p <0.05) between forms
of locomotion were only observed above the WRTS (Figures 2 and 3). At this speed, the HR was about 20 bpm higher during walking than during running, while the VO2 was superior by
5 ml.kg-1.min-1. Comparing the lowest and the highest speed
investigated, we found that the HR increased, on average, by only 2.5% during running, and by 22% during walking. The same analysis for the VO2 shows that at a speed of 0.5 km/h below the WRTS, the oxygen uptake is about 3 ml.kg-1.min-1
lower for walking (7%), while at the speed of 0.5 km/h above the WRTS, running represents an economy of 15%.
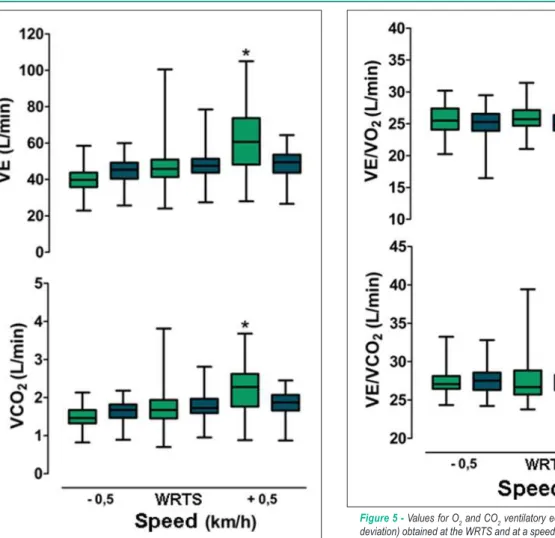
Figure 4 -Values of VE and VCO2 (mean ± standard deviation) obtained at the WRTS and at a speed below (-0.5 km/h) and above (+0.5 km/h) the WRTS. * P <0.05.
The O2 pulse showed no significant difference between walking and running in any of the three speeds studied (p> 0.05) (Figure 6), although a trend to progressively higher values was observed when the speed was increased in both forms of locomotion. For all speeds investigated, walking had systematically higher values of R than running, although a significant difference (p <0.05) for walking was only observed at the higher speed (Figure 7).
Discussion
The components of a prescription for exercises include the selection of sport modality, intensity of effort, duration of the activity, weekly frequency and pattern of exercise progression15,16. These components are used to determine
prescriptions in subjects of all ages, functional abilities and clinical conditions17-20. Despite the importance of all
components, the intensity of effort is one of the most difficult to quantify. As to the form of locomotion, the selection of the appropriate modality is the first element to be defined, since it may influence the intensity of effort.
Figure 5 -Values for O2 and CO2 ventilatory equivalents (mean ± standard deviation) obtained at the WRTS and at a speed below (-0.5 km/h) and above (+0.5 km/h) the WRTS. * P <0.05.
Before discussing the results, the influence of the protocols in obtaining the variables, as determined from the WRTS is worth mentioning. In continuous protocols with stages of less than four minutes, the responses to the effort can behave differently from those observed in protocols that use efforts of constant intensity in more prolonged stages7,21. In the case of protocols with
longer stages, the variable values can be computed throughout the monitoring period. Thereafter, these variable values are compared to verify the existence of differences between the two forms of locomotion8,9. This procedure allows the study of
exercise prescription in more realistic conditions and, therefore, we chose this strategy to monitor the responses to walking and running, investigating the values of cardiorespiratory and effort perception variables in eight minutes.
The only trial that investigated ventilatory variables during running and walking based on the WRTS determination was conducted by Mercier et al9, and followed seven subjects for four
Figure 7 -Values of R (mean ± standard deviation) obtained at the WRTS and at a speed below (-0.5 km/h) and above (+0.5 km/h) the WRTS. * P <0.05.
Figure 6 -Values of O2 pulse (mean ± standard deviation) obtained at the WRTS and at intensities below (-0.5 km/h) and above (+0.5 km/h) the WRTS.
However, the small number of subjects, and the heterogenous anthropometric features and cardiorespiratory fitness limited the results. In addition, each form of locomotion was accompanied only for 4 minutes, which represents a short interval of time to obtain stability of the cardiorespiratory variables, especially in intensity above the WRTS. Finally, there were no reported data concerning the reproducibility of the protocol for detection of the WRTS, which limits the consistent inferences obtained from the study.
Brisswalter and Mottet8 also investigated the relationship
between the energy costs at speeds that were imposed and selected based on the WRTS. As the objectives of the study focused on the energy demand, the only data obtained from exhaled gases measurements were the VO2 values during running and walking. This experiment showed methodological problems similar to those observed by Mercier et al9, which also reduces
the consistency of the results.
The data found in this study appear to be opposed to those observed by Mercier et al9. In our study, we obtained similar
data for the monitored cardiorespiratory variables at 0.5 km/h below the WRTS, which did not occur at 0.5 km/h above the WRTS. At the latter speed, significant differences were observed in ventilatory (except O2 pulse) and HR variables
between walking and running. The exception found for the O2 pulse can be explained by the similar increases in VO2 and HR values, which rendered the relationship between these variables essentially constant at the assessed speeds.
Besides the cardiorespiratory responses, our study followed the local and general perception of effort. In both forms of perception, there was a greater value during walking than during running, at a speed above the WRTS, corroborating the data observed for HR and ventilatory variables. At all speeds, the local perception had higher scores than the general perception during walking, suggesting a strong influence of peripheral factors on this form of locomotion3,5. Above the
WRTS, VO2, HR and VE responses were higher during walking than during running, possibly due to an increased recruitment of the muscles of the trunk and upper limbs with the increase in speed in this form of locomotion, also increasing the eccentric work for carrying out the movement5. There may
be a relationship between the local perception of greater effort and the greater increase in cardiorespiratory variables. Prilutsky and Gregor3 evaluated several leg muscles during
walking and running at speeds between 55 and 145% of the WRTS by EMG, noting that the action of the flexor muscles was greater during walking than during running above the WRTS. The lower VO2 during running at higher speeds may be
a consequence of the elastic energy stored during the running support stage22,23, as occurs in walking24.
Three aspects seem to explain the differences between this study and the one conducted by Mercier et al9. The first
concerns the sample selection. The sample of the above mentioned study was small and heterogeneous regarding gender, anthropometric characteristics, aerobic condition and experience in working on a treadmill. The careful homogeneization of these characteristics in this study may have contributed to a greater control of the measurements obtained, since they can affect the cardiorespiratory responses to exercise. The difference in the WRTS detection protocols may also have influenced the differences in results. Only one study presented data on reproducibility of the WRTS detection protocol, in which an intraclass coefficient of 0.72 was observed for the WRTS determined in different days7. In this
study, there was a high reproducibility of the WRTS detection protocol, which showed an intraclass correlation coefficient of 0.92, higher than the value reported in the literature.
Finally, we highlight the difference in monitoring time of variables between the studies. Our data were followed for eight minutes, while Mercier et al9 followed for just four
until the end of the eighth minute. A pilot study showed that there was no stability of measurements and that it was extremely difficult to make volunteers remain walking for more than four or five minutes at 1 km/h above the WRTS. From the application, this means that walking fast at speeds above the WRTS may not be a good strategy for completing the exercise, due to the rapid increase in cardiorespiratory and perceptual responses to exercise.
If walking is the most appropriate form of locomotion for the initial phase of cardiac rehabilitation programs, the subsequent inclusion of running is quite common and recommended. However, for those who do not fit in these two extremes, the choice of one or other activity may have implications in the possibilities of effort tolerance25. The
results of this study call attention to the impact that the choice of the form of locomotion can have in quantifying the intensity of the exercise. The perception of effort, which was higher during walking in all investigated speeds, calls attention to the importance of monitoring peripheral factors, as well as the metabolic data. In this sense, the Borg scale focused on perceptions of local efforts can assist in monitoring the exercise intensity. In addition, small variations in speed in different forms of locomotion can cause different responses to the effort. In this study, a variation of approximately 15% in speed and in the form of locomotion represented individual differences of up to 50% in the VO2 measured during exercise (Figure 3). For some subjects, the HR varied by up to 25 bpm between running and walking at the same speed. However, changes in running speed around the WRTS did not significantly affect the HR responses and may even be more convenient to some subjects from a locomotor point of view (Figure 2).
The data of this research also suggest implications for the energy expenditure of the activity. The use of equations for prescribing exercise based on the expenditure of energy may be relatively useful in submaximal activities, standardized and carried out under steady-state conditions. However, the adoption of such equations does not apply to a range of speeds in which occurs the transition between walking and running, more typically between 6 and 8 km/h. In this case, for the same form of locomotion, the individual variability in VO2 and consequently in energy expenditure, may reach 20%, making difficult the use of predictive equations1. The
choice between walking or running at the same speed raises different implications in energy demand, as shown in this study VO2 data, highlighting the influence of different forms of locomotion, when the exercise is conducted at speeds above or below the WRTS. At intensities below, or even at the WRTS, running tends to provide slightly higher values than those of walking. However, above the WRTS, walking will have more influence on VO2 values, and thus on the expenditure of energy, than running. These findings emphasize the importance of choosing the form of locomotion in the exercise programs for cardiac rehabilitation, in which the subjects exercise in intensity near the WRTS, with clinical implications and greater safety in the prescription of atictivities1,26.
Another aspect to be highlighted is the importance of the form of locomotion in the behavior of the VE and the O2 and CO2 ventilatory equivalents. Above the WRTS, a larger increase
was observed in these indicators during walking than during running, which can result in implications for the subjects who have cardiorespiratory limitations27-29. This fact further
reinforces the need to correctly select the form of locomotion in the prescription for exercise in these individuals.
The use of energy substrates also appears to be influenced by the form of locomotion. At the speeds investigated, walking tended to present systematically higher values of R than running, and the difference was significant (p <0.05) above the WRTS. Regarding the influence of the form of locomotion in fatigue at the end of eight minutes of walking, the VO2 exceeded that obtained in the VAT, which does not happen during running. These findings also stressed the importance of a proper selection of the form of locomotion in the exercise prescription, especially in programs of 20 to 60 minutes, which are recommended to improve the aerobic fitness1.
Therefore, the WRTS detection is a recommended strategy to determine limits on walking during a session of aerobic exercises, especially for subjects who need more care in the control of physiological variables during exercise.
Conclusion
From a homogenized sample regarding sex, age, anthropometric characteristics, aerobic condition and experience in working on a treadmill, we found that at the speed of 0.5 km/h above the WRTS, the local and general perceptions of effort and the responses of HR, VO2, VE,
VCO2 and R showed higher values during walking than
during running, demonstrating the influence of the form of locomotion as an indicator of relative intensity of effort, use of energy substrate and tolerance to fatigue. At the WRTS, or at a speed of 0.5 km/h below the WRTS, the form of locomotion did not induce significant differences on the assessed cardiorespiratory variables and in the perception of effort. These data reinforce the importance of selecting the appropriate form of locomotion in the aerobic exercise prescription. However, due to the relatively short time span to monitor the investigated speeds, it was not possible to accurately extrapolate our findings to exercise sessions that exceed 30 minutes, which are designed to increase cardiorespiratory fitness. Future studies should be conducted with longer follow-up of variables, to further determine the influence of the form of locomotion on aerobic exercise prescriptions to non-athletes.
Potential Conflict of Interest
No potential conflict of interest relevant to this article was reported.
Sources of Funding
This study was partially funded by CNPq.
Study Association
References
1. ACSM’s. Guidelines for Exercise Testing and Prescription. 7th ed. Philadelphia: Williams & Wilkins; 2006.
2. Hreljac A. Determinants of the gait transition speed during human locomotion: kinematic factors. J Biomech. 1995; 28 (6): 669-77. 3. Prilutsky BI, Gregor RJ. Swing and support-related muscle actions differentially
trigger human walk-run and run-walk-transitions. J Exp Biol. 2001; 204: 2277-87.
4. Saibene F, Minetti AE. Biomechanical and physiological aspects of legged locomotion in humans. Eur J Appl Physiol. 2003; 88 (4-5): 297-316. 5. Segers V, Lenoir M, Aerts P, De Clercq D. Influence of M. tibialis anterior
fatigue on the walk-to-run and run-to-walk transition in non-steady state locomotion. Gait Posture. 2007;25(4):639-47.
6. Thorstesson A, Roberthson H. Adaptations to changing speed in human locomotion: speed of transition between walking and running. Acta Physiol Scand. 1987; 131: 211-4.
7. Hanna A, Albernety B, Neal RJ, Burgess-Limerick R. Triggers of the transition between human walking and running. In: WA S, (ed). Energetics of human activity. Champaign: Human Kinetics; 2000. p. 124-64.
8. Brisswalter J, Mottet D. Energy cost and stride duration variability at preferred transition gait speed between walking and running. Can J Appl Physiol. 1996; 21 (6): 471-80.
9. Mercier J, Le Gallais D, Durand M, Goudal C, Micallef JP, Prefaut C. Energy expenditure and cardiorespiratory responses at the transition between walking and running. Eur J Appl Physiol. 1994; 69: 525-9.
10. Monteiro WD, Araujo CGS. Transição caminhada-corrida: considerações fisiológicas e perspectivas para estudos futuros. Rev Bras Med Esporte. 2001; 7: 207-22.
11. Cooper KH. A means of assessing maximal oxygen intake: correlation between field and treadmill testing. JAMA. 1968; 203 (3): 201-4. 12. Wall JC, Charteris J. The process of habituation to treadmill walking at different
velocities. Ergonomics. 1980; 23 (5): 425-35.
13. Wall JC, Charteris J. A kinematic study of long-term habituation to treadmill walking. Ergonomics. 1981; 24 (7): 531-42.
14. Borg G. Borg’s perceived exertion and pain scales. Champaing: Human Kinetics; 1998.
15. Araújo CGS, Carvalho T, Castro CL, Costa RV, Moraes RS, Oliveira Filho JA, et al. Normatização dos equipamentos e técnicas da reabilitação cardiovascular supervisionada. Arq Bras Cardiol. 2004; 83 (5): 448-52.
16. Sociedade Brasileira de Cardiologia. Diretriz de reabilitação cardíaca. Arq Bras Cardiol. 2005; 84 (5): 431-40.
17. Giada F, Biffi A, Agostoni P, Anedda A, Belardinelli R, Carlon R, et al. Exercise prescription for the prevention and treatment of cardiovascular diseases: part I. J Cardiovasc Med. 2008; 9: 529-44.
18. Haskell WL, Lee IM, Pate RR, Powell KE, Blair SN, Franklin BA, et al. Physical activity and public health: updated recommendation for adults from the American College of Sports Medicine and the American Heart Association. Circulation. 2007; 116 (9): 1081-93.
19. Myers J. Principles of exercise prescription for patients with chronic heart failure. Heart Fail Rev. 2008; 13 (1): 61-8.
20. Nelson ME, Rejeski WJ, Blair SN, Duncan PW, Judge JO, King AC, et al. Physical activity and public health in older adults: recommendation from the American College of Sports Medicine and the American Heart Association. Circulation. 2007; 116 (9): 1094-105.
21. de Araújo CGS. Respostas cardiorespiratórias a um exercício submáximo prolongado. Arq Bras Cardiol. 1983; 41 (1): 37-45.
22. Cavanagh PR, Kram R. Mechanical and muscular factors affecting the efficiency of human movement. Med Sci Sports Exerc. 1985; 17 (3): 326-31.
23. Gleim GW, Stachenfeld NS, Nicholas JA. The influence of flexibility on economy of walking and jogging. J Orthop Res. 1990; 8 (6): 814-23. 24. Luhtanen P, Komi PV. Mechanical energy states during running. Eur J Appl
Physiol Occup Physiol. 1978; 38 (1): 41-8.
25. Hasegawa H, Inui F. Influence of higher-grade walking on metabolic demands in young untrained Japanese women. J Strength Cond Res. 2007; 21 (2): 405-8.
26. Quell KJ, Porcari JP, Franklin BA, Foster C, Andreuzzi RA, Anthony RM. Is brisk walking an adequate aerobic training stimulus for cardiac patients? Chest. 2002; 122 (5): 1852-6.
27. Donesky-Cuenco D, Janson S, Neuhaus J, Neilands TB, Carrieri-Kohlman V. Adherence to a home-walking prescription in patients with chronic obstructive pulmonary disease. Heart Lung. 2007; 36 (5): 348-63. 28. Ringbaek T, Brondum E, Martinez G, Lange P. Rehabilitation in COPD:
the long-term effect of a supervised 7-week program succeeded by a self-monitored walking program. Chron Respir Dis. 2008; 5 (2): 75-80. 29. Witte KK, Thackray SD, Nikitin NP, Cleland JG, Clark AL. Pattern of ventilation