Introduction
Aerobic exercise through the continuous method is the most common running training prescription. The high-performance athletes train in a polarized way with ~75% of the training be-ing performed below or at the Ventilatory Anaerobic Threshold (VAT)¹. When performing exercise close to the VAT, we can observe a physiological steady state, a phenomenon character-ized by intrinsic adjustments of the organism to maintain the balance of energy substrates via aerobic metabolism2,3.
For an accurate evaluation of steady state, there is a need for equipment with good accuracy in the metabolic variables measurement, and not only lactate and heart rate (HR)4. This way, the cardiopulmonary exercise testing (CPx), and the gold-standard method for prognostic and diagnostic of cardiopulmo-nary diseases, can be used to prescribe physical exercises as well as evaluate the physiological steady state, identify ventilatory thresholds and the maximum consumption of O2 (V·O2max) in a non-invasive way, through gas exchange analysis5.
VAT is better than V·O2max to prescribe exercise intensity and as sports performance forecast4,5. Its identification can be made by the non-linear increase in pulmonary ventilation, by the increases in the ventilatory equivalent of O2 (VE/V·O2) without concomitant increase of VE/V·CO26 and by the computerized V-slope method, that indicates the intersection point with loss of linearity between V·CO2/V·O27. These ventilatory adjustments are considered moments of metabolic and ventilatory imbalance and indicate an attempt of maintaining homeostasis of physi-ological processes to continue the exercise4,8,9,10.
The steady state at the production and use of lactate with the superior limit level in the [Lac-] of 2.2 mmol·L-1 during con-stant load exercise relative to the VAT was previously reported in literature10,11,12,13,14,19,20,27,29.
When evaluating the kinetics of O2 consumption17,18, we can observe a steady state at an intensity below VAT15. Nevertheless, when performing continuous exercise above VAT, the steady state occurrence may be delayed or not reached due to the slow component of O2, so there will be an increased contribution of glycolytic metabolism to generate ATP. This way, Whipp et al. (1972)18 claimed that during constant exercise V·O
2 took longer than 3 min to stabilize, therefore not reaching the steady state, the individual would be exercising at VAT intensity or above. In an attempt of characterizing the steady state, Haverty et. al (1988)24 indicated a variation of 0.2 L·min-1 in the V·O
2 in the last 10 min of exercise24. These findings present a lack of consensus regarding the determination of the steady state.
The exercise at VAT intensity is used as an efficient cardio -pulmonary stimulus to trigger adaptive responses to training19,20,
but we still have to find out if the behavior of ventilatory, gas
exchange and metabolic variables can exhibit a steady state response in exercises with constant VAT intensity for individuals with different levels of performance. Therefore, the possibility of a steady state in individuals with a high level of V·O2max is hypothesized, which is related to a higher mechanical, metabolic and enzymatic adaptation.
Thus, the characterization of the steady state from ventilatory variables is a non-invasive method and training at VAT intensity promotes low risks for practitioners and, at the same time, in-duces positive physiological adaptations1 that can contribute to the prescription of continuous aerobic exercise for individuals with different levels of training.
Therefore, we aimed to describe the behavior of different cardiopulmonary variables in exercises with constant running speed at the VAT intensity and to identify the occurrence of the steady state according to the level of performance.
Original Article (short paper)
Level of performance and stability of cardiopulmonary variables in
the intensity of the ventilatory anaerobic threshold
Victor Hugo Gasparini Neto1, Luciana Carletti1, Paulo Henrique Silva Marques de Azevedo2, Anselmo José Perez1
1Unversidade Federal do Espírito Santo, UFES, Centro de Educação Física e Desporto, CEFD, Vitória, ES, Brazil; 2 Universi-dade Federal de São Paulo, UNIFESP, Pós-graduação em Ciências do Movimento Humano e Reabilitação, Santos, SP, Brazil
Abstract — Aim: The aim of this study was to describe the behavior of different cardiopulmonary variables in exercise session with constant running speed, corresponding to the intensity of ventilatory anaerobic threshold and identifying the steady state in a different level of performance. Methods: A cross-sectional study with nine elite athletes (31 ± 5.7 years, 1.7 ± 0.05 meters and V·O2max 68.6 ± 3.2 mL·kg-1·min-1) and nine non-athletes (32 ± 10 years, 1.8 ± 0.1 meters and V ·O
2max 47.2± 4.4 mL·kg-1·min-1). Two visits to the laboratory have been conducted. Firstly, cardiopulmonary exercise testing until voluntary exhaustion took place to identify ventilatory thresholds and maximum oxygen consumption (V·O2max) and secondly, there was a running sessionfor 1 hour in ventilatory anaerobic threshold speed, with continuous measurement
of exhaled gases. A range of 5% (∆5%) for VO2 and PetCO2 was used; 5.5% (∆5.5%) for VE and 3% (∆3%) for respiratory
exchange ratio (RER) and one-way ANOVA with statistical significance of p ≤ 0.05 to identify the steady state of results.
Results: A session with constant speed related to ventilatory anaerobic threshold intensity showed similarity in the steady state of ventilatory variables except for RER in the NA group (p ≤ 0.05). Conclusion: It was possible to identify the steady state from ventilatory variables related to ventilatory anaerobic threshold intensity that occurred independently of the physical performance level.
Methods
Subjects
This study evaluated 18 street runners, 9 elite athletes (EA) that were highly trained and have participated in races of 5 and 10
km, classified between 1st and 5th place in street races (Espirito Santo/Brazil), and 9 non-athlete (NA) that have participated, but not regularly, in races of 5 km, without comorbidities (Table 1). We calculated the sample size according to the expecting
modi-fications in the V·O2max (zα =1.96 and zβ = 0.84). The volunteers were informed to refrain from coffee, alcohol and exhaustive exercise for almost 24h before visiting the laboratory. On the
first visit, they came in the morning between 9 and 11h and
performed anthropometry and cardiopulmonary exercise testing
(CPx). On the second visit, 48h after the first one, they run at
VAT speed. The procedures were conducted according to the CNS 466 resolution of December 12th, 2012 and approved by the Research Ethics Committee at UFES, n° 261.897 on May, 2013. All individuals were informed of the experimental procedures, singing the Term of Written Informed Consent.
Identifying Ventilatory Anaerobic Thresholds
The VAT was identified at the lowest point following a sustained
increase in the ventilatory equivalent for oxygen (VE/V·O2), without increasing the ventilatory equivalent for carbon dioxide (VE/V·CO2); through V-slope6, indicating a point of intersection with loss of linearity between V·CO2/V·O2 and an abrupt increase of VE and PetO2. In the visual method, three evaluators analyzed the results blindly and independently and the agreeing points of at least two of them were considered.
Exercise Session
A five-minute warm-up on 20% intensity lower than the VAT
achieved in CPx and free static stretches were performed. The calibration procedures of the equipment were used as described in CPx, and shortly after the warm-up, the mask placement procedure was performed where they remained standing on the treadmill for 2 min, after adjusting the treadmill control in the VAT. The treadmill started progressively until the individual velocity of VAT was achieved with a maximal duration of 1 hour.
Data analysis and statistical procedures
The Kolmogorov-Smirnov test was used to test the normality of data. In the exercise session at VAT, averages were calculated every 2 min, making the graphic visualization easier. The data are presented as mean ± standard deviation. To compare the CPx averages among groups, student’s independent t-test was used. To evaluate the magnitude of differences, Hedges’ g for effect size metrics was used from the arbitrary scale of 0.2; 0.5; 0.8 and 1.330. To consider a steady state vs time we used one-way ANOVA with Tukey’s post hoc test for multiple comparisons
and variations of 5% (∆ 5%) for V·O2 and PetCO2; 5.5% (∆
5.5%) for VE and 3% (∆ 3%) for RER5. The software SigmaStat 3.5© (Systat Software, Germany, 2006) was used for inferential
analysis with significance level (p ≤ 0.05).
Results
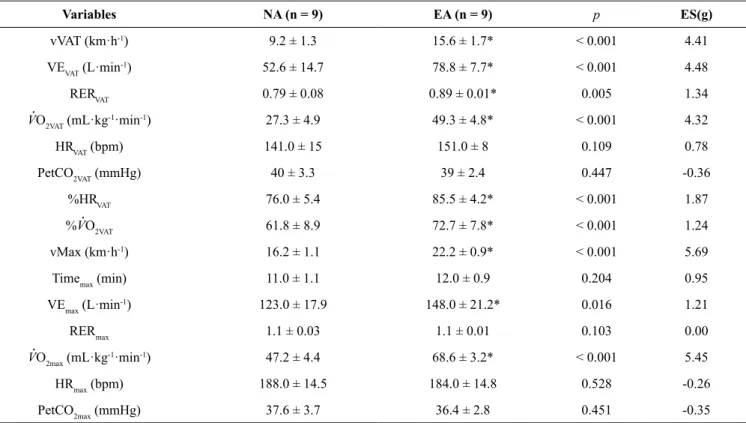
The speeds reached at VAT (NA = 9.2 ± 1.3 km·h-1 and AE = 15.6 ± 1.7 km·h-1, p <0.001, ES = 4.41) and maximum (NA = 16.2 ± 1.1 km·h-1 and AE = 22.2 ± 0.9 km·h-1, p < 0.001, ES = 5.69), were 41% and 27% higher for the EA group, with statistical dif-ferences between the groups and a very large effect size. (Table 2) The VE, RER and V·O2 variables were statistically different between the groups (p ≤ 0.05) with values of 33%, 26% and 45% higher for EA, respectively.
The total test time 12 ± 0.9 and 11 ± 1.1 min of CPx did not differ statistically in EA and NA, but presented a large effect size of difference (p = 0.204, ES = 0.95). The %HRVAT presented a value 9.5% lower (p < 0.001; ES = 1.87) and the %V·O2VAT with 11% lower (p < 0.001; ES = 1.24) for NA. (Table 2)
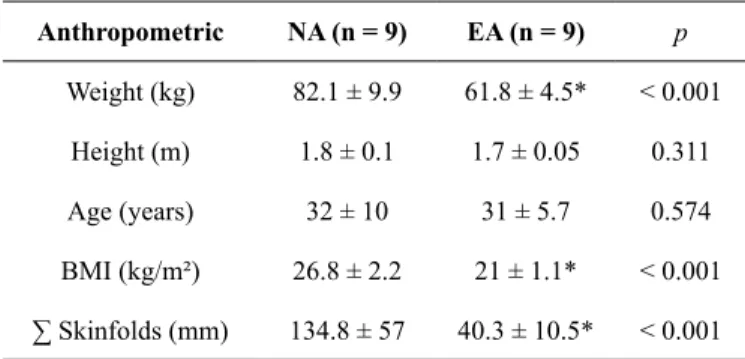
Table 1- Anthropometric characteristics in the EA and NA groups, street runners.
Anthropometric NA (n = 9) EA (n = 9) p
Weight (kg) 82.1 ± 9.9 61.8 ± 4.5* < 0.001
Height (m) 1.8 ± 0.1 1.7 ± 0.05 0.311
Age (years) 32 ± 10 31 ± 5.7 0.574
BMI (kg/m²) 26.8 ± 2.2 21 ± 1.1* < 0.001
∑ Skinfolds (mm) 134.8 ± 57 40.3 ± 10.5* < 0.001
Mean ± SD. EA – Elite Athletes; NA – Non-Athletes. Skinfolds: triciptal, subscapular, mid axilla, chest, iliac crest, abdominal and thigh. Student’s t-test
for independent samples. * p ≤ 0.05.
Cardiopulmonary Exercise Testing (CPx)
The CPx was performed on a treadmill (Inbra Sport Super ATL, Porto Alegre, Brazil), with a 1% inclination following the ramp protocol, with a duration of 8 - 12 min. The speed was gradually increased until exhaustion. The EA group, the initial speed was of 8 km·h-1 and the NA group was of 5 km·h-1 with an increase of 0.7 to 1 km·h-1 per minute. A Metabolic Gas Analyzer (Cortex Metalyzer 3B, Germany) was used, with breath-by-breath measure and a calibration of mixed gas (11.97 %O2 and 4.95 %CO2) before each test, which was analyzed with an average of 15 seconds. The volume was calibrated with a syringe of 3L. The room temperature was controlled between 23ºC and 25ºC, and the test was supervised by a cardiologist. At least three of the following criteria were
considered as maximum test: a) voluntary exhaustion; b) ≥
90% of the predicted HR; c) respiratory exchange ratio (RER) is equal to or greater than 1.0521; d) plateau of V·O
Table 2 – Speed, metabolic and ventilatory variables of CPx regarding vVAT.
Variables NA (n = 9) EA (n = 9) p ES(g)
vVAT (km·h-1) 9.2 ± 1.3 15.6 ± 1.7* < 0.001 4.41
VEVAT (L·min-1) 52.6 ± 14.7 78.8 ± 7.7* < 0.001 4.48
RERVAT 0.79 ± 0.08 0.89 ± 0.01* 0.005 1.34
V·O2VAT (mL·kg-1·min-1) 27.3 ± 4.9 49.3 ± 4.8* < 0.001 4.32
HRVAT (bpm) 141.0 ± 15 151.0 ± 8 0.109 0.78
PetCO2VAT (mmHg) 40 ± 3.3 39 ± 2.4 0.447 -0.36
%HRVAT 76.0 ± 5.4 85.5 ± 4.2* < 0.001 1.87
%V·O2VAT 61.8 ± 8.9 72.7 ± 7.8* < 0.001 1.24
vMax (km·h-1) 16.2 ± 1.1 22.2 ± 0.9* < 0.001 5.69
Timemax (min) 11.0 ± 1.1 12.0 ± 0.9 0.204 0.95
VEmax (L·min-1) 123.0 ± 17.9 148.0 ± 21.2* 0.016 1.21
RERmax 1.1 ± 0.03 1.1 ± 0.01 0.103 0.00
V·O2max (mL·kg-1·min-1) 47.2 ± 4.4 68.6 ± 3.2* < 0.001 5.45
HRmax (bpm) 188.0 ± 14.5 184.0 ± 14.8 0.528 -0.26
PetCO2max (mmHg) 37.6 ± 3.7 36.4 ± 2.8 0.451 -0.35
Mean ± SD (NA – non athletes; EA- elite athletes; student’s t-test for independent samples *p ≤ 0.05; ES – effect size – Hedges’ g). Legend: vVAT – speed corresponding
VAT; VE – pulmonary ventilation per minute; RER – respiratory exchange ratio; V·O2 – oxygen consumption; HR – heart rate; PetCO2 partial pressure of expired
carbon dioxide; %HRVAT and %VO2VAT – Percentage of VAT.
VAT session: behavior of ventilatory variables
Seventeen individuals performed a one-hour run. However, one individual in the EA group performed it in 40 min,possibly be-cause we do not have any control of competitive period and this athlete could feel the effects of this vigorous phase of training.
As observed in Figure 1, both groups presented a steady state behavior of V·O2, remaining in the criterion of (∆ 5%) (p > 0.05). From the 4th to the 60th min there have been differences of 1 and 3 mL·kg-1·min-1 for the AE and NA groups respectively. (Figure 1)
The VE presented a steady state considering the criteria
(∆ 5.5%) and (p > 0.05). From the 4th to the 60th minute there have been differences of 11 and 12.2 L·min-1 for the AE and NA groups respectively. (Figure 2)
Both groups show a reduction in the RER during VAT in the 1-hour training session. In the EA group, the RER rates varied from 0.89 to 0.87 from the 4th to the 60th minute, and despite this behavior, there are no statistical differences (p > 0.05). In the NA group, the rates varied from 0.88 to 0.82 from the 4th to the 60th minute with statistical differences (p < 0.05), however,
considering the criteria of variation of (∆ 3%), both groups
presented steady state. (Figure 3)
The PetCO2 behavior in the EA and NA groups presented a reduction of rates, but without statistical differences. In the EA group, the PetCO2 rates varied from 37.8 to 35.5 mmHg from the 4th to the 60th minute with a 2.3 mmHg difference. In the NA group, the rates varied from 40.2 to 36.5 from the 4th to the 60th minute with a 3.7 mmHg difference (p > 0.05). (Figure 4)
Figure 1− V·O2 (mL·kg-1·min-1) in 1 hour of running at vVAT in EA and NA (p > 0.05).
2 6 10 14 18 22 26 30 34 38 42 46 50 54 58
20 25 30 35 40 45 50 55 60
Time (min)
V
O2
(mL∙Kg
-1∙min -1)
EA
NA
Figure 2− VE (L·min-1) during 1-hour exercise at vVAT in EA and NA (p > 0.05).
2 6 10 14 18 22 26 30 34 38 42 46 50 54 58
Time (min)
VEL.min
-1
40 50 60 70 80 90 100 110
EA
NA ∆5,5%
Figure 3− RER during 1 hour exercise at vVAT in the EA (p > 0.05) and NA (p < 0.05) group.
2 6 10 14 18 22 26 30 34 38 42 46 50 54 58
2 6 10 14 18 22 26 30 34 38 42 46 50 54 58 0,80
0,84 0,88 0,92
0,75 0,79 0,83 0,87 0,91
RER
RER
Time (min)
Time (min)
∆ 3% EA
Discussion
A session of continuous exercise at VAT speed applied to two groups of runners of different performance levels has presented a steady state behavior in the ventilatory variables: V·O2, VE, RER and PetCO2. Until the present moment, to our knowledge, this
was the first study to evaluate the steady state in this intensity
with individuals of different performance levels.
A variation of 1 mL·kg-1·min-1 in the EA group represented 75 to 77%, and the variation of 3 mL·kg-1·min-1 in the NA group represented 64 to 70% of V·O2max from the 4th to the 60th minute, characterizing a lower variation and higher stability for the EA. This acute responses are expected because athletes have higher mechanical, metabolic and enzymatic adaptation compared with non athletes. Some explanations about metabolic and
enzymatic adaptations are demonstrated by Fink et al. (1977). They demonstrate in elite runners 82.9% of the cross-sectional
area is composed by slow-twitch fibers, compared with 40.5
and 69.4% in middle distance runners (800 – 5000 m). In elite runners muscles, the activity of succinate dehydrogenase (SDH) is greater 21.6 µmoles/g·min vs 17.7 µmoles/g·min compared with middle distance runners31.
One difference of our study was the use of two criteria to identify the steady state that presents greater accuracy in the
identification of the steady state whereas previous studies pre -sented only one criterion12,19,20.
Tanaka (1991) observed a reduction of the RER (0.87 – 0.82) with a decrease in [Lac-] after 20 minutes of exercise12. Despite not evaluating [Lac-], these data corroborate with our findings, which presented a reduction of RER (0.88 – 0.82) for the NA
Figure 4− PetCO2 during 1-hour exercise at vVAT in EA and NA (p > 0.05).
2 6 10 14 18 22 26 30 34 38 42 46 50 54 58 2 6 10 14 18 22 26 30 34 38 42 46 50 54 58
Time (min)
Time (min)
PetCO
2
(mmHg)
PetCO
2
(mmHg)
34 35 36 37 38 39 40 41 33 34 35 36 37 38 39
∆5%
EA
group. However, contrary to what was expected, in the EA group the RER showed a reduction, but without statistical difference.
Even though our study evaluates responses of only one exercise session, the importance of the steady state training at VAT intensity for runners stands out. Also, a high rate of
VAT expressed in running speed is correlated (r =0.60) with
better performance and higher average speed in 5 km runs23, LaFontaine et al. (1981) showed high correlation between the maximum steady state of V·O2 identified during treadmill tests and [Lac-] of 2.2 mmol·L-1 during track tests, especially for 8
km runs (r= 0.995)20. This study corroborates with our findings, presenting similar values for the EA group in the V·O2max (66.1 vs 68.6 mL·kg-1·min-1), V·O
2VAT (52.4 vs 49.3 mL·kg
-1·min-1) and
VAT speed (15.5 vs 15.6 km.h-1), that may indicate the occur-rence of the steady state at VAT intensity. This way, previous
studies confirm the importance of training in the steady state
at VAT intensity, presenting an increase in V·O2max and in the anaerobic potential, decrease in resting HR and an increase of performance in 15km, 600 m, 3.22 km and 10 km runs23,24. A high correlation between LT and VAT reinforces the use of non-invasive measures to identify the thresholds and their ap-plication during the training23,24.
The continuous training at or near VAT intensity promotes
adaptations such as the increase of type I muscle fibers, the
increase of activity and expression of enzyme markers of the citric acid cycle like citrate synthase, which is responsible for starting the Krebs cycle, the increase of BHAD (3- hidroxyacil COA desidrogenase) a key enzyme in beta-oxidation and an
increase of expression and activity of PGC1–α, an important
co-activator responsible for the increase of mitochondrial
num-bers and type I and IIa muscle finum-bers in the skeletal muscle25,26. These adaptations can maximize the oxidative input and the use of energy substrates during the exercise, enhancing the physical capacity and performance.
A limitation of this study may be the non-control of the training period, what makes it possible that the athletes had been evaluated in different phases of the periodization. However,
this did not avoid the identification of steady state. Failure to
perform the sample calculation for all ventilatory and metabolic variables evaluated except V·O2 can be considered as another limitation of this study. However, they have not diminished the strength of the results due to the inclusion of the effect size. Another aspect to be considered is the metabolic analysis added as measures of [Lac-] and HCO
3
-, in order to confirm the steady state. Nevertheless, such limitations do not interfere with the
findings, since the characterization of the steady state is more
carefully analyzed when compared to previous studies. In practical terms, if we want an exercise intensity that has low risks for practitioners and, at the same time, induces posi-tive physiological adaptations, it is the VAT. We can see that all physiological responses remained stable during 60-minutes running in athletes and non-athletes. However, there are some differences between athletes and non-athletes that must be considered. For example, athletes run in greater percentage of V·O2max and HRmax than non-athletes; therefore, we cannot use the same percentage of V·O2max and HRmax for different level of performance to intensity prescription. The athletes showed
higher RER and minute ventilation during 60-minutes running; it means that they used more carbohydrate than non-athletes, and on the other hand, non-athletes were able to consume more fat than athletes. This fact is important for nutritionists to manage the diets according to personal goals (e.g., lose fat, performance improvement).
Conclusion
It was possible to identify the steady state from ventilatory variables on the relative intensity of VAT, and this phenomenon occurred independently of the level of physical performance, and as expected, the EA group presented higher values than NA. The physical exercise performed in a steady state at VAT can be used as a strategy to prescribe race training both in high-performance athletes and non-athletes.
References
1. Seiler KS, Kjerland GO. Quantifying training intensity distribu-tion in elite endurance athletes: is there evidence for an optimal distribution? Scand J Med Sci Sports. 2006; 16(1): 49-56. 2. Lourenço T, Tessuti L, Martins L, Brenzikofer R, Macedo D.
Interpretação metabólica dos parâmetros ventilatórios obtidos du-rante um teste de esforço máximo e sua aplicabilidade no esporte. Rev Bras Cineantropom Desempenho Hum. 2007; 9(3): 303-310. 3. Pires FO, Lima-Silva AE, Kokubun E, Kiss MAPDM. Modelo
de equilíbrio dinâmico: breve revisão da sua origem, implicações e novas perspectivas. Rev Bra Educ Fis Esporte. 2011; 25(3): 547-55.
4. Azevedo PHSM, Garcia A, Duarte JMP, Rissato GM, Carrara VKP, Marson RA. Anaerobic Threshold and Bioenergetics: A didactic approach. J. Phys. Educ. 2009; 20(3): 453-464. 5. Balady GJ, Arena R, Sietsema K, Meyers J, Coke L, Fletcher
GF, et al. Clinician´s Guide to Cardiopulmonary Exercise Testing in Adults: A Scientific Statement From American Hearth Association. Circulation. 2010; 122(2): 191-225.
6. Beaver WLK, Wasserman K, Whipp BJ. New method for detect-ing anaerobic threshold by gas exchange. J Appl Physiol. 1986; 60(6): 2020-2027.
7. Rodrigues JAL, Perez AJ, Lunz W, Mill JG, Carletti L. Transição metabólica no teste progressivo de pessoas treinadas com mus-culação e corrida. Rev Bras Med Esporte. 2015; 21(4): 279-283. 8. Caiozzo VJ, Davis JA, Ellis JF, Azus JL, Vandagriff R, Prietto
CA, et al. A comparison of gas exchange indices used to detect the anaerobic threshold. J Appl Physiol. 1982; 53(5): 1184-1189. 9. Ribeiro JP, Hughes V, Fielding RA, Holden W, Evans W, Knuttgen
HG. Metabolic and ventilatory responses to steady state exercise relative to lactate thresholds. Eur J Appl Physiol. 1986; 55(2): 215-221.
10. Wasserman K, Hansen JE, Sue DY, Casaburi R, Whipp BJ. Prova de Esforço: Princípios e Interpretação. 3 Ed. Rio de Janeiro, Revinter, 2005.
12. Tanaka Kiyoji. Cardiorespiratory and lactate responses to a 1-hour submaximal running at the lactate threshold. Ann Physiol Anthropol. 1991; 10(3): 155-162.
13. Ascenção AA, Santos P, Magalhães J, Oliveira J, Maia J, Soares J. Concentrações sanguíneas de lactato durante uma carga constante a uma intensidade correspondente ao limiar aeróbio-anaeróbio em jovens atletas. Rev Paul Educ Fisi. 2001; 15(2): 186-194. 14. Beneke, Ralph. Methodological aspects of maximal lactate steady
state implications for performance testing. Eur J Appl Physiol. 2003; 89(1): 95-99.
15. McArdle WD, Katch FI, Katch VL. Fisiologia do exercício: energia, nutrição e desempenho humano. 7 Ed. Rio de Janeiro, Guanabara Koogan, 2011.
16. Powers SK & Howley ET. Fisiologia do exercício: teoria e apli-cação ao condicionamento e ao desempenho. 8 Ed. São Paulo, Manole, 2014.
17. Xu F & Rhodes EC. Oxygen uptake kinetics during exercise. Sports Med. 1999; 27(5): 313-327.
18. Whipp BJ, Wasserman, K. Oxygen uptake kinetics for various intensities of constant-load work. J Appl Physiol. 1972; 33(3): 351-356.
19. Londeree BR, Ames AS. Maximal steady state and state of condi-tioning. Eur J Appl Physiol Occup Physiol. 1975; 34(4): 269-278. 20. LaFontaine TP, Londeree BR, Spath WK. The maximal steady
state versus selected running events. Med Sci Sports Exerc 1981;13(3): 190-193.
21. Howley ET, Basset DR, Welch HG. Criteria for maximal oxygen uptake: Review and commentary. Med Sci Sports Exerc. 1995; 27(9): 1292-1301.
22. Billat V, Sirvent P, Lepretre PM, Koralzstein JP. Training effect on performance, substrate balance and blood lactate concentration at maximal lactate steady state in master endurance-runners. Eur J Appl Physiol. 2004; 447(6) 875-883.
23. Priest JW, Hagan RD. The effects of maximum steady state pace training on running performance. Br J Sports Med. 1987; 21(1): 18-21.
24. Haverty M, Kenney WL, Hodgson JL. Lactate and gas exchange responses to incremental and steady state running. Br J Sports Med. 1988; 22(2): 51-54.
25. Burgomaster KA, Howarth KR, Phillips SM, Racobowchuck M, Macdonald MJ, Mc Gee SL, et al. Similar metabolic adaptations during exercise after low volume sprint interval and traditional endurance training in humans. J Physiol. 2008; 586(1): 151-160.
26. Liang H, Ward WF. PGC1-α: A key regulator of energy metabo
-lism. Adv Physiol Edu. 2006; 30(4): 145-151.
27. Leti T, Mendelson M, Laplaud D, Flore P. Prediction of Maximal Lactate Steady State in runners with an incremental on the field. J Sports Sci. 2012; 30(6): 609-616.
28. Garber CE, Blissmer B, Deschenes MR, Franklin BA, Lamonte MJ, Lee IM, et al. Quantity and quality of exercise for developing and maintaining cardiorespiratory, musculoskeletal e neuronal fitness in apparently healthy adults: Guidance for prescribing exercise. Med Sci Sports Exerc. 2011; 43(7): 1334-1359. 29. Caldwell MD, Zauner CW. Oxygen uptake in well-trained
ath-letes at various points in a distance run. J Sports Med Physic Fit. 1978; 18(1): 19-23.
30. Lakens Daniel. Calculating and reporting effects size to facilitate cumulative science: a practical primer for t-tests and ANOVAs. Fr Psychol. 2013; 26(4): 1-12.
31. Fink WJ, Costill DL, Pollock ML. Submaximal and maximal working capacity of elite distance runners. Part II: muscle fiber composition and enzyme activities. Ann N Y Acad Sci 1977; 301: 323-327.
*Corresponding author
Victor Hugo Gasparini Neto
Rua Nara Leão,125 - CEP: 29164-125, Serra – Espírito Santo – Brazil Phone: +55-27- 99822-6989
E-mail: [email protected]
Manuscript received on September 15, 2017 Manuscript accepted on February 5, 2018