libia
Differential factors of a successful acquisition process in the beer
sector
Francisco dos Santos Pinho da Costa
200900253
Master Dissertation
Master in Finance
Supervisor:
Miguel Sousa, PhD
September, 30
th2016
Bibliographical Note
Francisco dos Santos Pinho da Costa holds a Bachelor in Economics by the Porto University School of Economics and Management.
Since 2012, he has been working at Unicer Bebidas (“Unicer”), in the Financial and Marketing departments. He has, since then, developed financial reporting, market research and brand management skills due to the functions performed.
He is currently pursuing a Master in Finance by the Porto University School of Economics.
ii
Acknowledgements
I am grateful for the comments and all the guidance provided by my supervisor, Professor Miguel Sousa.
I thank all the people that actively had a participation on this project.
I also want to thank all my friends TA, who gave me all the support I needed throughout this very demanding process. Without them, it would have been even more difficult. To my parents and brothers, for the constant support provided, I owe the biggest thank you note.
Abstract
This study intends to analyze and identify a common link among acquisitions of beer industry companies around the world. Therefore, the question the study intends to answer is: What is (are) the differential/successful factor(s) to watch out before engaging in a brewery-to-brewery acquisition process in order to guarantee a successful transaction? The study aims to contribute to a current hot topic on the beer industry, consolidation. A two-variable matrix will be used to identify / distinguish (ex-post) those successful acquisition from the unsuccessful ones and then, using univariate and multivariate analysis, try to find those quantitative and qualitative factors that are capable of predicting the successful acquisitions beforehand.
Key Words: Merger and Acquisition; Beer Industry; Differential Factors; Prediction Modeling
iv
Contents
1. Introduction ... 1
2. Literature Review ... 4
2.1 Merger & Acquisitions ... 4
2.1.1 Definitions ... 4
2.1.2 Classification ... 5
2.2 The Beer Sector ... 7
2.2.1 Concentration / Globalization ... 7
2.2.2 Drivers and Performance ... 8
2.2.3 Challenges and Barriers ... 10
2.3 How to measure M&A success ... 12
2.4 The search for potential M&A success factors ... 14
2.4.1 Possible methodology ... 14
2.4.2 Target Firms ... 15
2.4.3 Management characteristics ... 15
2.4.4 Cultural Dimensions ... 16
3. Methodology ... 17
3.1 Data and Sample ... 17
3.2 Model Design ... 20
3.2.1 T-test ... 24
3.2.2 Mann-Whitney-Wilcoxon test (U) ... 26
3.2.3 Multivariate analysis of variance (MANOVA) ... 28
3.2.4 Multiple Discriminant Analysis (MDA) ... 30
3.3 Results Discussion and Interpretation ... 34
4. Conclusion ... 37
4.2 Model Applicability ... 38
4.3 Limitations and Further research ... 40
5. References ... 41
vi
Table Contents
Table 1 - Classification of M&A ... 5
Table 2 - Sample Indicators ... 18
Table 3 - Group Data ... 19
Table 4 - Data Sample and T-Test and Mann-Whitney-Wilcoxon outputs ... 23
Table 5 - Pillai's Trace Output ... 29
Table 6 - MDA 1st Test Matrix ... 30
Table 7 - Potential sets of 4 variables for MDA ... 31
Table 8 - Standardized Canonical Discriminant Function Coefficient ... 32
Table 9 - Canonical Discriminant Function Coefficient ... 32
Table 10 - Function at Group Centroids ... 32
Table 11 - MDA Classification Results ... 33
Table 12 - MDA Reality vs Prediction ... 33
Table 13 - 59 countries simulation ... 38
Table 14 - Final Sample of Beer M&A Operations ... 47
Table 15 - 2 letter country code ... 50
Figure Contents Figure 1 - Mega Mergers Evolution (Own construction) ... 1
Figure 2 - Top5 Brewers (Roach, 2016) ... 2
Figure 3 - Beer M&A Operation Matrix ... 18
Figure 4 - Visual of Function at Group Centroids ... 32
Figure 5 - 1st Sample Split ... 48
Figure 6 - 2nd Sample Spilt ... 48
Figure 7 - MDA Model ... 49
Equation Contents Equation 1 - T-test Independent Samples ... 24
Equation 2 - Ranking MWW ... 26
Equation 3 - Pillai's Trace (MANOVA) ... 28
Equation 4 - Exercise's MDA Equation ... 32
1. Introduction
Merger and Acquisitions (M&A’s) among breweries have become a common trend on the global beer market and, therefore, a hot topic to the industry.
This trend, to a more centralized industry, followed by large companies possibly driven by the lack of opportunities to organic growth can be confirmed by recent events / statements, such as:
“(…) increasingly concentrated beer market has been the subject of continuous investigation by the EU commission (…)” (Economics Online, 2013);
“The brewery market today has evolved through mergers rather than through organic growth - with all top 10 companies the product of previous merger activity.” (NewsWire, 2013);
AB-InBev, the biggest company on the beer market, is a result of three different merges: Ahneuser-Busch, Ambev, Interbrew and Grupo Modelo; and is now trying to acquire the second biggest company – SAB Miller –, itself product of a previous merge (South African Breweries and Miller) (AB-Inbev, 2016) (Figure 1).
1 In this study, there’s also the professional pertinence for the student. Currently working on the national
and exporter leader of Portuguese beer market (Unicer Bebidas), it is a good opportunity to develop extra knowledge and put to use some of the acquired on his professional career.
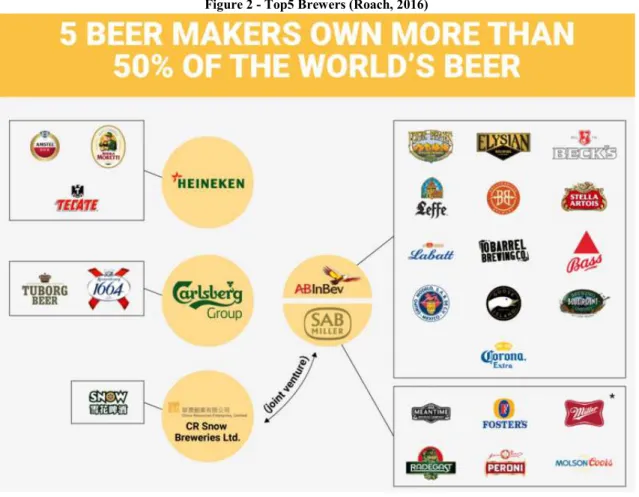
“In 2004, 10 brewers controlled 51% of the global beer market by volume. Ten years later, five beer makers — Anheuser-Busch InBev, SABMiller, Heineken, Carlsberg, and China Resources Enterprise — controlled about the same amount.” (Roach, 2016) (Figure 2).
Figure 2 - Top5 Brewers (Roach, 2016)
This study will explore a new approach, not used yet on the literature produced so far, regarding the industry.
The aim of the dissertation is to find the factor(s) that differentiate well-performing acquisitions from those that didn’t perform so well, in order to help breweries when they have to choose future partners.1
To answer to the presented question, a two-variable matrix will be used to identify / distinguish (ex-post) those successful acquisition from the unsuccessful ones and then, using an univariate and multivariate analysis, try to find those quantitative and qualitative factors that could have helped to identify the successful acquisitions ex-ante.
As outcome, the results of this dissertation will help both future buyer and acquired companies.
This study may also unearth significant correlations between variables that may be relevant to the industry analysis.
Beside this section, this report is structured as follows: in Section 2 is presented the literature review for this topic, focusing on M&A, the Beer Sector and M&A measures and factors to success. In Section 3 is presented the methodology, describing the process of sample construction, model testing and its results. Section 4 presents the conclusion of the paper.
2. Literature Review
M&A’s have been increasingly studied throughout the years, due to the significant worldwide trend and the benefits and hazards associated to it.
The M&A’s surrounding the beer industry have been a hot topic for the last few years, with a centralization trend of the market share, mainly regarding the top five companies. In this section, a review of the literature will be performed.
Firstly, the definitions and classifications of Merger & Acquisitions will be presented. Afterwards, a framework with studies regarding the sector and M&A is set, approaching concentration, drivers, performance and challenges. Lastly, studies regarding the methodology, measures and potential factors to success are presented.
2.1 Merger & Acquisitions 2.1.1 Definitions
M&A may be related to different type of transactions: formation of companies, corporate succession, management buy-out (in), IPO’s, restructuring, purchase (sale) of undertakings, alliances, cooperation, consolidations, joint ventures, etc. (Hoang et al., 2008; Picot, 2002).
It is important not to use such a broader definition for M&A, since it can generate confusion, due to its range of transaction types; it can refer to, for example, pure merger or strategic alliance (Nakamura, 2005).
Therefore, there’s a need to provide a separate definition (European Central Bank, 2000): Merger: two or more companies joining together to create a new entity or to form
a holding company; it can be classified as horizontal, vertical or conglomerate. Acquisition: A company buying shares (or purchasing the assets) in another
company to achieve a managerial influence; it can be classified as friendly or hostile.
Regarding mergers, there are two general differences: merger of equals (Cheng, 2012) or merger by absorption (Yang, 2005). A merger of equals refers to two companies that are equal in size and choose to bring the two together. Merger by absorption is a combination of two companies where one corporation is completely absorbed by another corporation, with the surviving corporation assuming all the rights, privileges, and liabilities of the merged corporation.
On the other hand, acquisitions may have a similar split (Chen and Findlay, 2003): asset acquisition or share acquisition. Asset acquisition refers to the purchase of (all or part) the target’s assets and it (the target) remains as a legal entity after the process. A share acquisition is characterized by the purchase of target’s stock to obtain influence over the management. The “influence” varies according to the amount acquired: there’s the possibility to have full – takeover – (acquisition of 100% of issued shares), majority (99% to 50% of issued shares) or minority (less than 50% of issued shares) control.
Although they have different definitions and purposes, the study is focused on the characteristic they have in common: combination of efforts of two companies.
2.1.2 Classification
As referred on the previous topic, M&A definitions can have more than one classification: horizontal, vertical or conglomerate (mergers), hostile or friendly (acquisition) and domestic or cross-border (geographical) (Table 1).
Table 1 - Classification of M&A
Merger Acquisition Geographical
Horizontal Friendly Domestic Vertical Hostile Cross-Border Conglomerate
2 A major example of such classification is the imminent merger of the two biggest companies on the market
– AB Inbev and SAB Miller – predicted to happen until the end of 2016.
Horizontal merger may be seen as the consolidation of companies that compete on the same industry, offering the same product (or service). Horizontal mergers usually occur in industries where competition is higher; the synergies arising from these deals and market share gains are significant drivers for players (Gambaro, 2005; Tremblay and Tremblay, 1988). This classification of M&A is the most important to this report, since it regards the merger or acquisition on the same industry2. One characterized by intensive
competition for market share.
Vertical merger (Klein and Lien, 2009; Gambaro, 2005) can be defined as the merger of two companies that produce different products (or services) for a common finished product. These companies are in different stages of the product or service supply chain, which allows the creation of synergies along the process.
Conglomerate is a more radical M&A process; this classification refers to the consolidation of unrelated businesses. Conglomerates are usually associated to a strategic vision, diversifying risk (Klein and Lien, 2009).
Friendly acquisition refers to a process where the target’s management board agrees with the transaction. This way, there’s no fight against the acquisition by the target company and it approves publicly the buyout terms. Therefore, hostile acquisition is the opposite: it is a transaction in which the target’s management board fights against and doesn’t approve any terms (Chen and Findlay, 2003; Schwert, 2000).
Regarding domestic or cross-border, as the name states, the difference is between the economy-countries of each company. If the transaction is made between companies from the same economy-country, it is classified as domestic; if not, it is classified as cross-border.
2.2 The Beer Sector
2.2.1 Concentration / Globalization
As referred previously, the industry is going through a period of concentration and eventually will become a centralized industry with few microbreweries left to operate besides the big players (Roach, 2016).
Simon and Ma Lebron (2009) focused on what were the threats of an eventual duopoly situation (via M&A’s) and what could it do to the industry. The authors found that 80% of American beer market is controlled by non-American. It is also important to notice that the last mergers of the breweries that now are market leaders, AB Inbev and MillerCoors, were closed very quickly in five and eight months, respectively.
Iwasaki et al. (2008) using a game theory set up, focused on the attrition created by the brewing war on the US market, due to its increasing concentration associated with low profits. The authors tried to measure the likelihood of war and the importance of structure and conduct to industry performance. Besides the impacts of advertising on the industry, the study concludes that concentration adjusts more quickly as the difference between long-run price cost margin increases: as the war of attrition intensified the current profits lowered, but as minimum scales efficiency and advertising increased the long-run profits increased as well.
Regarding the impacts of the monopoly trend that the industry is going through, Ascher (2012) considers the eventual merge of the two biggest companies, analyzing the impacts that a monopolized world could have on prices, distribution, antitrust measures. He suggests that the authorities should avoid the “mega-deal” in order to prosper a more equal competition among players. The statement results as a consequence of a fact: prices, revenues and profit dividends increased substantially since the big consolidations in 2008 (Anheuser-Busch and Inbev formed the world leader on beer industry, AB Inbev). Regarding emerging markets expansion, Hansen et al. (2010) present action strategies, using Carlsberg examples of Russia and China operations; these actions were the result between group’s long-term goals and geographical performance focus.
Before the operations referred previously, Carlsberg was at risk of becoming a secondary player on the beer market stage; until 2007, when Carlsberg accounted a total of 61% of its revenues on the European market and engaged on a non-European M&A strategy. As a need to diversify risk and to ensure a stable growth and long term prosper, Carlsberg pointed at two of the biggest markets by acquisition (Russia) and partnerships (China). Both operations were extremely time and money consuming, since they weren’t successful at first attempts.
The conclusion of the case study is that Carlsberg wouldn’t be in the position it is now (5th largest brewery in the world as 2010), if it didn’t entered the globalization wave,
specially directed to emerging markets.
Meyer and Tran (2006) also approach emerging market penetration via M&A operations. The study approaches the entrance of Carlsberg in markets like Poland, Lithuania or Vietnam, in order to conclude that to penetrate a market or acquire a player of said market, one must adapt and balance its portfolio (this will allow the expansion of the market by increasing the local power brand base and introduce the global/non-native brand) and adjust to the local industry, consumer and institutional behavior.
2.2.2 Drivers and Performance
Tremblay and Tremblay (1988) studied the motives for horizontal mergers through the estimation of a logit model for the US brewing industry. The study concludes that failing firms avoid bankruptcy by selling to successful ones, i.e., mergers are an efficient way of transferring assets from failing firms, and that acquisitions are not directly related to scale economies or market power.
This study must be analyzed considering the year when it was published, i.e., the concentration period on the industry became more intense from the 1990’s forward, what may reduce the relation of M&A on the industry and market power. Nevertheless, it is valid and presents an interesting point of view regarding M&A on the sector.
Jain (1995) also studied effects of globalization on U.S. beer industry and the adaptation of the national brands to it. The U.S. national brands adopted a strategic decision of acquiring (in some cases, making deals) in order to secure market share.
On the other hand, in order to grow, the U.S. breweries must make deals abroad due to the internal bottleneck to growth – top three breweries (Anheuser-Busch, Molson and Coors) control (in 1995) approximately 80% of the U.S. brewing market.
Mehta and Schiereck (2012) analyzed the short-term wealth effects on horizontal mergers and acquisitions on beer market (sample of 69 takeovers between the years of 1998 and 2000) and found positive returns after the announcement of the transaction. The authors also found a positive gain on cross-border operations with emerging market (mainly Latin America) – an indicator that the market values diversification by the big breweries – and domestic acquisitions. A negative effect is identified in leading brewing groups that miss on a potential M&A opportunity.
Finally, the author also identify different drivers for success: transaction size and buyer’s size, in regard to size advantages in the market, and target public status – brewers pay higher premiums for targets that are publicly listed.
Madsen et al. (2012) present doubts towards the over performance of M&A taken by the largest groups. In order to study properly the referred performance, the authors developed a hypothesis that consisted on the comparison between the four top breweries performance and the one of a control group (top 20 without top 4). To do so, they applied an OLS Model to the collected data. The conclusions of such study do not suggest a significantly better performance of the top four breweries compared to the control group, what suggests that scale opportunities disappear in a capacity that is long time gone for top breweries; another conclusion drawn is that “conduct determines structure”.
The authors focus mainly in turnover growth (splitting organic from acquired growth between the four top breweries) and the EBIT Margin change.
2.2.3 Challenges and Barriers
There may be evidence of a fight back towards the consolidation trend: disperse industrial / urban areas within a region, smaller segments and niches (e.g. Craft Segment), legislation against market control, etc. Although the study is focused on beer industry consolidation, it is important to know that centralization has its obstacles and problems as any other process.
Kolowich (2014) introduces the Craft segment as one with independent personality that has been securing a double digits growth rate for eight straight years. Craft segment is explored by over two thousand breweries / microbreweries that have become more available in the market than ever, answering to the consumer need for variety at hand. The continuously increasing number of microbreweries goes against the consolidation trend on beer industry, since they are known to be fiercely independent - in a hypothetical bigger scale it could pose as a threat to big companies’ strategy of growth through mergers and acquisitions. But, in some cases, it’s already possible to see craft breweries being acquired by big groups.
Heracleous (2001) studied the difficulty of entering the Chinese beer market via M&A’s on the 90’s, due to the innumerous successful local breweries and lack of adaptation of foreigner companies. The low price practiced by Chinese companies was unbearable, the loyalty towards local brands, distribution systems and capability of awareness conversion in purchasing by the global companies entering the Chinese market was a big problem. The study analyzed M&A trend in China, by Chinese companies, like Tsingtao that became market leader by making several acquisitions (approximately 30 by 2001) and beating its direct competitor Yanjing. The author suggests that companies should proceed like SAB Miller did in the 90’s: with a great knowledge of Guanxi (creating long-term relations with implication of reciprocal favors): form partnerships which may help to avoid problems and generate growth.
Although, today, fifteen years later, the local breweries still exist, the penetration on the market is much higher (e.g. Carlsberg – as presented previously –, SAB Miller, AB Inbev and Heineken are present in the market), mainly due to partial acquisition.
Minton (2012), backed by the Competitive Enterprise Institute, clears how the consolidation can be blocked: terminate with the obligatory three tier model - allow the manufacturer to contact with the final consumer if needed. With Craft beers already occupying 5% of the market on 2012 (more than 10% by 2015), it is proven that they are a force to be reckoned with: “Ask anyone who enjoys a nice brew if we are currently living under a beer monopoly and most would laugh off the question as silly”.
It is important to refer that the analyst vs consumer perspective is quite different in the industry. Although there’s plenty of choice, there are still a small number of large groups owning the global market.
3 The national and exporter leader of Portuguese beer market. Company who’s has been part of M&A’s
processes and is partly owned by Carlsberg since 2000.
2.3 How to measure M&A success
Time as relevant factor to integration
Knilans (2009) analyzed the best practices for successful integrations on M&A and defends, mainly, that it is necessary to have dedication and skill to have the pre-defined established vision in place. The author also proposed key steps to successful integration, which he believed should focus on, among others, culture, results and speed – sense of urgency (without rushing) that must accompany the integration.
Nahass et al. (2008), on a PwC survey report, identify seven fundamental tenets to successful integration on M&A. The first and main focus of their analysis, is to accelerate the transition, since, according to the study (surveys to audited companies), the speed of integration improves M&A success.
Hoang et al. (2008) engage on a three step empirical study (interviews, online surveys and case studies) in order to find the importance of each of ten selected critical success factors and the authors “findings strongly indicate that these factors have a positive impact: complete and clear objectives; time management”.
Additionally during the execution of this dissertation, several interviews were carried out with four persons directly related with the M&A’s process within Unicer Bebidas3: the
Chief Marketing Officer, the Business Development Director, a Strategic Planning Manager and a Business Development Manager (former M&A consultant). All state the importance of acquisition process duration in a successful acquisition process.
Revenue as driver
Sardasanam (2003) explains the various stages of an acquisition process. The author focus on precautions a manager/company/group must have when engaging on acquisition processes – process is an important key word to the topic, since an acquisition should be seen as such and not as a transaction. For example, acquisition and post-acquisition integration mustn’t be seen as compartmentalized activities. The author points as an important value driver in M&A’s the revenue enhancement and generation of new sources or capabilities that lead to revenue growth.
Rahman and Lambkin (2015) study the value creation (or destruction) in mergers and acquisitions. The author constructs a synergies ratio according to the sales revenue and fixed costs (average of three-year period pre-operation vs three-year period post-operation). This acquisition value driver is also very important in the beer market, since the synergies are market driven, other than result; therefore is more important to analyze the increase in sales with, at least, maintenance of the fixed costs, other than analyzing Net Income (usually, M&A processes have debt associated, what may have negative impacts on results performance on medium/short term).
The authors suggest that horizontal M&A’s are motivated by the desire to achieve revenue growth through market expansion or by increasing its portfolio – revenue is identified as a driver for engaging in M&A operations, so it must be considered as a valuable measure for performance.
Also Haynes and Thompson (2005) and Mueller (1985) explore the post-acquisition performance and market share evolution through sales and revenues. Haynes and Thompson (2005) studying the post-acquisition performance in UK Financial Mutual Funds, showed that it is generally positive as the acquired firms perform better, increasing sales and obtaining a higher piece of market share on the year following the acquisition. Mueller (1985) analyzes the consistent relative loss of market share on acquired companies, defending that the reduction on sales affect the company as a whole (impacting results and, therefore, the shareholders).
2.4 The search for potential M&A success factors 2.4.1 Possible methodology
Before presenting the potential M&A success factors, it is important to address the tests and methodologies that were used previously in the M&A literature.
Arcot et al. (2014) presents a valuable add on regarding the formulation of a sample aligned and conditioned by the pre-defined variables set to the future analysis, through a hierarchical definition of filters. The authors hierarchically filter data to construct a sample and subject it to a Heckman’s regression model (selection model), in order to determine the likelihood of a set of two stages parameters. This study allows the authors to define a trend regarding buyers and sellers under pressure on secondary buyouts. Mahesh and Prasad (2012) used a T-test to verify differences between pre and post M&A performances. The authors analyzed the financial performance efficiency of Indian Airline Companies during the post-acquisition period and concluded that there’s no financial efficiency improvement with the operations at study.
Hendriks (2013) used a Mann-Whitney-Wilcoxon test to test and guarantee that all legal origin families of the study were significantly different from each other. The author focus its study on the effect of: (1) investor protection on both domestic and cross-border bidder and returns of an acquisition; (2) investor protection mix between the countries of both bidder and target and returns of an acquisition. Results show that acquirers in countries with strong investor protection gain more with domestic acquisitions. On the other hand, the return is higher for companies in countries with weak investor protection acquiring companies in countries with a strong one.
Lee et al. (2011), building a linear compositor of three variables (perceived quality, brand association and brand loyalty), applied a multivariate analysis of variance (MANOVA) to better test the differences between groups (acquired and acquirer brand). The author studied the relationship between the variance of two brand images and dimensions of brand equity after M&A. With this study, the authors were able to conclude that the greater the perceived differences between acquirer and acquired brands, the more the brand equity of the acquirer will increase.
Stevens (1973) developed a multiple discriminant model, which lead to a four ratios derived discriminant function, capable to predict if a company has the characteristics to be acquired with a 70% classification accuracy. The author analyzed the financial characteristics of acquired firms prior to acquisition in order to understand the difference towards non-acquired ones. The findings support that financial characteristics alone are sufficient to separate acquired firms from others.
2.4.2 Target Firms
Servaes (1991) established a relation between takeover gains and the q-ratios of targets and bidders for a period of fifteen years (1972-1987). Based on other studies of Tobin’s q relation with gains that resulted from a M&A operation (Lang et al., 1989), the author develops a model supporting that a transaction in which bidders with good performances acquire targets with bad ones (q-ratio) tend to have higher gains.
Therefore, when an acquired company with negative past results is absorbed by a group, but remains a separate identity, its post-acquisition performance should be positive. Xu (2014) studied how M&A can affect the aggregate growth rate of the economy using an endogenous growth model. In the model used in the study, it predicts, among other things, that target firms are younger than acquiring firms.
2.4.3 Management characteristics
Human characteristics can affect the performance of a M&A process. For instance, Lobão (2013) studied how confidence, competitiveness and commitment influence decision making. His conclusion point that results can have positive or negative results regarding these human characteristics.
These attributes are intrinsic and can be measured by human traits such as age, gender or culture.
Malmendier and Tate (2006), Ferris et al. (2013) and Kaplan and Sorensen (2016) also studied the human behavior focusing on the figure of the CEO.
The first authors focused on overconfidence CEO’s to explain merger decisions. The results, among other conclusions, suggest that it is more likely in 65% of the times for overconfident CEO’s to engage on M&A operations than non-overconfident.
The second authors focused on the influence that overconfidence has on M&A activity and concluded that: i) overconfidence CEO’s are spread demographically around the world and the characteristics to point them are: overconfidence CEO’s tend to lead firms headquartered in Christian countries and countries with a high individualism level; ii) CEO’s that are not overconfident, tend to operate in countries with cultures that have long-term orientation.
Finally, Kaplan and Sorensen (2016) studied CEO’s profile, defining 4 factors to identify them: talent (positive factor), execution (negative factor), charisma (negative factor) and strategic / creative (positive factor). CEO’s tend to be the individuals that score higher on all four factors, showing that the figure of the CEO tends to be more skilled than others – what may be a positive factor when engaging on M&A activity.
2.4.4 Cultural Dimensions
The attributes considered above to estimate overconfidence are aligned with the studies of Hofstede (1980, 2001) regarding culture consequences. Hofstede splits the cultural analysis in six variables: Power Distance Index (how society handles inequality), Individualism (self-image is defined in terms of “I” or “we”), Masculinity (“Tough vs Tender” culture), Uncertainty Avoidance Level (Rigid Codes vs Relaxed Society), Long-Term Orientation (Normative vs Pragmatic) and Indulgence (Level of enjoyment of life). Hofstede boosted other studies, such as GLOBE project, by House et al. (2004). It allows one to know how cultural values are related to organizational practices, conceptions of leadership, economic competitiveness of societies, and its member’s human condition.
3. Methodology
In order to answer the questions raised by this study, a model that takes into account the relation between acquisition process time length and the good performance of an acquired brewery will be presented.
Firstly, our sample will be split into two groups, based on the time length of the acquisition process and the growth of revenue: a good performing and a bad performing sub-samples.
3.1 Data and Sample
The main database used for data collection was Zephyr (Bureau Van Dijk database). First, we selected all M&A operations between two breweries occurred between 2003 and 2013.
Then, an ad hoc free search was made, in order to assure that all the viable operations to the analysis were part of the sample.
As the analysis is focused on acquired companies’ performance, from all the deals only operations in which the buyer acquired at least 50% of the target were kept.
After the sample was collect, we have used other Bureau Van Dijk databases (Amadeus and Orbis) and the official websites of each company to gather all data necessary to our study. Reuters and Bloomberg websites were valuable, since validation was necessary. In order to be useful for further analysis, only the deals for which was possible to: i) have access to the acquired companies’ operating revenue for the years n-1 and n+2 (as the revenue growth will be used as a proxy to obtain market share as in Rahman and Lambkin (2015), Haynes and Thompson (2005), Sardasanam (2003) and Mueller (1985)); ii) to know with certainty the rumor and completion dates of the operation (as the time length of the acquisition process is an extremely relevant variable to measure the success of the M&A operation process (Hoang et al., 2008; Knilans, 2009; Nahass et al., 2008)).
With all this constrains the final sample is constituted by 29 M&A operations between breweries.
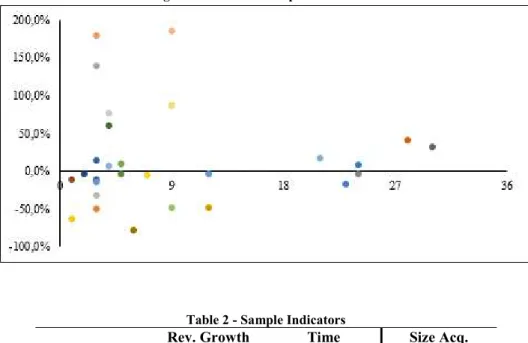
With the information needed to calculate the revenue growth and the acquisition time length data of the sample, it was possible to display the acquired companies’ information visually on a matrix (Y – revenue growth; X – process time length) (Figure 3) and the respective indicators in Table 2.
Figure 3 - Beer M&A Operation Matrix
Table 2 - Sample Indicators
Rev. Growth
(%) (months) Time (€ million) Size Acq.
Average 18.0% 9 194
Median -4.4% 5 41
Maximum 184.1% 30 1 582
Minimum -79.0% 1 1
Acquisition process length is an important variable to a successful outcome (Hoang et al., 2008; Knilans, 2009; Nahass et al., 2008), therefore, the starting point was to use the average duration displayed on Table 2 (nine months) to split the sample on the X axis. The split was done accordingly:
Below nine months: G(ood) Group; Above nine months: B(ad) Group;
The same applies to the Revenue Growth: 18.0% growth is the average of acquired companies displayed along the Y axis. However, due to the significant gap4 between
minimum revenue growth for the G(ood) Group (59.5%) and revenue growth average (18%), it seemed correct to increase the threshold to 50%5. To resume, the groups had the
following limits:
G(ood) Group:acquired companies that had an after acquisition performance that guaranteed a revenue growth above 50% and an acquisition process with a time length below or equal to average (X > 50% ˄ Y ≤ nine months);
o Total of seven operations6
B(ad) Group:acquired companies that had an after acquisition underperformance that guaranteed a revenue growth below 50% and an acquisition process with a time length above or equal to average (X < 50% ˄ Y ≥ nine months);
o Total of nine operations7
N(eutral) Group: acquired companies that had an after acquisition performance that guaranteed a revenue growth below 50% and an acquisition process with a time length below or equal to average (X < 50% ˄ Y ≤ nine months), or acquired companies that had an after acquisition performance that guaranteed a revenue growth above 50% and an acquisition process with a time length above or equal to average (X > 50% ˄ Y ≥ nine months) – this group was excluded from the analysis;
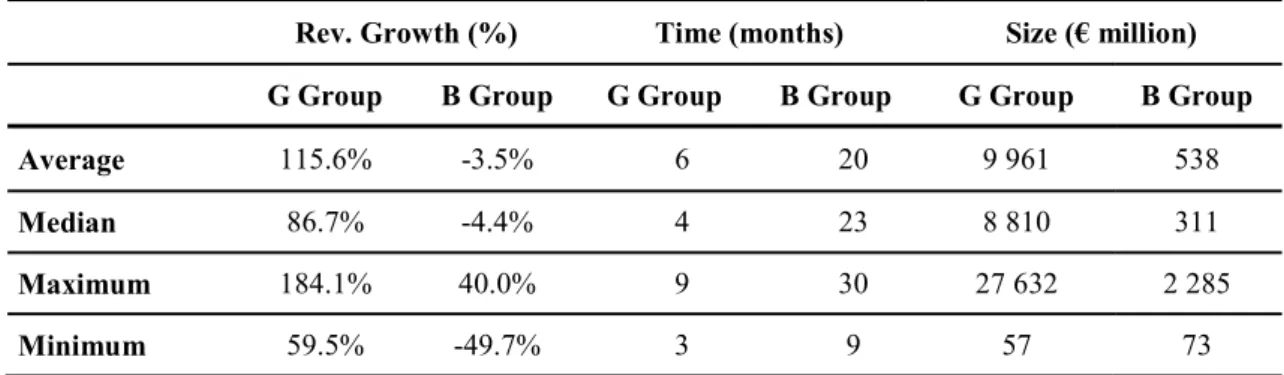
The sixteen operations sample split data, according to the limits5, is presented in Table 3:
Table 3 - Group Data
Rev. Growth (%) Time (months) Size (€ million) G Group B Group G Group B Group G Group B Group
Average 115.6% -3.5% 6 20 9 961 538
Median 86.7% -4.4% 4 23 8 810 311
Maximum 184.1% 40.0% 9 30 27 632 2 285
3.2 Model Design
In this sub-section, the stages of the model developed to determine the differential factors are presented. Initially, the independent variables that will be put to test are displayed, then a series of tests are taken, in order to validate (T-test, Mann-Whitney-Wilcoxon test and MANOVA) and determine prediction capability (Multiple Discriminant test) of the data.
Variables
After the construction and definition of our sample and sub-samples (sixteen operations splitted in two groups), the focus relays on the independent variables, in order to find differential factors that explain the study’s dependent variables (revenue growth and process time length).
The independent variables that may be critical to success to a M&A transaction (measured by the process duration and the post-acquisition performance of the acquired company), are:
o Administration age as suggested by Lobão (2013);
o Administration gender (% of men) as suggested by Lobão (2013);
o Cultural Dimensions (unit: 0 up to 99) as suggested by Hofstede (1980, 2001):
Power Distance Index – the degree to which the less powerful members of a society accept and expect that power is distributed unequally;
Individualism – preference for a loosely-knit social framework in which individuals are expected to take care of only themselves and their immediate families;
Masculinity – represents a preference in society for achievement, heroism, assertiveness and material rewards for success;
Uncertainty Avoidance index – degree to which the members of a society feel uncomfortable with uncertainty and ambiguity; Long Term Orientation – this dimension is related to as "(short
Indulgence – stands for a society that allows relatively free gratification of basic and natural human drives related to enjoying life and having fun;
o Company age (buyer and acquired company) as suggested by Xu (2014); o Acquired Country Gender (% of men) (CIA, 2014):
As according to Berman (2013) “Looking at the numbers, men tend to drink more alcohol than women”;
o Acquired Country’s Male age distribution (% of men aged between 15 and 25) (CIA, 2014):
Once again, according to Berman (2013): “Young Men Drink the Most”;
o Country’s beer consumption per capita (liters):
Diageo (2013) defends that countries with low per capita beer consumption have room to grow, mainly in Africa, where they can, in the future, achieve the levels of some European countries; o GLOBE Project (as cultural dimensions) (unit: 1 as “greatly
non-assertive” up to 7 as “greatly non-assertive”) as House et al. (2004) suggested: Assertiveness – degree to which individuals are assertive, confrontational, and aggressive in their relationships with others; Institutional Collectivism – degree to which organizational and
societal institutional practices encourage and reward collective distribution of resources and collective action;
In-Group Collectivism – degree to which individuals express pride, loyalty, and cohesiveness in their organizations or families; Future Orientation – degree to which a collectivity encourages and
rewards behaviors such as planning and delaying gratification; Gender Egalitarianism – degree to which a collective minimizes
gender inequality;
Human Orientation – degree to which a society encourages individuals for being altruistic, friendly, generous, etc. to others;
Performance Orientation – reflects the extent to which a community encourages and rewards innovation, high standards, excellence, and performance improvement;
Power Distance – degree to which the less powerful members of a society accept and expect that power is distributed unequally; Uncertainty Avoidance – extent to which a society relies on social
norms or rules to alleviate the unpredictability of future events; o Buyer and acquired sizes (€ million) as suggested by Mehta and Schiereck
(2012);
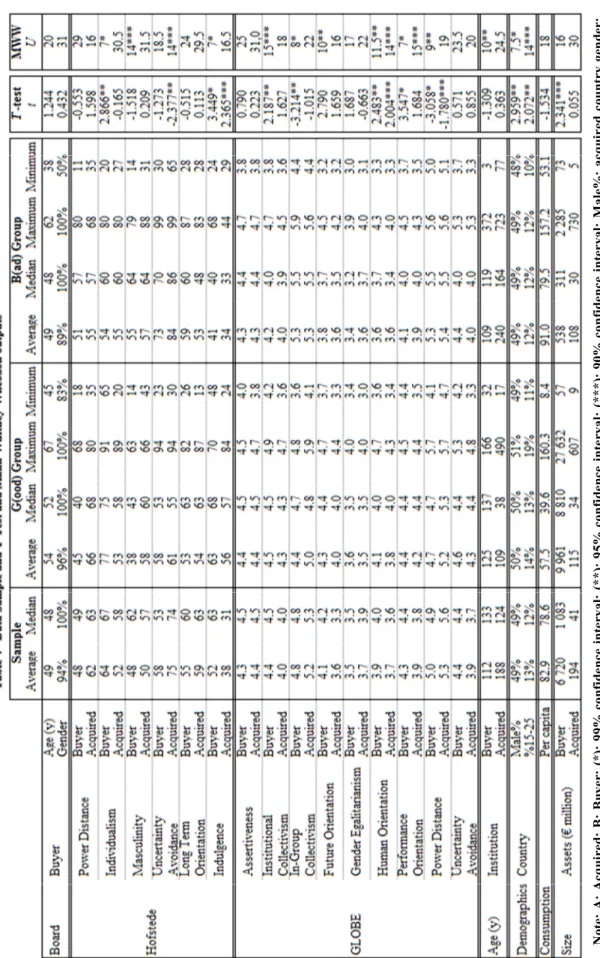
Table 4 presents the main descriptive statistics of all independent variables, besides the tests, and it’s possible to spot some differences between groups. In this table we can verify that there are variables that are intuitively different from one group to the other such as Acquired Country Gender, since G(ood) Group has a minimum percentage that is equal to the maximum of B(ad) Group. Other variable that is in an almost similar situation is GLOBE’s Performance Orientation (Buyer), since there’s only a 0.1 difference between maximum and minimum between the groups, G(ood) and B(ad) Group respectively. The table also indicates that Hofstede’s Individualism (Buyer) for G(ood) Group has a minimum value that is over the average of the sample, what means that this group may generally have higher values than the others.
The GLOBE’s In-Group Collectivism (Buyer) sets a maximum for the G(ood) Group that is equal to the samples’ average, what means that this group will generally have lower values than the others.
With this quick analysis it is possible to anticipate some outputs of the validation tests.
Table 4 - Data Sample and T-Test and Mann-Whitney-Wilcoxon outputs No te : A : A cq ui re d; B : B uy er ; ( *) : 9 9% c on fid en ce in te rv al ; ( ** ): 95 % c on fid en ce in te rv al ; ( ** *) : 9 0% c on fid en ce in te rv al ; M al e% : a cq ui re d co un tr y ge nd er ; 15 -2 5% : a cq ui re d co un tr y’ s m al e a ge d ist rib ut io n; T -te st: o nl y t r es ul ts w ith d iff er en ce s t ha t a re st at ist ic al ly si gn ifi ca nt a re p re se nt ed ; M W W = M an n-W hi tn ey -W ilc ox on te st: o nl y U re su lts w ith d iff er en ce s t ha t a re st at ist ica lly si gn ifi ca nt a re p re se nt ed .
3.2.1 T-test
T-test is a statistic hypothesis test used to determine if two sets of data are significantly different from each other. In this case we compare G(ood) Group and B(ad) Group for each variable. According to Kim (2015), T-tests are usually used in cases where the experimental subjects are divided into two independent groups. The t statistic test used to approach the presented data is the Welch’s T-test, which is a test for two population that have unequal sizes (seven (G) vs nine (B)) and, therefore, must be estimated separately. The t statistic to test whether the population means are different is calculated as presented in Equation 1.
Equation 1 - T-test Independent Samples
= −
+
Here represents the averages of each independent variable regarding each group. The other variables are: , the unbiased estimator of the variance of the two samples, and , the number of participants in the group.
The T-test outputs are used to analyze whether the averages of each group are significantly different from one another, regarding a previously defined set of variables. From the 39 independent variables proposed, 14 of them are on average statistically significant different between groups, in other words, it means that there are 14 individual variables in which the averages of each group have differences that are statistically significant.
All variables (and respective tests) that are statistically different between both groups are presented on table 4 and, for example, the results suggest that the GLOBE’s Institutional Collectivism index for buyers or the GLOBE’s Human Orientation index for acquired ones are significantly higher for operations in which the acquired company performed better (G Group).
With a confidence level of 99% we are able to observe three independent variables: The Hofstede’s Indulgence index (Buyer) of successful acquisitions is on average
equal to 63, while the same index for unsuccessful acquisitions is just 41;
The GLOBE’s Performance Orientation (Buyer) of successful acquisitions is on average equal to 4.4, while the same index for unsuccessful acquisitions is 4.1; The GLOBE’s Power Distance index (Buyer) of successful acquisitions is on
average equal to 4.7, while the same index for unsuccessful acquisitions is 5.3; With a confidence level of 95% we are able to observe seven independent variables:
The Hofstede’s Individualism index (Buyer) of successful acquisitions is on average equal to 77, while the same index for unsuccessful acquisitions is just 54; The Hofstede’s Uncertainty Avoidance index (Acquired) of successful acquisitions is on average equal to 61, while for unsuccessful acquisitions is 84; The GLOBE’s Institutional Collectivism index (Buyer) of successful acquisitions
is on average equal to 4.5, while for unsuccessful acquisitions is 4.2;
The GLOBE’s In-Group Collectivism index (Buyer) of successful acquisitions is on average equal to 4.4, while for unsuccessful acquisitions is 5.3;
The GLOBE’s Human Orientation index (Buyer) of successful acquisitions is on average equal to 4.1, while for unsuccessful acquisitions is 3.6;
The percentage of men on acquired countries of successful acquisitions is on average 50%, while for unsuccessful acquisitions is 49%;
The percentage of men between 15 and 25 years old in acquired countries of successful acquisitions is on average 14%, while for unsuccessful ones is 12%; With a confidence level of 90% we are able to observe seven independent variables:
The Hofstede’s Indulgence index (Acquired) of successful acquisitions is on average equal to 56, while the same index for unsuccessful acquisitions is just 34; The GLOBE’s Human Orientation index (Acquired) of successful acquisitions is
on average equal to 3.8, while for unsuccessful acquisitions is 3.6;
The GLOBE’s Power Distance index (Acquired) of successful acquisitions is on average equal to 5.2, while for unsuccessful acquisitions is 5.4;
3.2.2 Mann-Whitney-Wilcoxon test (U)
Mann-Whitney-Wilcoxon Test (MWW, Wilcoxon Ranked Test or Wilcoxon-Man-Whitney Test) is a nonparametric test of the null hypothesis that two samples come from the same population against the opposite alternative.
The objective is to test whether there is significant difference between the underlying distributions for each variable, regarding different independent samples.
Although it is a distribution comparison test, some authors defend it is a median comparison one (Simonovic et al. (2016)).
In order to calculate statistically U, it is attributed the values to each sample to build a ranking according to Equation 2.
Equation 2 - Ranking MWW
= + ( + 1)2 −
= + ( + 1)2 −
The test statistic for the Mann-Whitney-Wilcoxon test is denoted as U and is the smaller of UG and UB. If the value is within the Table of critical values’ parameters for U, the
statistical significance exists and the two samples are not equal (the process was conducted by a SPSS analysis, not demanding manual search through the table of critical values for U). The determination of the statistical significance is given by the Exact Sig (2 Tailled), according the significance level.
The Mann-Whitney-Wilcoxon test developed presents a total of 15 variables that have a difference that is statistically significant regarding the distributions (medians, according to other authors) of each group. Although the number of variables with statistical significance are similar, some of them are different from the ones presented on the T-test. The test presented on Table 4 suggest, for example, that the distributions for the male population of the country of the acquired company or the GLOBE’s In-Group Collectivism index for buyers are significantly different for each group of operations. Regarding confidence levels, the output is divided in three groups: 99%, 95% and 90%.
With a confidence level of 99% we are able to observe five independent variables: The Hofstede’s Individualism index (Buyer) of successful acquisitions presents a
median of 75, while the same index for unsuccessful acquisitions is just 60; The Hofstede’s Indulgence index (Buyer) of successful acquisitions presents a
median of 68, while the same index for unsuccessful acquisitions is just 40; The GLOBE’s In-Group Collectivism index (Buyer) of successful acquisitions
presents a median of 4.7, while the same index for unsuccessful ones is 5.5; The GLOBE’s Performance Orientation index (Buyer) of successful acquisitions
presents a median of 4.4, while the same index for unsuccessful ones is 4.0; The median percentage of men (Acquired) of successful acquisition is 1pp higher; With a confidence level of 95% we are able to observe four independent variables:
The GLOBE’s Future Orientation index (Buyer) of successful acquisitions presents a median of 4.4, while the same index for unsuccessful ones is 3.7; The GLOBE’s Human Orientation index (Buyer) of successful acquisitions
presents a median of 4.0, while the same index for unsuccessful ones is 3.7; The GLOBE’s Power Distance index (Buyer) of successful acquisitions presents
a median of 4.7, while the same index for unsuccessful ones is 5.5;
The median company’s age (Buyer) of successful acquisition is 18 years higher; With a confidence level of 90% we are able to observe six independent variables:
The Hofstede’s Masculinity index (Buyer) of successful acquisitions presents a median of 43, while the same index for unsuccessful ones is 64;
The Hofstede’s Uncertainty Avoidance index (Acquired) of successful acquisitions presents a median of 55, while for unsuccessful ones is 86;
The GLOBE’s Institutional Collectivism index (Buyer) of successful acquisitions presents a median of 4.5, while the same index for unsuccessful ones is 4.0; The GLOBE’s Human Orientation index (Acquired) of successful acquisitions
presents a median of 4.0, while for unsuccessful ones is 3.4;
The GLOBE’s Performance Orientation index (Acquired) of successful acquisitions presents a median of 4.4, while for unsuccessful ones is 4.0;
3.2.3 Multivariate analysis of variance (MANOVA)
Multivariate analysis of variance (MANOVA) is a procedure for comparing means. It tests the statistical significance of means difference, using the covariance between independent variables.
According to Field (2013), the multivariate analysis of variance (MANOVA) gathers all variables (outcomes) in one linear compositor and compares each group (B Group against G Group) in that same linear component. It is considered to be one of the best ways to condense information if there are several outcomes.
In resume, as presented by Carey (1998), the purpose of the MANOVA is to test whether the vectors of means for the two group are sampled from the same sampling distribution. MANOVA has a total of four tests as possibilities to measure the significance of the difference between groups: Pillai’s Trace (Equation 3), Wilk’s Lambda, Hotelling’s Trace or Roy’s Largest Root. For this exercise, the test used was Pillai’s Trace, as suggested by Field (2013), Carey (1998) (“…the most powerful and most robust of the four statistics.”) and Zaiontz (2013-2016) (“For small sample, Pillai’s Trace Test is the preferred method since it is less vulnerable to violations of the assumptions.”).
Equation 3 - Pillai's Trace (MANOVA)
= ( + ) =
The objective is to prove that samples are effectively different when considering the presented variables mashed together. In order to validate if the variables were effectively a differentiation factor for the different operations, the neutral group was added to the first test.
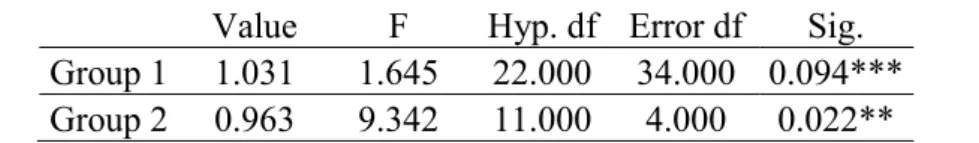
As presented on Table 5, it is possible to see that both tests have significance, one with a confidence interval of 95% and the other one of 90%. With this results it is possible to say that most of the variables present significantly different information on each group.
Table 5 - Pillai's Trace Output
Value F Hyp. df Error df Sig. Group 1 1.031 1.645 22.000 34.000 0.094*** Group 2 0.963 9.342 11.000 4.000 0.022**
Note: Group 1: Pillai’s Trace Test to 3 groups (G, B & N); Group 2: Pillai’s Trace Test to 2 Groups (G & B); (*): 99% confidence interval; (**): 95% confidence interval; (***): 90% confidence interval.
In resume, the MANOVA served as a last validation test to find out whether the variables, although tested individually, differentiated the groups as a whole or not – they did.
8 See appendix on Multiple Discriminant Analysis
3.2.4 Multiple Discriminant Analysis (MDA)
After two individual tests (T-test and Mann-Whitney-Wilcoxon test) – used to disclose variables individually different - and one grouped test (MANOVA) – used to prove that the selected variables, as a whole, were capable of identifying different groups –, a Discriminant test8 was performed to reach the potential answer to the question in hands:
What is (are) the differential/successful factor(s) to watch out before engaging in a brewery-to-brewery acquisition process?
The ultimate goal of this test was to find out if it is possible to aggregate at least four independent variables on the prediction equation and obtain a valid response from it. Therefore, the test to find variables that would suit the equation starts by analyzing all variables the T-test replied as viable (significant difference between group means with a confidence interval of 90%). All those variables were crossed in order to study eventual correlations, crossings and grip to the discriminant analysis.
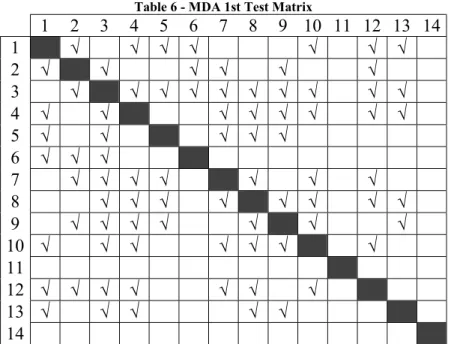
This first test allowed to form pairs of viable variables (Table 6):
Table 6 - MDA 1st Test Matrix
1 2 3 4 5 6 7 8 9 10 11 12 13 14 1 √ √ √ √ √ √ √ 2 √ √ √ √ √ √ 3 √ √ √ √ √ √ √ √ √ √ 4 √ √ √ √ √ √ √ √ 5 √ √ √ √ √ 6 √ √ √ 7 √ √ √ √ √ √ √ 8 √ √ √ √ √ √ √ √ 9 √ √ √ √ √ √ √ 10 √ √ √ √ √ √ √ 11 12 √ √ √ √ √ √ √ 13 √ √ √ √ √ 14
Note: 1: Hofstede’s Individualism Index (Buyer); 2: Hofstede’s Avoidance Uncertainty Index (Acquired); 3: Hofstede’s Indulgence Index (Buyer); 4: acquired country gender; 5: acquired country’s male age distribution; 6: Hofstede’s Indulgence Index (Acquired); 7: GLOBE’s Institutional Collectivism Index (Buyer); 8: GLOBE’s In-Group Collectivism Index (Buyer); 9: GLOBE’s Human Orientation Index (Buyer); 10: GLOBE’s Human Orientation Index (Acquired); 11: GLOBE’s Performance Orientation Index (Buyer); 12: GLOBE’s Potential Distance (Buyer); 13: GLOBE’s Potential Distance (Acquired); 14: Assets (Buyer)
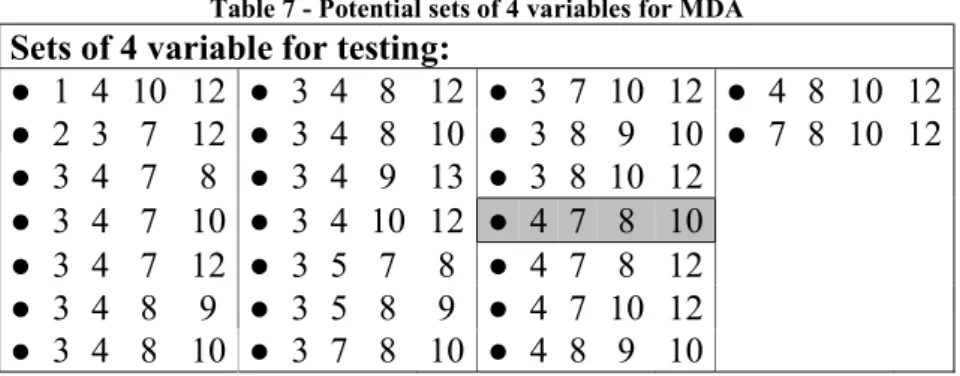
Now, it is possible to form several sets of four variables, in order to test and find the more accurate combination (Table 7):
Table 7 - Potential sets of 4 variables for MDA
Sets of 4 variable for testing:
● 1 4 10 12 ● 3 4 8 12 ● 3 7 10 12 ● 4 8 10 12 ● 2 3 7 12 ● 3 4 8 10 ● 3 8 9 10 ● 7 8 10 12 ● 3 4 7 8 ● 3 4 9 13 ● 3 8 10 12 ● 3 4 7 10 ● 3 4 10 12 ● 4 7 8 10 ● 3 4 7 12 ● 3 5 7 8 ● 4 7 8 12 ● 3 4 8 9 ● 3 5 8 9 ● 4 7 10 12 ● 3 4 8 10 ● 3 7 8 10 ● 4 8 9 10
Note: Numbers presented are the same as MDA 1st Test Matrix.
In order to guarantee the viability of results9, the selected combination had to fulfill some
validation parameters:
Test of Equality of Group Means (validated previously – T-test); Low correlation;
Box’s M: p value must be over 0.001, but significant, although it isn’t completely robust due to unequal sample sizes – Tabachnik and Fidell (2001);
Wilk’s Lambda significance validates how well the model fits.
The combination that performed better on the analysis (according to validation parameters) was the (4,7,8,10) – see MDA matrix code –, i.e., percentage of males on country of acquired company, GLOBE’s Institutional Collectivism Index (Buyer), GLOBE’s In-Group Collectivism Index (Buyer) and GLOBE’s Human Orientation Index (Acquired).
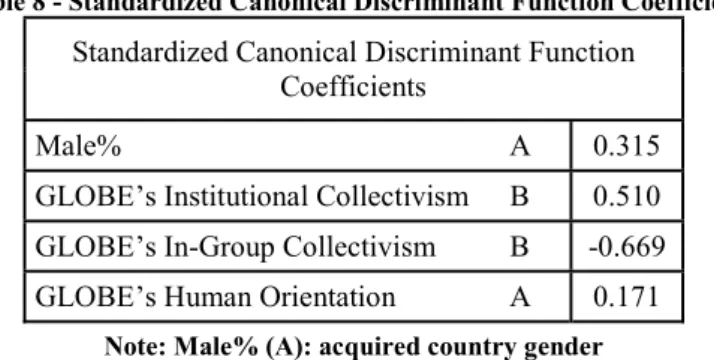
The referred combination presents positive results under the discriminant analysis. The Standardized Canonical Discriminant Function Coefficients shows the impact of each variable on final result (outcome for dependent variable – qualitative output). In Table 8, it is possible to state that GLOBE’s Institutional and In-Group Collectivism Indexes (Buyer) are the variables that most impact the success of an acquisition in the beer sector.
Table 8 - Standardized Canonical Discriminant Function Coefficient
Standardized Canonical Discriminant Function Coefficients
Male% A 0.315
GLOBE’s Institutional Collectivism B 0.510 GLOBE’s In-Group Collectivism B -0.669 GLOBE’s Human Orientation A 0.171
Note: Male% (A): acquired country gender
The Canonical Discriminant Function Coefficients, present in Table 9, displays the p’s
for the intended MDA equation. This way, it is possible to develop the Equation 4 – this equation is the base to predict to which group each new operation would belong (Good or Bad).
Table 9 - Canonical Discriminant Function Coefficient
Canonical Discriminant Function Coefficient
Male% A 0.396
GLOBE’s Institutional Collectivism B 1.655 GLOBE’s In-Group Collectivism B -1.243 GLOBE’s Human Orientation A 0.624
(Constant) -22.912
Note: Male% (A): acquired country gender; Equation 4 - Exercise's MDA Equation
= −22.912 + 0.396( % 100) + 1.655 . . − 1.243 . . + 0.624 . . +
Function at Group Centroids allows the definition of the outcome, so that it is possible to know whether the company at test belongs to the G(ood) Group or the B(ad) Group. With the information in Table 10 it is possible to draw the intervals in Figure 4.
Table 10 - Function at Group Centroids
Function at Group Centroids G(ood) Group 1.310 B(ad) Group -1.019
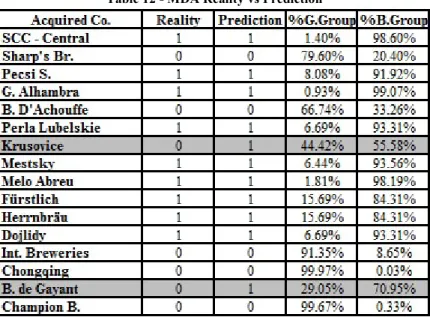
In Table 11, is possible to obtain two outputs: original (direct output of the function probabilities) and cross-validation. In cross-validation, each deal in the dataset is looped over and treated as test data. The remaining deals are treated as a new dataset. If the extracted point doesn’t comply with test parameters it is misclassified (IBM, 2011). Both original and cross-validated groups verify a certainty level, regarding its predictions, of 87.5%. If the output is stable, then most of the operations should be correctly classified in this test (over 80%). It is also possible to state the function is highly sensible (71.4%) – few false negatives – and specific (100.0%) – few, in this case none, false positives.
Table 11 - MDA Classification Results
Classification Results a,c
Predicted Group Membership
Groups G(ood) Group B(ad) Group Total
Original Count G(ood) Group 5 2 7
B(ad) Group 0 9 9
% G(ood) Group 71.4 28.6 100.0
B(ad) Group 0.0 100.0 100.0
Cross-validatedb Count G(ood) Group 5 2 7
B(ad) Group 0 9 9
% G(ood) Group 71.4 28.6 100.0
B(ad) Group 0.0 100.0 100.0
a. 87.5% of original grouped cases correctly classified
b. Cross validation is done only for those cases in the analysis. In cross validation, each case is classified by the functions derived from all cases other than that case.
c. 87.5% of cross-validated grouped cases correctly classified.
Only two objects would be wrongly classified regarding reality vs prediction (Table 12).
Table 12 - MDA Reality vs Prediction
3.3 Results Discussion and Interpretation
The objective of the tests was to verify, from a list of 39 possible explainable / predictor variables, those that could predict ex-ante the success of an acquisition in the beer sector. Firstly, T-test and Mann-Whitney-Wilcoxon test validate which variables have significant differences when comparing group results.
Secondly, the MANOVA confirm the difference between groups if the variables are mashed together. This means that groups, G(ood) Group and B(ad) Group, are different from each other considering all the range of variables.
Lastly, the Multiple Discriminant Analysis, using a combination of (four) variables was able to predict, with an 87.5% accuracy, the (in)success of an acquisition process. Those variables are the acquired country GLOBE’s Human Orientation index, the percentage of male population in the country of the acquired company and the buyer country GLOBE’s Institutional Collectivism index and GLOBE’s In-Group Collectivism index.
The GLOBE’s Human Orientation index in the acquired country is the model’s least impactful variable. This index is characterized by the encouragement to one to be fair, altruistic, generous, caring and kind to others.
House et al. (2004) attributes index’s high levels to cultures characterized by the need of belonging and affiliation, promotion of well-being by members of society, sensibility towards racial discrimination and importance of others interests.
Shelley (2014) refers the sense of belonging’s importance nowadays to explain the importance of this human orientation variable: “The impact of failing to create a sense of belonging with our employees not only affects how much they enjoy their work; it has a significant effect on their ability to be productive”. The need of belonging may also be seen as a facilitator during the acquisition process.
The percentage of male population in the country of the acquired company is the third most impactful variable. According to the model, the higher the percentage of males on the acquired company’s country, the bigger it is the chance for the operation to be successful (success = increase in revenue for acquired company on a period of two years and less time in operation process).
The conclusion was already stated by Berman (2013): “Looking at the numbers, men tend to drink more alcohol than women”. Several studies present similar claims, such as Eads (2015) publication of AB Inbev’s study or Becca (2012). These last two present not just the trend of men drinking more alcohol, but also that women drink a lot less beer, because it is considered a beverage for men.
Regarding revenue performance, the contribution of this variable to the analysis is that it is easier to increase revenues in countries where men outnumber women, since they are the main communication target of the beer sector. This way, with the right strategy (input from buyer), a company (acquired) will be able to present short term increase in revenues, since the target is larger.
The GLOBE’s Institutional Collectivism index in the country of the buyer company is the second most impactful variable. This index is characterized by the encouragement of society to collective actions so, according to model’s equation, the bigger the intent of collective actions the better the outcome of the operation.
House et al. (2004) attributes index’s high levels to cultures characterized by interdependency, loyalty even if it undermines individual goals, maximization of collective interests and group decision making. Institutional Collectivism has been tested and implemented with success in post-conflict Libya as presented by Fearon et al. (2011), reinforcing the importance of this variable.
An acquiring company that intents to work for the common good will be more efficient (Akresh et al., 2011), reducing the operation time length due to its productivity. It may also be a revenue booster for the acquired company as well, since it will benefit from the maximization of collective interest, growing alongside the acquirer.
Finally, the GLOBE’s In-Group Collectivism index in the buyer company is the most impactful variable, although it has a negative impact. This index is characterized by the degree of pride, loyalty and cohesiveness that individuals show in their organizations. House et al. (2004) attributes index’s low levels to cultures which practice rationality in behavior, a faster pace of life, social behavior attitudes importance and little distinction between groups. It is important to consider low levels on this index, since it contributes negatively to the model and the objective is to obtain the most positive outcome possible. If the acquiring company culture practices a faster pace of life is natural that the duration of the operation follows such trend, which may be facilitated if there’s no pressure for distinctions between groups (negotiations between hypothetical peers are facilitated). On the other hand, rational behavior is characterized by the search for the best estimated outcome for the investor (buyer).
It is possible to verify a split in variables: two belong to the buyer (GLOBE’s Institutional Collectivism (0.51) and In-Group Collectivism (-0.669)) and the other two to the acquired company (Acquired Country Gender (0.315) and GLOBE’s Human Orientation (0.171)). It is important to refer that, considering the Standardized Canonical Discriminant Function Coefficients (Table 8), the buyer affecting variables have more impact on the model equation, although they have similar opposite impacts.
To conclude, it is possible to link the three GLOBE variables to the overall output (revenue and time length), since there’s the intention and belief in overall maximization and no distinction between groups from the acquirer, while the acquired company has a need of belonging. The Acquired Country Gender, conceptually, seems like a variable that has more association with revenue performance.
4. Conclusion
4.1 Main Conclusions
In this work, the differential factors to which a company should look for before engaging on a brewery-to-brewery acquisition are studied. More specifically, variables that may influence: (1) the acquisition process duration and (2) the future performance of standalone acquired companies. 16 of 29 acquisition processes were selected and split according to their process duration and acquired companies performance two years post-acquisition.
The empirical work – a series of tests that resulted on a predicting model – makes it possible to draw a relationship between the outcome and four independent variables. It can be concluded that (1) an acquired company highly engaged in a human oriented culture (GLOBE’s Human Orientation (Acquired)) that has high male percentage in its country of action (Acquired Country Gender), associated with an (2) acquiring company highly engaged in institutional collectivism (GLOBE’s Institutional Collectivism (Buyer)) and little engaged in in-group collectivism (GLOBE’s In-Group Collectivism (Buyer)), are indicators for a faster acquisition process and an incremental boost on acquired company’s performance.
Although GLOBE variables may not have a direct link to a particular industry, it seems there’s a complementarity situation on the interest of acquiring companies sharing growth with the acquired ones and the need to belong by the last. On the other hand, country gender ratio is an usual topic on the beer industry, since beer is completely perceived as a men’s drink and the numbers also show that men drink considerably more than women (Berman, 2013; Eads, 2015).
Despite having significant accuracy, the outcome of the Multivariate Discriminant Analysis presents two operations that show different predictions from the expected. Nonetheless, the decision of not engaging on the referred operations would mean an opportunity loss and not a wrong investment decision (both operations are good performing ones and the prediction says otherwise).