Journal of Environmental Management 146 (2014) 373-‐382
The dynamics and drivers of fuel and fire in the Portuguese
public forest
Paulo M. Fernandes
a,b,*, Carlos Loureiro
a,b, Nuno Guiomar
c, Gianni B. Pezzatti
d,
Filipa T. Manso
e, Luís Lopes
ba Centre for the Research and Technology of Agro-‐Environmental and Biological Sciences, CITAB, University of
Trás-‐os-‐Montes and Alto Douro, UTAD, Quinta de Prados, 5000-‐801 Vila Real, Portugal.
b Departamento de Ciências Florestais e Arquitetura Paisagista, University of Trás-‐os-‐Montes and Alto Douro,
UTAD, Quinta de Prados, 5000-‐801 Vila Real, Portugal.
c ICAAM -‐ Instituto de Ciências Agrárias e Ambientais Mediterrânicas, Departamento de Paisagem, Ambiente e
Ordenamento Universidade de Évora, Núcleo da Mitra, Apt. 94, 7002-‐554 Évora, Portugal.
d WSL Swiss Federal Institute for Forest, Snow and Landscape Research, Research Group Insubric Ecosystems,
Via Belsoggiorno 22, CH-‐6500 Bellinzona-‐Ravecchia, Switzerland.
e Centro de Estudos Transdisciplinares para o Desenvolvimento (CETRAD), Universidade de Trás-‐os-‐Montes e
Alto Douro, Apt. 1013, 5000-‐801, Portugal.
* Corresponding author. E-‐mail: pfern@utad.pt. Tel.: +351 259 350861; fax: +351 259 350480.
Abstract
The assumption that increased wildfire incidence in the Mediterranean Basin during the last decades is an outcome of changes in land use warrants an objective analysis. In this study we examine how annual area burned (BA) in the Portuguese public forest varied in relation to environmental and human-‐influenced drivers during the 1943-‐2011 period. Fire behaviour models were used to describe fuel hazard considering biomass removal, cover type changes, area burned, post-‐disturbance fuel accumulation, forest age-‐classes distribution and fuel connectivity. Biomass removal decreased rapidly beyond the 1940s, which, along with afforestation, increased fuel hazard until the 1980s; a subsequent decline was caused by increased fire activity. Change point analysis indicates upward shifts in BA in 1952 and in 1973, both corresponding to six-‐fold increases. Fire weather (expressed by the 90th percentile of the Canadian FWI during summer)
increased over the study period, accounting for 18 and 36% of log(BA) variation before 1974 and after 1973, respectively. Regression modelling indicates that BA responds positively to fire weather, fuel hazard and number of fires in descending order of importance; pre-‐summer and 2-‐ year lagged precipitation respectively decrease and increase BA, but the effects are minor and non-‐significant when both variables are included in the model. Land use conflicts (expressed through more fires) played a role, but it was afforestation and agricultural abandonment that supported the fire regime shifts, explaining weather-‐drought as the current major driver of BA as well. We conclude that bottom-‐up factors, i.e. human-‐induced changes in landscape flammability and ignition density, can enhance or override the influence of weather-‐drought on the fire regime in Mediterranean humid regions. A more relevant role of fuel control in fire management policies and practices is warranted by our findings.
Keywords: Fire regime Global change Fuel hazard Fire modelling Fire management Mediterranean Basin
1. Introduction
The fire regime concept allows the description of fire incidence over time and is the basis to understand and communicate its environmental impacts (Krebs et al., 2010). Fire regime characterization is crucial for fire management, despite its dynamic nature and intrinsic variation in space and time. Humans affect the fire regime directly by initiating and suppressing fire, and indirectly by conditioning vegetation (fuel) through the type and intensity of land use. Anthropogenic fire regimes are then determined by the interplay between human population activities and fuels (Fulé et al., 2012; Guyette et al., 2002). Landscape patterns and dynamics influence fire regimes and post-‐fire responses, and such knowledge is relevant in landscape planning and management (Moreira et al., 2011).
Profound landscape changes took place during the second half of the 20th century in the
Mediterranean Basin, mostly in relation to passive (vegetation succession after farmland and rangeland abandonment) or active (afforestation) processes that increased fuel loading, extent and connectivity of shrublands and woodlands (Fernandes, 2013; Loepfe et al., 2010; Moreira et al., 2011). Large-‐scale afforestation and reforestation with fast-‐growing pioneer conifers was a prominent feature of forest policies in the Mediterranean Basin, from Portugal to Turkey, with objectives of wood production and land restoration (Pausas et al., 2004). Forest plantations on Portuguese public land totalled 419,010 ha (85.5% of the total) from 1923 to 1995, of which 91.2% on communal land and 8.8% on coastal sand dunes (Carvalho and Morais, 1996; Rego, 2001); all south-‐western Europe countries experienced vigorous afforestation of common lands since the 1940s (Pinto-‐Correia and Vos, 2004).
Common lands were central to mountain agriculture in the multifunctional cultural landscapes of northern Portugal, as sources of pasture and shrub bedding for livestock and organic fertilization, fuel wood, charcoal and rye (Brouwer, 1993; Estêvão, 1983). Like elsewhere in southern Europe (Cussó et al., 2006; Pinto-‐Correia and Vos, 2004), livestock was the main integrator of agriculture and other land uses, crucial in the extraction, transference and deposition of nutrients (Aguiar et al., 2009; Estabrook, 1998, 2006). Shrub-‐ and grass-‐covered common lands occupied the highest elevations and poorer soils and were extensively grazed, cut and frequently burned by small and low-‐severity fires (Aguiar et al., 2009; Seijo and Gray, 2012). Afforestation of common lands was imposed by the state forest service, in Portugal (Brouwer, 1993) as in Spain (Seijo and Gray, 2012). In Portugal the units of commons were aggregated in ‘forest perimeters’. Local communities opposed afforestation because it implied grazing exclusion and conditioned other uses of biomass (Brouwer, 1995). Emigration of rural population was primarily an outcome of transition to an industrial society, but afforestation added to it, therefore accelerating the agricultural system disruption (Estêvão, 1983; Seijo and Gray, 2012). Most common land is currently co-‐managed with the forest service, following 1976 legislation that reinstated control by local communities. Anthropogenic fire has long been a regular and important factor of disturbance in Portuguese mountains (e.g., Connor et al., 2012), and mountain common lands currently comprise more than 60% of the Portuguese areas with a nature conservation status (Lopes et al., 2013). Afforestation of public land in Portugal was based on Pinus pinaster Aiton (maritime pine), which forms flammable stands that require extensive fuels treatment to avoid high-‐severity fire (Fernandes and Rigolot, 2007). Persistence of pre-‐ industrial burning practices in the common lands and in their vicinity threatened the new stands (Seijo, 2005; Seijo and Gray, 2012). Accordingly, the forest service enforced fire exclusion and setup a fire suppression system (Quintanilha et al., 1965), but fuel management was not implemented until the 1980s when increased fire activity had become evident (Fernandes and Botelho, 2004; Silva, 1997).
Previous studies have characterized the last decades land-‐use changes in southern Europe and the concomitant increase in fire activity in the last half of the 20th century (Moreira et al.,
2011). Temporal shifts and trends in burnt area have however occurred both upward and downward (Moreno et al., 2014; Pausas and Fernández-‐Muñoz, 2012; Pezzatti et al., 2013; Turco et al., 2013). The relationships between land use changes in the Mediterranean and observed or potential fire activity have been approached through landscape structure metrics (Lloret et al., 2002; Loepfe et al., 2010; Martín-‐Martín et al., 2013; Vega-‐Garcia and Chuvieco, 2006), fuel accumulation rates (Rego, 1992) and fuel hazard scores assigned to land cover types (Millington, 2005; Moreira et al., 2001; Romero-‐Calcerrada and Perry, 2004; Viedma et al., 2009). Azevedo et al. (2011) went a step further and translated land use changes into fire potential by modelling
fire intensity and fire growth in discrete moments in time (1958-‐2005) in a landscape of NE Portugal.
Fire-‐regime modifiers other than land use dynamics can be equally important, namely climatic change (Amatulli et al., 2013; Batllori et al., 2013; Bedia et al., 2014; Krawchuk et al., 2009). Interaction between climate and fuels produces a fire-‐regime gradient from fuel-‐limited, where fuel load and connectivity are too low for fire to spread, to moisture-‐limited, where fuel does not dry enough to support fire spread (Bradstock, 2010; Krawchuk and Moritz, 2011; Pausas and Ribeiro, 2012). Mediterranean-‐type ecosystems occupy an intermediate position in the precipitation gradient and it is unclear whether fuels or moisture prevail in determining the fire regime, introducing uncertainty regarding the direction and intensity of the response to climate change (Batllori et al., 2013). Empirical evidence on the dependency of burnt area on fuel structure and fuel moisture in the Mediterranean is restricted to Spain (Vázquez et al., 2002; Pausas and Fernández-‐Muñoz, 2012; Pausas and Paula, 2012). Further interactions and complexity result from active fire management, namely fire suppression (Brotons et al., 2013; Moreno et al., 2014; Pezzatti et al., 2013). Sound management of fire-‐prone Mediterranean landscapes, currently and in the future, requires deeper and more quantitative understanding of the relative importance of the various fire-‐regime drivers (Fernandes, 2013).
This study (1) assesses trends in fuel hazard in the Portuguese public forest from 1943 to 2011; (2) identifies points of change in the fire regime during this period as described by annual area burned; and (3) models annual burned area from environmental and human-‐influenced drivers to assess the relative strength of their influences. We hypothesize a gradual increase in fuel hazard due to the effects of afforestation and agriculture decline and expect a fire-‐regime shift where weather-‐drought becomes the major driver of area burnt in response to increases in fire weather severity, fuel hazard and land-‐use conflicts.
2. Methods
2.1. Study area and fire activity
The study area is the public forest land dispersed in northern and central Portugal between 39ºN and 42ºN latitude and 7ºW and 9ºW longitude (Fig. 1), comprising 489,874 ha (AFN, 2010). Except for the coastal forests, elevation is generally above 400 m, and often above 700 m (and up to 2000 m). Regional climate is mediterranean with an oceanic influence that is especially pronounced in the northwest and results in high aboveground net primary productivity (NPP) (Alcaraz et al., 2006). Annual precipitation and mean annual temperature vary in the ranges of 700-‐2800 mm and 7-‐14 ºC (Ribeiro et al., 1988). We approach the study area as a single unit characterized on average terms and ignore the existing variation due to lack of spatial data. Additionally, data pertaining to individual years is interpolated to reconstruct fuel hazard for the entire time series.
Forest in this study is defined by tree canopy cover ≥10% and height ≥ 5 m. Individual years’ forest area was obtained from Rego (2001) and by analysing land use and land cover digital maps for Portugal (e.g., Caetano et al., 2009). We equated all forest to Pinus pinaster forest, as deciduous and mixed stands are a minor (≈5%), relatively stable, and highly fragmented component of the landscape, hence unlikely to influence fire potential. The sum of forest and other land uses was subtracted from total area to obtain shrubland (including natural grassland as a minor component).
Annual burned area (BA) in public land was taken from Macedo and Sardinha (1993) for the period 1943-‐1974, and from the National fire atlas resultant from satellite imagery (Oliveira et
al., 2012) or ground survey, for the 1975-‐2011 period
(http://www.icnf.pt/portal/florestas/dfci/inc/info-‐geo). The annual number of fires affecting forest (NF, size ≥ 0.1 ha) came from official records compiled in Macedo and Sardinha (1993) and from the Forest Service database (http://www.icnf.pt/portal/florestas/dfci/inc/estatisticas), respectively for 1943-‐1980 and for 1981-‐2011.
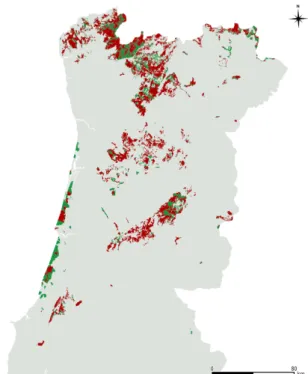
Fig. 1. Study area. Public forest land is displayed in red and green, respectively burnt at least once from 1975 to 2011 (67% of the burnable surface) and unburnt since 1975.
2.2. Biomass removal
We considered four components for the removal of biomass: grazing by domestic animals, fuel wood harvest, shrub cutting, and fuel treatments to mitigate fire hazard. The study area is still characterized by an extensive and low-‐input livestock system based on animal roaming (Fernandes et al., 2005). Consumption of biomass by livestock was based in official censuses of cattle, sheep and goats numbers in parishes including communal lands (Baptista, 2010). Data for 1999 on the percentage of those animals that feed on communal land was extrapolated for the other censuses. Livestock effectives were expressed as animal units (AU), one AU corresponding to one cow and a daily forage intake of 12 kg of dry matter (Scarnecchia and Kothmann, 1982). For cattle we assumed 0.1 AU, because only 10% of their diet actually comes from shrubland (Ferreira et al., 2013). Sheep and goats were respectively attributed 0.2 and 0.15 AU, following a generalized assumption and data from Spain (Bartolomé et al., 2000). AU values were then converted into consumed biomass (t ha-‐1 year-‐1).
Estimation of fuel wood harvest assumed a baseline consumption of 2.25 t year-‐1 per active
inhabitant in agrarian labour (Rego, 1992). Estimates were made for the years for which population census data was available and then adjusted through multipliers expressing energy transition from wood to other sources (Henriques, 2009).
We assumed that shrub biomass harvesting for livestock bedding (and subsequent fertilization of farm soil) amounted on average to 1.3 t ha-‐1 year-‐1 per active inhabitant in
agriculture (Estabrook, 1998), which is presumed representative given the low regional variability in fertilization requirements (Aguiar and Azevedo, 2011). Shrub collection for agriculture was assumed proportional to livestock abundance (Estabrook 1998, 2006), and annual shrub removal was estimated from the density of active agrarian population, adjusted for livestock AU.
The area subjected to fuel treatments (prescribed burning and shrub clearing, 1999-‐2011) was either supplied by the Forest Service (P. Mateus, pers. comm.) or estimated from the number of fire crews working on public land.
Landscape-‐level assessment of fuel hazard requires consideration of the cover types flammability and the degree of connectivity among flammable patches. Fuel hazard was expressed by combining stand-‐level fireline intensity (Byram, 1959), from which fire control difficulty depends; the potential for landscape-‐level fire spread as affected by non-‐forest cover types; and fuel fragmentation. The latter variables adjust and extend stand-‐level fire potential to the landscape, following the principle that the spread of a disturbance should be inversely proportional to landscape heterogeneity (Turner et al. 1989). Separate fire behaviour calculations were made for pine forest and for shrubland. Details on fire behaviour simulation are given as Supplementary information.
We considered 4 stand age classes for pine forest, respectively <10, 10-‐19, 20-‐39 and ≥40 years and calculated each age class share of forest area, using afforestation and forest inventory data in Rego (2001) and Louro et al. (2010). Fire-‐spread rate and fireline intensity were estimated with PiroPinus (Fernandes et al., 2012) and CFIS (Alexander et al., 2006), respectively for surface and crown fire. Means calculated from National Forest Inventory data for each age class provided the stand and fuel inputs for the fire behaviour models (Table S1). Fireline intensity was calculated for each stand age class and averaged using age class representativity as the weighting factor.
Interannual variation in fuel hazard in shrubland was a function of shrub loading. Estimation of mean fuel loading in shrubland integrated human and livestock shrub removal and the dynamics of shrub accumulation subsequent to wildfire and fuel-‐reduction treatments. Shrub fuel build-‐up (t ha-‐1) after disturbance was calculated as (Rosa et al., 2011):
Wshr = 18.86 (1-‐exp(-‐0.23 t)) (1) where t = time (years) since fire or shrub removal. Most of the data used to develop equation (1) came from the study region. Fire spread rate was determined after parameterizing the model in Fernandes (2001) as a function of fuel loading (Supplementary information). Forest and shrubland fireline intensities were averaged as a function of their respective areas.
Assessment of fire spread potential across the landscape (R) assumed random cover type patterns and followed Finney (2003):
𝑅 = !! !! ! !!! !! (2)
where n is the number of fuel types, pi is the landscape fraction occupied by the ith fuel type, and
ri is the fire-‐spread rate of fuel type i in the direction of maximum spread (see Supplementary
information).
Fragmentation of forest and shrubland was quantified through CBEMS, the cross boundary effective mesh size (Moser et al., 2007):
𝐶𝐵𝐸𝑀𝑆 =!
! 𝑎!". 𝑎𝑐!" !
!!! (3)
where A = study area, n = number of patches, aij = size of the patch ij, acij = total area of the complete patch to which patch ij belongs. CBEMS removes the bias inherent to boundaries and
integrates the study area geographical context.
Fireline intensity, landscape fire-‐spread and CBEMS were expressed on a 0-‐1 scale, 1 corresponding to maximum fireline intensity, maximum spread potential and minimum fuel fragmentation (or maximum fuel connectivity). The three variables were multiplied to obtain a fuel hazard metric that was rescaled to 0-‐1.
Land use, biomass removal and fuel data are for discrete points in time, given as Supplementary data. Cubic smoothing spline regressions were fitted to the data to generate annual figures for 1943-‐2011 and be able to describe fuel hazard and model BA.
2.4. Weather and fire danger rating
Fire danger rating was assessed from temperature and precipitation data. Long-‐term station records of monthly temperature for the study region came from the Global Historical Climate
Network version 2 data set (Peterson and Vose, 1997). For precipitation we used a daily gridded data set for Portugal (1950-‐2003) with 0.2° × 0.2° resolution (Belo-‐Pereira et al., 2011). Annual precipitation by month was computed for the 58 grid cells within public forest and averaged for the study area. For the 1943-‐1949 and 2004-‐2011 periods we used rainfall data from 31 weather stations of the national information system on hydrological resources.
The influence of weather-‐drought on BA as a single variable was expressed through the Fire Weather Index (FWI), an indicator of potential fire intensity and fire control difficulty (Van Wagner, 1987). The FWI is the primary variable of the Canadian FWI System and is used to assess fire danger in Portugal (Palheiro et al., 2006) and in Europe in general (e.g. Camia and Amatulli, 2009). 10% of summer days accounts for 80% of annual BA in Portugal (Pereira et al., 2005), prompting the adoption of the FWI 90th percentile of July-‐September (FWIe) as an adequate fire
weather metric. The daily FWI observations (i.e., calculated with 12-‐UTC data) from 23 IPMA (Portuguese weather service) weather stations within the study region were used to determine FWIe for each year of the 2001-‐2011 period. Alternative descriptors of temperature and precipitation were explored by non-‐linear least squares as predictors of FWIe. The following equation provided the best fit and was used to derive annual FWIe figures for the whole study period:
FWIe = 0.6808 TM1.2898 exp (-‐0.0011 R5-‐9) (4)
where TM is the mean temperature of the warmest month (oC) and R5-‐9 is May to September
rainfall. Equation (4) accounted for 52% of FWIe variability, which is reasonable considering that the FWI is calculated from relative humidity and wind speed in addition to temperature and precipitation (Van Wagner, 1987). As this approach is crude (Herrera et al., 2013), an equation of the form log(BA) = a + b FWIe was fitted to assess its ability to describe fire activity from 2001 to 2011. Modelled (equation 4) and actual FWIe performed similarly in predicting BA, with R2
values of 0.34 and 0.36, and RMSE values of 0.84 and 0.83, respectively.
Antecedent (e.g. Pausas, 2004; Taylor and Beaty, 2005; Turco et al., 2013a) and current year pre-‐summer (Pereira et al., 2005) precipitation are possible influences on year-‐i BA and were calculated respectively for years i-‐1, i-‐2 and i-‐3 and for sequences of months in year i (January-‐ March, January-‐April, January-‐May, January-‐June). Additionally, we calculated the ratio of January-‐April to May-‐June rainfall because a wet winter followed by a dry late spring can increase fuel loading.
2.5. Data analysis
Time shifts in BA were identified through change point analysis, previously used to detect fire regime changes (Moreno et al., 2014; Pausas and Fernández-‐Muñoz, 2012; Pezzatti et al., 2013). We used two statistical techniques to determine the points of change, respectively the cumulative sum of the deviations from the mean over the study period (CUSUM), and the more robust nonparametric Pettitt test.
The identification of multiple change points by the Pettitt test considered two alternatives: detection of the main change point and then identification of secondary moments of change within the ensuing sub-‐periods; and the calculation of a running Pettitt index, i.e. for the central point of a moving time window, set to 21 years. Consistency between the two options in identifying a change in the Pettitt index, corresponding to high p-‐values (p>0.8), was taken as effective evidence of a change point; for methodological details see Pezzatti et al. (2013). BA, NF and FWIe were compared among fire-‐regime phases with a multiple comparison Wilcoxon test.
Annual BA was log-‐transformed and modelled from the number of fires and the variables describing fuel hazard, fire weather and rainfall, using Generalised Linear Models (GLM) with an identity link function and a normal error distribution. The likelihood of fire ignition and spread is affected by weather and rainfall (e.g. Fernandes et al., 2008). To disentangle weather and human behaviour we modelled NF from weather-‐related variables and used the residuals as the independent variable (NFadj) in BA models; NFadj is expected to reflect the direct role of humans
in BA better than NF. Independent variables correlated (p<0.05) with time were detrended to control for temporal trends. The independent variables were standardized by subtracting the mean and dividing by the standard deviation. BA was modelled as log(BA) and as detrended
log(BA), the former option including time (year) as an additional independent variable. We tested for interactions between variables and for overdispersion, and based model selection on the Akaike’s Information Criteria corrected for finite sample sizes (AICc).
3. Results
3.1. Fuel dynamics and fuel hazard
Fig. 2 depicts the modelled trends in forest biomass consumption by humans and their animals. Fuel wood collection, grazing and shrub harvesting all declined rapidly from the 1940s onwards. Overall, biomass use by livestock and agriculture declined by a factor of 10 from 1943 to 2011.
Only a small fraction of the landscape receives fuel-‐hazard reduction treatments (not shown in Fig. 2). The average annual treatment effort has reached an average of 3676 ha (0.75% of the total surface) in 2007-‐2011.
Fig. 2. Time series (1943-‐2011) of modelled dynamics of biomass consumption in the Portuguese public forest.
Fig. 3. Time series (1943-‐2011) of fuel hazard in the Portuguese public forest.
Fuel hazard (Fig. 3) peaked in the 1980s after a continuous increase (at a bigger rate since the 1960s) from the beginning of the study period, reflecting the fuel build-‐up caused by concurrent
0 0.4 0.8 1.2 1.6 2 2.4 Bi o m as s co n su m p ti o n ( t/ h a) 1950 1960 1970 1980 1990 2000 2010 Year Fuelwood Livestock grazing Livestock bedding 0.2 0.4 0.6 0.8 1 Fu el h azard 1950 1960 1970 1980 1990 2000 2010 Year
afforestation and decrease in biomass use. A steady decline ensued due to wildfire, and fuel hazard was three times higher in 2011 than in the 1940s but represented just 60% of the potential in the 1980s. Fireline intensity varied by a factor of five during the study period, contrasting with fuel connectivity (2-‐fold variation) and fire-‐spread potential (negligible variation) and hence it dominates fuel hazard changes over time (Fig. S2).
3.2. Fire activity and fire weather
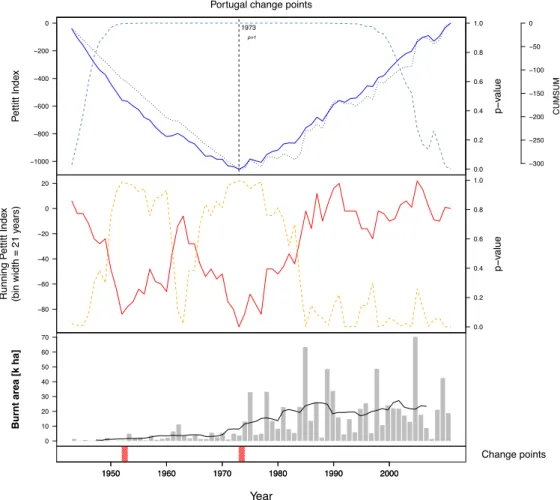
Annual burnt surfaces in the Portuguese public forest indicate pronounced changes throughout the study period (Fig. 4). 67% of the study area burnt at least once between 1975 and 2011 (Fig. 1). Both variants of the Pettitt index (classical and running) indicate 1973 as the most likely change point to a more severe (and also more variable) fire regime, while the CUSUM suggests the year of 1974 (Fig. 4). A secondary shift occurred in 1952, also towards greater burnt area. Table 1 summarizes data for 1943-‐1952, 1953-‐1973 and 1974-‐2011. On average, BA increased six-‐fold from the first to the second phase, and then again from the second to the third phase (Table 1).
FWIe during the primary fire season (July-‐September) differed between the final and the initial and intermediate phases (p=0.0285) and increased over the study period (p=0.0026). Log-‐ transformed BA was strongly correlated with FWIe (p<0.001), which explained 28% of its variation. The interaction between fire regime phase and FWIe did not affect log(BA) (p=0.6063). If the primary point of change (1973) is considered to define just two phases, an exponential function indicates weaker association between BA and FWIe before 1974 (R2=0.18) than after
1973 (R2=0.36) (Fig. 5); again, interaction between the fire regime phase and FWIe was not
significantly different from zero and the slopes of the regressions did not differ (p=0.3232). A temporal increase in NF supports the BA increase (Table 1, Fig. S1). NF increased by factors of 2.5, from 1943-‐1952 to 1953-‐1973, and 2.6, from 1953-‐1973 to 1974-‐1980, and 55% of its annual variation is explained by the fire-‐regime phase (p<0.0001). Log-‐transformed FWIe (p=0.0010) and January to March rainfall (R1-‐3) (p=0.0339) account for 20% of the variation in
log(NF), resulting in equation (5) after back-‐transformation and bias correction (Snowdon, 1991):
NF = 0.171 FWIe2.624 R1-‐3-‐0.337 (5)
3.3. Burned area modelling
Annual BA responds positively to more fires, higher fuel hazard and more severe fire weather, each of these variables exerting an increasingly stronger effect (Table 2). Precipitation variables have a weak effect on BA and are marginally significant at best. Adding precipitation variables to the basic drivers of BA (FWIe, fuel hazard and NFadj) is not a substantially improvement over the
more parsimonious models (logBA1 and dlogBA1), as measured by decreases in AICc and
increases in R2. Of all the possible combinations of pre-‐summer precipitation only January to May
and January to June rainfall affect BA. Both decrease BA, with a slight statistical advantage for R1-‐ 6. BA is not influenced by the ratio of January-‐April to May-‐June rainfall nor by precipitation with
lags of 1 and 3 years but increased with 2-‐year lagged precipitation (ARlag2).
Models for log(BA), which include year as an independent variable, have greater explanatory power (R2≥0.8) than models for detrended log(BA) (R2 around 0.5). The model with the lowest
AICc (dlogBA4) includes both R1-‐6 and ARlag2, but neither rainfall variable is significant in the
model (p<0.05). No interactions between variables were found.
Model coefficients for each independent variable, which express the relative contributions to BA, do not vary substantively among equations. The influence of fire weather prevails over the influences of fuel and ignitions. Fuel hazard exerts lower influence on BA in detrended models, becoming comparable to ignitions. Overall, the relative importance of exogenous variables (weather-‐drought and precipitation) and endogenous variables (fuel and NFadj) in determining
Table 1
Annual afforestation, number of fires (NF) and burnt area (BA) by fire regime phase of the study period. % refers to total area. NF and BA means are significantly different at p<0.001.
Phase n Annual afforestation Mean NF BA (ha) Mean BA
(%) (no. 100 km-‐2) Mean Min. Max. (%)
1943-‐1952 10 1.04 0.74 593 120 2062 0.12
1953-‐1973 21 2.14 1.86 3350 446 11172 0.68
1974-‐2011 38 a 0.90 4.93 20744 1423 70239 4.23
a 1974-‐1995.
Fig. 4. Change point analysis for area burnt in the Portuguese public forest, 1943-‐2011. The first plot shows the Pettitt approach result. The second plot shows a running Pettitt index for a reference period of 21 years. Plain lines are the Pettitt index, except in the third plot, where it corresponds to the BA running mean over 9 years. Dotted lines are the cumulative sums of deviation (CUSUM). Dashed lines are the p-‐values indicating the approximate probability of a change point. Detected change points are indicated by diagonal stripes.
Fig. 5. Annual burnt area (BA) on a logarithmic scale versus FWIe, the 90th percentile of the FWI from July to
September. White, grey and black circles respect to 1943-‐1952, 1953-‐1973 and 1974-‐2011. The plotted functions are of the form log(BA) = a + b FWIe, fitted to 1943-‐1973 data (plain line; b = 0.225 ± 0.089, R2=0.18,
p=0.0178) and 1974-‐2011 data (dashed line; b = 0.141 ± 0.032, R2=0.36, p<0.0001).
−300 −250 −200 −150 −100 −50 0 −1000 −800 −600 −400 −200 0 0.0 0.2 0.4 0.6 0.8 1.0 P ettitt Inde x CUMSUM p − value 1973 p=1
Portugal change points
−80 −60 −40 −20 0 20 0.0 0.2 0.4 0.6 0.8 1.0 Running P ettitt Inde x (bin width = 21 y ears) p − value year 0 10 20 30 40 50 60 70
Burnt area [k ha]
1950 1960 1970 1980 1990 2000 Change points ● ● ● ● ● ● ● ● ● ● ● ● ● ● ● ● ● ● ● ● ● ● ● ● ● ● ● ● ● ● ● ● ● ● ● ● ● ● ● ● ● ● ● ● ● ● ● ● ● ● ● ● ● ● ● ● ● ● ● ● ● ● ● ● ● ● ● ● ● 1950 1960 1970 1980 1990 2000 Year 100 1000 500 400 300 200 10000 5000 4000 3000 2000 100000 50000 40000 30000 20000 BA (h a) 20 24 28 32 36
Table 2
Alternative regression models for log-‐transformed burned area (logBA) and detrended log-‐transformed burned area (dlogBA) in the Portuguese public forest (1943-‐2011). All independent variables are standardized except Year.
Model Coefficients (standard errors)
Year Fuel FWIe NFadj R1-‐6 ARlag2 AICc R2
logBA1 0.027 (0.006) p<0.0001 0.520 (0.144) p=0.0007 0.639 (0.096) p<0.0001 0.301 (0.115) p=0.0104 -‐ -‐ 161.7 0.797 logBA2 0.023 (0.006) p<0.0001 0.503 (0.140) p=0.0006 0.627 (0.093) p<0.0001 0.368 (0.116) p=0.0022 -‐0.192 (0.093) p=0.0421 -‐ 160.1 0.809 logBA3 0.030 (0.006) p<0.0001 0.502 (0.141) p=0.0006 0.608 (0.095) p<0.0001 0.287 (0.112) p=0.0125 0.168 (0.088) p=0.0599 160.7 0.807 dlogBA1 -‐ 0.352 (0.105) p=0.0013 0.563 (0.090) p<0.0001 0.281 (0.108) p=0.0109 -‐ -‐ 161.1 0.476 dlogBA2 -‐ 0.340 (0.102) p=0.0013 0.551 (0.088) p<0.0001 0.352 (0.109) p=0.0019 -‐0.195 (0.090) p=0.0329 -‐ 158.9 0.510 dlogBA3 -‐ 0.351 (0.102) p=0.0010 0.533 (0.089) p<0.0001 0.261 (0.105) p=0.0151 -‐ 0.180 (0.086) p=0.0390 159.2 0.508 dlogBA4 -‐ 0.341 (0.100) p=0.0010 0.528 (0.087) p<0.0001 0.323 (0.108) 0.0038 -‐0.164 (0.090) p=0.0725 0.148 (0.086) p=0.0869 158.5 0.530
4. Discussion
4.1. Fuel and fire dynamics
Biomass consumption estimates at the beginning of the study period are consistent with the nutrient mining inherent to organic mountain agriculture. We detected a consistent decreasing trend in the biomass removed by humans and their animals from the Portuguese public forest from 1943 to 2011 (Fig. 2). Contribution to fire hazard of the different processes involved is expected to be uneven. Temporal changes in fire behaviour are more likely to reflect biomass removal through agro-‐pastoral activities, as fuel wood collection (which underwent the major decrease) includes larger size material less relevant for fire spread or unavailable for combustion. Low regional variability in livestock trends over time suggests the biomass removal trend is generally representative of the study area (Torres-‐Manso et al., 2014).
Changes in biomass consumption and afforestation compounded to change fuel hazard dramatically over time (Fig. 3). Dense stands of long-‐needled pines are inherently flammable given the quality, quantity and continuity of the fuel produced and burn fast and with extreme intensity (Cruz et al., 2008; Fernandes and Rigolot, 2007). This study findings concur qualitatively with earlier assessments of the effects of land use on fuel hazard (Moreira et al., 2001; Rego, 1992) but our fire modelling approach shows how conservative those assessments were, e.g. Moreira et al. (2001) indicate a 20-‐40% increase in landscape fuel accumulation. Spatially explicit fire modelling in a 7,500-‐ha landscape within the study area revealed a 4-‐fold increase in extreme fireline intensity from 1958 to 2005 (Azevedo et al., 2011). This study results are comparable in range (5-‐fold variation in fireline intensity over the study period, Fig. S2), suggesting our assumptions and uncertainty had no significant impact on fire modelling results.
Stable or decreasing biomass consumption coincides with the fuel hazard decrease from the 1980s onwards (Fig. 3). Substantially lower fuel hazard succeeds to years with unusually large BA, e.g. 1985 and 2005, suggesting a self-‐regulated fire regime. Hence, wildfire has replaced human-‐driven biomass removal. Increased and more frequent fire activity lowered flammability through deforestation and decreased fuel loading and connectivity.
The Pettitt index identified 1952 and 1973 as points of change in the fire regime. During the first period the landscape was still largely dominated by shrubland, as substantial afforestation of common lands started in 1939 (Estêvão, 1983). The first BA shift coincides with increased fuel hazard as the pine plantations were being established. The second fire regime shift corresponds with the mid-‐1970s fuel hazard peak and was almost certainly prompted by the end of dictatorship in 1974, an assertion consistent with the abrupt increase of NF in 1974 (Fig. S1). Incendiarism in common lands can be explained by the struggle of populations to control local resources (Devy-‐Vareta, 1993) and viewed as a persistent ritual of political resistance against forest and nature conservation policies (Seijo, 2005).
The mid-‐1970s upward shift in BA identified in this study is shared with Spain (Moreno et al., 1998; Moreno et al., 2014; Pausas and Fernández-‐Muñoz, 2012). BA in most of Spain, including the NW, and elsewhere in the Mediterranean is however decreasing since the 1990s, which is credited to more effective fire prevention and suppression (Moreno et al., 2014; Turco et al., 2013b; Xystrakis and Koutsias, 2013). The trend for decreased fuel hazard in the Portuguese public forest after the 1980s (Fig. 3) would similarly point to a reduction in BA. This outcome is distinct from what Collins et al. (2013) predicted with a system dynamics analysis for Portugal under a fire suppression policy, i.e. persistently high fuel hazard on the long term. Maintenance of BA (Fig. 4, bottom panel) with increasingly lower fuel hazard hints at ineffective fire suppression. Likewise, our results suggest that a fire policy focused on fuel management would not decrease BA given the poor performance of fire suppression operations in Portugal. Fire fighting in Portugal is deficient at controlling fire growth (Beighley and Quesinberry, 2004), and its ability to benefit from fuel-‐related mitigation of fire behaviour is questionable (Fernandes et al., 2012). The observed partial dissociation between BA and fuel hazard is further explained by the trend for increasingly higher FWIe and deforestation (hence lower fire-‐suppression priority. Maintenance of BA under decreased fuel accumulation denotes a failed fire suppression policy but also generally indicates less severe fires due to diminishing heat release potential.
4.2. Burned area drivers
Depending on the modelling approach and variables included, BA equations account for 48% to 81% of total deviance. This degree of explanation is good, especially considering the scarcity of historic information about biomass use and fuel hazard and the uncertainty inherent to the estimation of fuel-‐related variables. Previous analysis had shown solid connections between fire activity in Portugal and Europe and weather-‐drought, as expressed by the FWI system (Amatulli et al., 2013; Camia and Amatulli, 2009; Carvalho et al., 2008). The observed strengthening of the BA-‐FWIe relationship after 1973 is consistent with the hypothetical transition to a weather-‐ dominated fire regime from a fuel-‐limited fire regime (Pausas and Fernández-‐Muñoz, 2012). This fire regime shift was not exclusively determined by fuel hazard, given the existing land use conflicts, but note that BA increase from 1953-‐1973 to 1974-‐2011 exceeds by a factor of two the corresponding increase in NF. Crown fires in conifer stands are beyond direct control, namely because fire-‐suppression difficulty increases exponentially with fire intensity (Alexander and Lanoville, 1989; Palheiro et al., 2006). BA shifted upwards in the new fuel and ignition context but the slope of the BA response to FWIe did not increase from 1943-‐1973 to 1974-‐2011 (Fig. 5). This suggests that current fire-‐weather relationships will hold under future climate change, unless vegetation types change (Krawchuck et al., 2009). From the management viewpoint this predictable effect is crucial, as it supports the control of fuels and ignitions as successful activities at facing extreme fire weather.
Weather-‐drought is more important than fuel in determining BA in the Portuguese public forest, as expected where productivity is high (Pausas and Paula, 2012; Pausas and Ribeiro, 2013). But our study also shows how anthropogenic forcing modifies the fire regime, through changes in ignition patterns and land use dynamics. The results suggest that prior to 1953 fuels were below some threshold of amount and continuity required by substantial fire activity, while the socially-‐motivated increase in ignitions after 1973 sparked BA in a system that had ceased to be fuel-‐limited by biomass extraction and where afforestation produced a more flammable environment. The relevance of fuel hazard to BA is either higher or comparable to NF, depending on the model fitted (Table 2).
Precipitation can have opposing effects on fire activity. BA responded positively to higher 2-‐ year lagged precipitation, as elsewhere in the Mediterranean Basin (Pausas, 2004; Koutsias et al., 2013; Turco et al., 2013a), possibly reflecting the effect of enhanced delayed plant growth on subsequent fuel loading. As in Turco et al. (2013a) and Xystrakis and Koutsias (2013), BA decreased with more precipitation in the first half of the year, which decreases the number of days during which fire can spread, delays severe fire activity and, overall, shortens the fire season; pastoral burning adds to BA but is impeded by a wet winter. Previous studies in Portugal report BA association with January to April rainfall and May rainfall, respectively positive (Pereira et al., 2005; Viegas and Viegas, 1994) and negative (Pereira et al., 2005; Trigo et al., 2006). The reasoning is that a wet winter followed by a late dry spring creates and then dries fine fuels conducive to higher fire activity. Our analysis did not support these relationships, which are based on short time series and do not control for other factors. In fuel-‐limited systems the growth and curing of herbaceous fuels reacts to precipitation anomalies and affects fire activity (Westerling et al., 2003). This is not the case of the study region, where crown fires driven by comparatively slow-‐growing woody vegetation are prevalent (Pausas and Paula, 2012). Nevertheless, the significance of antecedent precipitation in BA models was moderate (0.01<p<0.05) or merely suggestive (0.05<p<0.10). Note that the FWI already accounts for the effect of cumulative rainfall (or lack thereof) on fire behaviour (Van Wagner, 1987). The response of NPP to high precipitation levels is moderate in forest biomes (Knapp and Smith, 2001) and is dependent on rainfall patterns (Zhang et al., 2013). In the study region, NPP is more limited by solar radiation and temperature than by precipitation (Running et al., 2004); its sensitivity to climate variability is low to moderate (Moldenhauer and Ludeke, 2002); and its intra-‐annual variability is low (Alcaraz et al., 2006).
4.3. Conclusion