2019
UNIVERSIDADE DE LISBOA
FACULDADE DE CIÊNCIAS
DEPARTAMENTO BIOLOGIA VEGETAL
Structural and functional diversity of the diazotrophic
community in xeric ecosystems: response to nitrogen
availability
Carolina Cristiano de Almeida
Mestrado em Microbiologia Aplicada
Dissertação orientada por:
Prof. Cristina Maria Nobre Sobral de Vilhena da Cruz Houghton
Prof. Rogério Paulo de Andrade Tenreiro
This Dissertation was fully performed at Plant Soil Ecology at
cE3c under the direct co-supervision of Prof. Cristina Maria
Nobre Sobral de Vilhena da Cruz Houghton
Professor Rogério Paulo de Andrade Tenreiro was the internal supervisor designated in
the scope of the Master in Applied Microbiology of the Faculty of Sciences of the
University of Lisbon
I
ACKNOWLEDGMENTS
This dissertation arose from the collaboration between the Plant Soil Ecology group at cE3c and the Laboratory of Microbiology and Biotechnology at BioISI. This work would not be possible without the assistance and commitment of the individuals involved.
First, I would like to express my greatest gratefulness to Professor Cristina Cruz, for the opportunity that was given to me. Thank you for the knowledge shared and for always having an enthusiastic perspective which is contagious.
To Professor Rogério Tenreiro, thank you for welcoming me, for always pushing me to see further and for helping me to build more critical thinking. Thank you for all the knowledge shared with me, and for the ideas that help my work to go beyond what I thought was possible.
I would also like to thank all members of the PSE group for their contribution, especially to Teresa Dias who has made possible this work with the samples used as well as every soil characteristic. I am grateful to Juliana Melo and Patricia Correia for the support along with this work. To Rodrigo Maia, thank you for the data from the isotopic characterization.
To the people at the LM&B|BioISI, thank you for the support. To Professor Ana Tenreiro for all the kindness and encouragement. To Filipa Silva, thank you for keeping the laboratory up and running efficiently.
To all Bugworkers my deepest thanks, for having welcomed me as one of you, for always having a friendly word, for all the ideas that led me to create a new perspective and for all the knowledge you shared with me. I am thankful to Ana, Pedro, André, Beatriz and João for the support, for all the patience, kindness, knowledge shared with me. Mariana thank you for not giving up to give me hugs at the end of the day and for the new perspective that you bring. Inês I could not more grateful for all your support and especially patient with me, for not giving up after the first panic face and for helping me grow this last year.
To all my friends thank you for the help and compassion. A special thank you to Maria, Patricia, and Catarina for sharing this journey with me, for the longs the hours of motivation and encouragement and for enduring my irritations.
Lastly and foremost, a huge thank you to my parents and my brother, for all the support, for all the love and for helping me grow. Thank you for allowing me to follow my dreams, to encourage me to dream higher and for always believing in me even when I do not believe. I owe everything to you.
II
ABSTRACT
The effects of increased nitrogen (N) input in the ecosystems have brought concern for some time, however, the long-term consequences of this input to Mediterranean ecosystems are poorly studied. The Mediterranean ecosystem is considered a hotspot of biodiversity; the Mediterranean basin was considered one of the places in the world with most biodiversity. Taking in consideration that these ecosystems are regarded as environments under N limitation, changes in N availability will alter the relationships between the organisms. The research presented here was carried out on the Mediterranean basin and it is part of an ongoing study over the last 10 years, in which fields were fertilized with different quantities and forms of N. To understand the consequences of this fertilization, diazotrophic bacteria were isolated from rhizospheric soil of Ulex densus subjected to different N addition and characterized in terms of the structural and functional diversity of the communities, using this community as an ecological marker for comparing the different treatments.
The methodology applied to understand the ecological consequences was the isolation of the rhizospheric bacteria in N free media and characterization of this collection of isolates, in terms of diversity (phenotypic and genotypic), morphophysiology (distribution of the isolates by different morphotypes), structure (identification of the genera associated with the treatments), functionality (ability to perform ammonification, nitrification and/or denitrification) and metabolic plasticity (ability to use different carbon sources). The N fixation of these isolates was confirmed by their growth in solid and liquid N free media and by isotopic characterization of the ratio of 15N over 14N; a search for the
nifH gene was also performed.
For this community there were no differences in diversity nor at the morphophysiological level between the different treatments. However, a higher number of isolates was detected in the treatments with higher NH4+ inputs (40A, and 80AN). The ability to perform N fixation was confirmed through multiple passages in solid and liquid N-free media and nifH gene was detected through PCR and dot-blot hybridization, though this was not possible for every representative isolate. Differences with genera associated with the form and quantity of N added to the soil were observed, with some genera only appearing in certain treatments. Every isolate presented more than one function in the N cycle and a decrease in nitrification together with an increase of denitrification was observed along with the increase of bioavailable N. Isolates belonging to genera detected exclusively in treatment 80AN presented higher N content and higher denitrification rates. The variation of the metabolic plasticity between the treatments increased with N fertilization, since the control treatment had the more consistent response for metabolic plasticity.
The increase on the isolates number followed the same pattern as the proliferation of U. densus, showing that the potential for N fixation was not inhibited by NH4+ addition. The differences in genera associated with the treatments evidenced a change in the structure of the community. The results of multifunctionality showed a shift in the diazotrophic community, since nitrification and denitrification presented specificity towards different forms of fertilization. The higher variation of the metabolic plasticity associated with N fertilization can be related to changes in carbon source availability in the soil.
From the work presented here and future work can arise a platform to direct alterations on the agriculture and ecological guidelines. These alterations are essential to protect this kind of ecosystem, which is extremely important due to the unique biodiversity associated with it.
Keywords: N fixation, Mediterranean ecosystems, N fertilization, Multifunctionality in N cycle,
III
RESUMO
Há algum tempo que os efeitos do aumento de nitrogénio (N) introduzido nos ecossistemas leva a preocupação, no entanto, as consequências a longo prazo desta introdução nos ecossistemas mediterrânicos estão pouco estudadas. O ecossistema mediterrânico é considerado um hotspot de biodiversidade; a bacia mediterrânica é um dos locais com mais biodiversidade no mundo. Tendo em consideração que estes ecossistemas são considerados ambientes com limitações ao nível do N, as mudanças na disponibilidade de N vão alterar as relações entre os organismos. O estudo aqui apresentado foi levado a cabo na bacia mediterrânica e faz parte de um estudo que já começou há 10 anos e continua a ser efetuado, em que os talhões foram fertilizados com diferentes formas e quantidades de N. De forma a entender as consequências desta fertilização, foi isolada a comunidade de bactérias diazotróficas a partir de solo rizosférico de Ulex densus sujeito a diferentes adições de N e foi caracterizada a diversidade estrutural e funcional da comunidade. A comunidade diazotrófica foi utilizada como um marcador ecológico para a comparação entre os diferentes tratamentos.
Os microrganismos que conseguem realizar a fixação de N, ou seja, a conversão de N2 em NH3, são chamados de diazotróficos. Esta conversão ocorre através da ação da enzima nitrogenase, e existem três tipos desta enzima que variam no cofator associado: Mo, Va ou Fe.
A estrutura da comunidade diazotrófica não apresentou diferenças entre os tratamentos em termos de diversidade, no entanto o índice de diversidade genotípico apresentou um poder de discriminação maior que o índice de diversidade fenotípico entre os isolados e, portanto, é essencial complementar os resultados fenotípicos com o perfil genotípico obtido por PCR fingerprinting. Foi detetado um número mais elevado de isolados diazotróficos heterotróficos nos tratamentos com maior adição de NH4+ (40A e 80AN), estes são os mesmos tratamentos em que existe proliferação de Ulex
densus, mostrando assim que o potencial para a fixação de N não foi inibido pela adição desta forma de
N. Foram observadas diferenças entre os géneros identificados dependendo da forma e quantidade de N adicionado ao solo, mostrando mudanças na estrutura da comunidade. Para esta identificação foram escolhidos 40 representantes, sendo 10 de cada tratamento, e foram considerados uma boa representação da coleção de isolados por não apresentarem valores de semelhança superiores a 55%.
A maioria dos géneros que foram identificados estão associados com a fixação de N ou pelo menos apresentam um espécie pertencente ao género que apresenta a capacidade de realizar fixação de N. A capacidade de realizar fixação de N foi confirmada através de múltiplas passagens por meio sem N quer na forma líquida quer na forma sólida e o gene nifH foi detetado através da técnica de PCR e por hibridação dot-blot. Apesar de os isolados representantes terem sido identificados como sendo pertencentes a géneros associados com a capacidade de realizar a fixação de N e os pares de primers escolhidos serem capazes de amplificar o gene nifH dos clusters onde estes géneros estão incluídos, não foi possível amplificar e/ou detetar o gene nifH da maioria dos isolados. Isto pode significar que o gene
nifH destes isolados é diferente das sequências utilizadas para desenhar os primers.
Até há pouco tempo, era comum associar determinados grupos de microrganismos a uma biotransformação especifica do ciclo do N. Contudo ultimamente tem sido exposto que a maioria dos isolados tem potencial para realizar diversas biotransformações de N, nomeadamente combinações de fixação de N, amonificação, nitrificação e desnitrificação. Isto representa um fator extremamente importante, uma vez que a multifuncionalidade é essencial para a adaptação dos microrganismos ao meio ambiente. Os isolados representantes de cada um dos tratamentos foram testados para diferentes processos do ciclo do N: amonificação, nitrificação e desnitrificação. Todos os isolados apresentaram mais do que uma função no ciclo do N. Pode ser observada uma mudança na multifuncionalidade da comunidade diazotrófica devido ao aumento da biodisponibilidade de N. De facto, a capacidade de
IV realizar nitrificação foi encontrada mais frequentemente entre os isolados representantes da comunidade de tratamentos que recebem mais baixas quantidade de NH4+ (tratamento controlo e 40AN), o que está de concordo com o que foi reportado em estudos anteriores, em que o aumento da disponibilidade de NH4+ leva a uma inibição na nitrificação. Foi encontrada capacidade desnitrificante em todos os tratamentos, no entanto os isolados do tratamento 80AN (recebe mais nitrato) apresentaram taxas de desnitrificação mais elevadas. Taxas de desnitrificação mais elevadas podem ser relevantes como mecanismo de desintoxicação de nitrato, uma vez que elevadas concentrações de nitrato podem inibir a fixação de N.
A alteração da multifuncionalidade microbiana associada com biotransformações de N está associada a mudanças na composição da comunidade diazotrófica, sendo corroborado pelas diferenças nos géneros identificados nos diferentes tratamentos.
Com base nos resultados apresentados, é sugerido que o isolado identificado como pertencente ao género Pedobacter apresente uma sensibilidade para concentrações elevadas de N, e por isso pode ser possível que a ausência deste género possa estar associada a um aumento da disponibilidade de N. Por esta razão, este género pode ser um candidato a indicador biológico das alterações no ecossistema.
Não foi possível associar a multifuncionalidade dos isolados com a plasticidade metabólica. No entanto, quando foram analisados dois géneros comuns a diferentes tratamentos - Pseudomonas e
Stenotrophomonas - foi possível observar diferenças na resposta à adição de N. Os isolados identificados
como Pseudomonas apresentaram uma resposta uniforme ao longo dos diferentes tratamentos, correspondendo a uma elevada plasticidade metabólica. Contudo, no caso dos isolados identificados como Stenotrophomonas o mesmo já não foi observado, pois a plasticidade metabólica aumenta com o aumento da disponibilidade de N. Isto pode dever-se à adaptação destes microrganismos ao aumento da disponibilidade de N ou os isolados podem pertencer a espécies distintas com diferente plasticidade metabólica.
Apesar de ser possível identificar algumas diferenças entre os tratamentos em termos das propriedades funcionais da comunidade, estas diferenças não são tão evidentes como seria de esperar, de acordo com a literatura, e não corroboram completamente a teoria de que a comunidade diazotrófica devia ser afetada pela adição de N. Estas discrepâncias podem dever-se ao ecossistema que está a ser estudado, o ecossistema mediterrânico, que apresenta características distintas dos outros ecossistemas estudados em trabalhos semelhantes, e por isso os efeitos da adição de N podem não ser os mesmos.
Por último, a comunidade escolhida neste trabalho como indicador das respostas do ecossistema, a comunidade diazotrófica, pode não ter sido a escolha certa, uma vez que não se verificam grandes alterações estruturais com o aumento da biodisponibilidade de N. A comunidade estudada foi isolada a partir do solo rizosférico de Ulex densus que é uma espécie que prolifera nos tratamentos com maior disponibilidade de N. Desta forma a planta pode estar a contrabalançar os efeitos da adição de N levando a que não haja diferenças na comunidade diazotrófica entre os tratamentos. Pode ainda ser o facto de a comunidade rizosférica conseguir aguentar as pressões ecológicas e manter este grupo de microrganismos, uma vez que estes apresentam uma função importante que pode ser benéfica para a comunidade rizosférica quando em condições de N limitante.
O trabalho apresentado neste estudo, e trabalho futuro que possa advir dele, pode criar uma plataforma para alterações nas políticas agrícolas e ambientais, que são necessárias para a preservação deste tipo de ecossistemas que apresentam uma biodiversidade única.
Palavras-chave: Fixação de N, Ecossistemas mediterrânicos, Fertilização com N, Multifuncionalidade
V
INDEX
1.1. An overview of the nitrogen cycle 1
1.2. Nitrogen fixation 2
1.2.1. Nitrogenase 3
1.2.2. The nif, anf and vnf gene cluster 4
1.2.3. nifH phylogeny 6
1.3. Multifunctionality in the N cycle 7
1.3.1. Nitrification 7
1.3.2. Denitrification 8
1.3.3. Ammonification 9
1.4. Imbalances of N input in ecosystems 9
1.5. Mediterranean ecosystems 12
2.1. Experimental design and soil sampling 17
2.2. Sample treatment 17
2.3. Selective isolation of nitrogen fixers 18
2.4. Isolate characterization 19
2.5. Representative isolates and sequencing 20
2.6. nifH gene detection 21
2.6.1. PCR approach 21
2.6.2. Dot-blot hybridization 23
ACKNOWLEDGMENTS I
ABSTRACT II
RESUMO III
FIGURES INDEX VII
TABLES INDEX VIII
EQUATIONS INDEX IX
ABBREVIATIONS X
1. INTRODUCTION 1
VI
2.7. C and N isotopic analysis 26
2.8. Multifunctionality assay 26
2.9. Metabolic profiling 27
3.1. Morphophysiological and genotypic analysis 29
3.2. Genera associated with the diazotrophic community 32
3.3.1. nifH gene search 34
3.3.2. N isotopic analysis 35
3.5. Multifunctionality in the N cycle 39
3.6. Metabolic plasticity 43
3.7. Integrative analysis 46
Appendix A: Dendrograms of the isolates with representative isolates selection 63
Appendix B: Dendrograms of the representative isolates. 67
Appendix C: 16S rRNA gene sequencing results. 67
Appendix D: Table with the compilation of data for the primers most used for the PCR search of
nifH gene. 72
Appendix E: Graphic representation of the calibration curves for calculation of NH4+ and NO2
-concentration. 73
Appendix F: Table with the representative isolates and the results of denitrification (yellow), nitrification (dark blue) and ammonification (dark grey) for selection of the 20 isolates for the
assay of metabolic plasticity. The numbers in red are the chosen for the group of 20. 74
Appendix G: Analysis of the explanatory variables for PC1, PC2 and PC3 74
Appendix H: Table with Ecoplate substrates in categories according to respective
characteristics. 76
2.10. INTEGRATIVE DATA ANALYSIS 28
3. RESULTS AND DISCUSSION 29
4. CONCLUSIONS AND FUTURE PERSPECTIVES 48
REFERENCES 50
VII
FIGURES INDEX
Figure 1.1: Nitrogen cycle. 1
Figure 1.2: MoFe-nitrogenase complex. 3
Figure 1.3: Scheme of the structural genes of the three types of nitrogenase. 4
Figure 1.4: Organization of Mo, V, and Fe nitrogenase gene clusters in A. vinelandii. 5
Figure 1.5: Neighbor-joining phylogenetic tree constructed from 16S rRNA gene sequences for
the microbial genomes used in this analysis. 5
Figure 1.6: Overview of five phylogenetic groups shown on a concatenated phylogenetic tree
composed of nifH and nifD homologs found in complete genomes. 7
Figure 1.7: Illustration of the nitrogen (N) cascade. 10
Figure 1.8: Representation of the location where mediterranean climate is present. 12
Figure 1.9: Graphic representation of the soil samples relative to the characteristics evaluated. 14
Figure 1.10 Scheme of the analytical workflow for the soil samples. 16
Figure 2.1: Experimental scheme of the plots in the field and the sampling scheme for the soil
samples. 17
Figure 2.2: Schematic representation of the hybridization procedure. 25
Figure 2.3: Scheme of the carbon sources in the Ecoplates form the Ecoplates manual. 27
Figure 3.1: Flowchart used for differentiation of the isolates into different morphophysiological types using cell morphology, Gram staining and catalase and oxidase tests and
endospore-forming ability. 29
Figure 3.2: Graphic representation of the total number of isolates per treatment, the distribution of these isolates in the morphophysiological groups and the phenotypic and genotypic
diversity indices - Shannon-Wiener and Simpson - of each treatment. 30
Figure 3.3: Graphic representation of genus level isolate identification by 16S rRNA gene
sequencing, and the distribution of these genera per treatment. 33
Figure 3.4: Representation of the results from IRMS for the δ15N for the representative isolates
per treatment. 36
Figure 3.5:: Representation of the results from IRMS for the C/N or the representative isolates
for each treatment 38
Figure 3.6: Graphic summarizing the multifunctionality data. 40
Figure 3.7: Graphic representation of the N cycle and the transformations within. 42
Figure 3.8: NAUC values of the Ecoplate substrates for each treatment. 44
Figure 3.9: NAUC values of the Ecoplate substrates for each isolate from the Pseudomonas and
Stenotrophomonas genera. 45
Figure 3.10: Principal Component Analysis of the results from the multifunctionality assays for denitrification, nitrification and ammonification, the isotopes analysis and the metabolic
VIII
TABLES INDEX
Table 2.1: Compilation of different primers for the nifH gene identification. 21
Table 2.2: PCR conditions for the set of primers IGK and nifh3, with the different conditions
tested. 22
Table 2.3: PCR conditions for the set of primers IGK3 and DVV, with the different conditions
tested. 22
Table 2.4: PCR conditions for the set of primers F2 and R6, with the different conditions tested. 23 Table 2.5: Homology values (percentage of identity) of the probe with the different genera
IX
EQUATIONS INDEX
Equation 1.1: Nitrogen fixation reaction. 2
Equation 1.2: Denitrification process. 8
Equation 1.3: Ammonification reaction. 9
Equation 2.1 : Calculation of Shannon diversity index (H’). 20
Equation 2.2: Calculation the H’max. 20
Equation 2.3: Calculation of J’. 20
Equation 2.4: Calculation of Simpson’s diversity index (D). 20
Equation 2.5: Calculation of probe optimal hybridization temperature according to GC content
and percent homology of probe to target. 24
Equation 2.6: Calculation of probe optimal hybridization temperature with DIG Easy Hyb
X
ABBREVIATIONS
Anammox - Anaerobic ammonium oxidation AOA - Ammonia-oxidizing archaea
AOB - Ammonia-oxidizing bacteria ARA - Acetylene reduction assay AUC - Area under curve
BCIP – 5-bromo-4-chloro-3'-indolyphosphate
p-toluidine salt
BNF - Biological nitrogen fixation DIG - Digoxigenin
DNRA - Dissimilatory nitrate reduction to
ammonium
EDTA - Ethylenediamine tetraacetic acid GES - Guanidium thiocyanate, EDTA,
Sarkosyl
GH - Greenhouse effect
IRMS - Isotope-ratio mass spectrometry NAR - Nitrate reductase
NAUC - Net area under curve NBT – Nitro-blue tetrazolium
NCBI - National center for biotechnology
information
NFB - Nitrogen free broth NIR - Nitrite reductase
NOB - Nitrite-oxidizing bacteria NOR - Nitric oxide reductase NOS - Nitrous oxide reductase Nr - Reactive nitrogen
OM - Organic matter
PBS - Phosphate buffer saline PC - Principal component
PCA - Principal component analysis PCR - Polymerase chain reaction PM - Particulate matter
RO-Water – Reverse osmose purified water SDS - sodium dodecyl sulfate
SIIAF - Stable isotopes and instrumental
analysis facility
SPW - Sterile pure water SSC - saline-sodium citrate TBE - Tris-borate-EDTA TE – Tris-EDTA
TSA - Tryptone soy agar
UPGMA - Unweighted pair group method with
1
1. INTRODUCTION
1.1. An overview of the nitrogen cycle
The nitrogen (N) cycle is one of the most important cycles in the ecosystems, given that sustainability of several environments is maintained by the accessibility of N. This element, in the form of dinitrogen (N2), is the most abundant in Earth’s atmosphere, however, in this form it is unavailable to most organisms. For N to become bioavailable, its conversion to reactive N is necessary. Reactive nitrogen (Nr) is a designation that includes inorganic reduced forms of N such as ammonia (NH3) and ammonium (NH4+), inorganic oxidized forms that can be nitrogen oxides (NOx), nitric acid (HNO3), nitrous oxide (N2O), nitrite (NO2-) and nitrate (NO3-) and organic compounds like urea, amines, proteins and nucleic acids (Galloway et al., 2004; Thamdrup, 2012).
The bioavailability of N mostly depends on the action of microorganisms, either through the reaction for the conversion of biological unavailable N (N2) into a bioavailable form (NH3) or the conversion of a bioavailable form, like NH3, into other kinds of bioavailable forms, such as NO3- or NO2 -(Stein and Klotz, 2016).
The flux of N through the distinct ecosystem compartments, regularly called the biogeochemical N cycle, is mostly mediated through bioconversions which can be clustered in seven different processes (Figure 1.1): nitrogen fixation, nitrification, denitrification, anammox, assimilation, ammonification and dissimilatory nitrate reduction to ammonium (DNRA). The N cycle can be envisioned by starting with the transformation of a N2 molecule into NH3 through N fixation, the NH3 produced will integrate the biomass of growing organisms and will be released after their death and/or decomposition of the organic matter produced through ammonification processes, followed by nitrification, with the transformation to NO2- and of this to NO3-. The denitrification process will transform NO3- to NO2-, NO2 -to nitric oxide (NO), NO -to N2O and this -to N2. Each one of these processes is carried out by different groups of microorganisms (Kuypers, Marchant and Kartal, 2018).
Figure 1.1: Nitrogen cycle. Adapted from Kuypers, Marchant and Kartal (2018)
Dissimilatory nitrate reduction to
ammonium (DNRA) 13
2 The processes that make up the N cycle are not evenly distributed in space and in time. This is due to the different conditions necessary for each process to occur, as well as the microorganisms that are involved in each process. These microorganisms have specific requirements for pH, oxygen (O2) concentration, and different N and carbon (C) source preferences. This, together with the anthropogenic input of N forms into the cycle, leads to an imbalance and to the accumulation of these compounds in the environment, given that the recycling of N, by its return to N2 form, is only possible by the processes of denitrification and anammox (Smil, 2001; Vitousek et al., 2002; Galloway et al., 2004; Karl and Michaels, 2019).
Anthropogenic action has led to an increase in the quantity of N added to the environment, especially with leguminous cultures, production of fossil fuels and the addition of fertilizers to the soil. These fertilizers use Nr forms, usually NH4+, and this input of N in the soil has consequences (Watson, Valois and Waterbury, 1981).
1.2. Nitrogen fixation
The reaction where N2 is reduced to NH3is designated by biological nitrogen fixation (BNF) and it is achieved by the enzyme nitrogenase, as presented in Equation 1.1. In this process, energy in the ATP form is necessary to compel N2 to merge with Hydrogen (H) to create NH3. This way, NH3 can be used as an N source or it can be converted to NO3- (Rascio and la Rocca, 2008; Lindström, Aserse and Mousavi, 2015).
8 H+ + N2 + 16 ATP + 16 H2O H2 + 2 NH3 + 16 ADP + 16 Pi
Equation 1.1: Nitrogen fixation reaction.
BNF is considered one of the most primordial enzyme-catalyzed reactions and it is a vital component of the N cycle. The microorganisms that can perform this conversion are termed diazotrophs and are exclusive of the archaeal and bacterial domains. This ability is widely distributed and must have occurred early in prokaryotic evolution, to provide the N needed in the increased microbial biomass (Towe, 2002; Raymond et al., 2004).
Diazotrophs can have different types of metabolic strategies, as well as different relationships with O2 - they can be obligate or facultative anaerobes or aerobes. They can establish a symbiotic relationship, develop associative relationships with different organisms in the ecosystem or be free-living organisms in different environments as referred in Gaby and Buckley (2015).
Nitrogenase, being an enzyme deeply sensitive to O2, requires fixation to occur in anaerobic conditions, which is not an obstacle for microorganisms that can grow in the absence of O2. However, the obligate aerobes had to provide strategies to surpass this restriction. For example, Azotobacter vinelandii is a strict aerobe that erases the O2 traces with an increased aerobic respiration rate, to guarantee an anoxic environment in the interior of the cell. Cyanobacteria, being autotrophic microorganisms had to develop other strategies: one of them is the formation of specialized cells called heterocysts, that have an anoxic environment, which allows nitrogen fixation to occur; another is the temporal and spatial separation of the photosynthesis process from the N fixation process
3 (Poole and Hill, 1997; Berman-Frank et al., 2001; Peters and Boyd, 2015; Poza-Carrión, Echavarri-Erasun and Rubio, 2015).
Some diazotrophs, most of them from the alpha or betaproteobacteria class, designed a symbiotic association with plants. This relationship is profitable for both, since the plant provides a particular place with low O2 concentration, the nodule, to allow N fixation, and provides C sources to bacteria. In return, microorganisms provide N, in the form of NH3, to the plant, which is fundamental to its growth. There are also symbiotic relationships between members of the Frankia genus and actinorhizal plants, as well as between cyanobacteria and some plant genera, but these are less established and investigated (Osborne and Bergman, 2008; Franche, Lindström and Elmerich, 2009; Lindström and Mousavi, 2010).
Associative nitrogen fixation is a beneficial relationship, but not obligatory, between diazotrophs and some plants, where there is no colonization of the plant cytoplasm. This relation is common with Proteobacteria and can include Firmicutes members, like Paenibacillus species (van Dommelen and Vanderleyden, 2007).
1.2.1. Nitrogenase
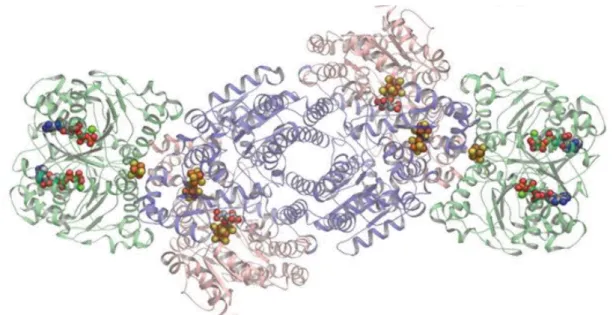
Nitrogenase is the enzyme responsible for the transformation of N2 towards NH3, during which H2 is released, reducing the efficiency of the reaction. There are three different types of this enzyme depending on the cofactor employed, which can be Molybdenum (Mo)-Iron (Fe), Vanadium (V)-Fe or Fe-Fe. This enzyme has two components: the first component has two subunits, denominated α, and β, and the second component is formed by a Fe-protein with two equal subunits, as presented in Figure 1.2. Microorganisms can have different combinations of the enzyme types or even have the three types, like the case of Azotobacter vinelandii, although every N-fixing microorganism has the MoFe-nitrogenase (Hausinger and Howard, 1983; Rees and Howard, 2000).
Figure 1.2: MoFe-nitrogenase complex. MoFe protein subunits in salmon (α subunits) and blue (β subunits) at the center with two Fe proteins (green) bound on each end (Danyal et al., 2016).
The MoFe-nitrogenase has molybdenum (Mo) as its cofactor and the genes encoding for the architectural components are nifD, nifK, which form the catalytical part of the enzyme, and nifH,
4 encoding for the dinitrogenase reductase subunit (Fe-protein). This enzyme is the most efficient in reducing N2 into NH3 and with lower H2 production, therefore microorganisms preferably express the genes for this enzyme (Simpson and Burris, 1984; Eady, 1996; Glazer, Kechris and Howard, 2015).
The MoFe protein contains two metal clusters: one is the MoFe cofactor which gives the active site for substrate attachment and reduction and the other one is the Phosphorus (P)-cluster which is involved in the transference of electrons from the Fe protein to the MoFe cofactor (Burgess, 1990; Kim and Rees, 1992; Peters et al., 1995; Hoffman et al., 2014).
Nitrogenase has the ability to reduce other triply bonded small molecules beside N2 such as acetylene, azide, and cyanide (Berges and Mulholland, 2008).
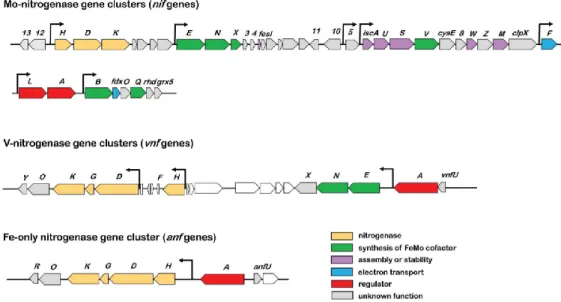
Alternative nitrogenases can be VFe-nitrogenase or FeFe-nitrogenase, and the genes encoding for these enzymes are vnfD, vnfK, vnfH, and anfD, anfK,anfH, respectively, as shown in Figure 1.3. These enzymes require the hydrolysis of more ATP molecules per nitrogen fixed, between 24-48 ATP versus 16 ATP for MoFe-nitrogenase (Galloway et al., 2004; Glazer, Kechris and Howard, 2015).
Figure 1.3: Scheme of the structural genes of the three types of nitrogenase.
1.2.2. The nif, anf and vnf gene cluster
For the synthesis of the MoFe-nitrogenase, there are quite a few genes implicated, which are crucial, not only for the creation of the nitrogenase complex but also for the catalytic metal cofactor biosynthesis. There are two clusters of nif: the major cluster comprises five transcriptional units which include nifHDKTY and nifENX; the minor cluster holds three operons, with nifLA being one of them, as presented in Figure 1.4. These genes are relevant because they form a complex, nifA-nifL-GlnK, which regulates nif gene expression (Jacobson et al., 1989; Martinez-Argudo et al., 2004).
The architectural genes for MoFe-nitrogenase nifH, nifD and nifK are in the major cluster and, although they are transcribed from the same promoter as nifT and nifY, the levels of transcription are up to 70-fold higher for the structural genes. Although all three genes, nifH, nifD, and nifK, are vital to nitrogenase arrangement, the transcript levels of nifH are higher than those of nifDK, which is related to the stoichiometry of nitrogenase component proteins (Hamilton et al., 2011; Poza-Carrión, Echavarri-Erasun and Rubio, 2015).
5
Figure 1.4: Organization of Mo, V, and Fe nitrogenase gene clusters in A. vinelandii. Adapted from Mus et al. (2018).
The organization of the vnf gene cluster differs from the nif organization, seeing as the vnfH is in an operon distinct from the operon that contains vnfDGK. The vnfG encodes for the γ-subunit which does not exist in MoFe-nitrogenase. The vnf gene cluster contains the vnfENX operon homologous to
nifENX. The anf gene cluster is organized as a single operon anfHDGK and anfG encodes for the same
subunit as vnfG. The vnfA and anfA have regulatory properties similar to nifA, as shown in Figure 1.4 (Joerger et al., 1989; Waugh et al., 1995; Mus et al., 2018).
In Figure 1.5 is presented the 16S rRNA gene phylogenetic tree and the distribution of the diazotrophic microorganisms in the groups formed.
Figure 1.5: Neighbor-joining phylogenetic tree constructed from 16S rRNA gene sequences for the microbial genomes used in this analysis. Diazotrophic genomes, as determined by the presence of nifHDKEN operons, are indicated with bold lines
6 1.2.3. nifH phylogeny
BNF is a process observed in bacteria and a limited group of archaea - the methanogenic archaea - but has not been detected in eukaryotes. This is a function that is broadly dispersed, both taxonomically and ecologically (Raymond et al., 2004; Boyd et al., 2011).
Of all the genes associated with this function, the most frequently sequenced one is nifH and it has been used as a marker gene to detect diazotrophic microorganisms, with applications in ecology and diversity comparisons. This choice is based on its structural function, which encodes for the Fe protein present in every type of nitrogenase and independent of the cofactor utilized. This characteristic makes it a conserved gene and one of the most ancestral genes in the history of gene evolution (Young, 1993; Ueda et al., 1995; Zehr et al., 2003).
The nifH gene was used on phylotype investigations where it was settled that nifH phylogeny can be divided into five clusters (Zehr et al., 2003; Raymond et al., 2004; Boyd et al., 2011).
Cluster I essentially holds bacterial nifH and some vnfH sequences from aerobes and facultative anaerobes. Cluster II is composed of bacterial and methanogenic archaeal anfH sequences. Cluster III is comprised of nifH sequences of anaerobic bacteria plus archaea. Cluster IV includes nifH paralogs with no purpose in nitrogen fixation found. Cluster V holds paralogs of nifH implicated in the synthesis of bacteriochlorophyll. These groups are presented in Figure 1.6 (Chien and Zinder, 1996; Glazer, Kechris and Howard, 2015).
7
Figure 1.6: Overview of five phylogenetic groups shown on a concatenated phylogenetic tree composed of nifH and nifD homologs found in complete genomes (Raymond et al., 2004).
1.3. Multifunctionality in the N cycle
Diazotrophic microorganisms can perform other functions of the N cycle, such as heterotrophic nitrification, denitrification, and ammonification. These functions are activated when the microorganisms are exposed to certain environmental conditions that induce changes in the normal metabolism, such as high NO3- or NH4+ concentration, lower soil pH and high rates of C/N ratio (Thomas, Lloyd and Boddy, 1994; Princic et al., 1998; Wang et al., 2013; Svehla et al., 2014).
1.3.1. Nitrification
Autotrophic nitrification is a chain of two biological oxidation processes, from NH3 to NO2- and NO2- to NO3-, mediated by two groups of microorganisms as their energy acquiring process. The first process is realized by ammonia-oxidizing bacteria (AOB) or by ammonia-oxidizing archaea (AOA). The second process is the oxidation of NO2- to NO3- which includes another category of microorganisms, the nitrite-oxidizing bacteria (NOB) (Nunes-Alves, 2016; Cáceres, Malińska and Marfà, 2018).
8 Heterotrophic microorganisms, such as diazotrophs, can perform another type of nitrification, heterotrophic nitrification. Heterotrophic nitrification is the transformation of organic and inorganic N (NH3) forms to generate NO3- by some genera of bacteria. This form of nitrification is not coupled to energy conservation and the enzymes involved differ from the ones of autotrophic nitrification (Prosser, 2007; Shoda, 2017).
This process seems to be significant in environments with low pH values since it is a process less impacted by these conditions than autotrophic nitrification (Braker and Conrad, 2011; Pajares and Bohannan, 2016).
Nitrification utilizes NH3as the substrate for the process, so the accumulation of this form of N through the addition of fertilizers will promote the occurrence of nitrification. This leads to economic problems, because of the lower N fertilizer yield, requiring increases in N fertilizer inputs to compensate the yield and decreasing N use efficiency. Nitrification product, NO3-, has consequences in the ecosystem, such as its lixiviation, which occurs because of its negative charge, which does not favor the formation of aggregates with soil particles. This way it leaches away more easily than NH4+ and this accumulation of NO3- in watercourses leads to their eutrophication (Menéndez et al., 2012; Beeckman, Motte and Beeckman, 2018).
1.3.2. Denitrification
Denitrification is the sequential dissimilatory reduction of the ionic nitrogen oxides, NO3- or NO2-, to gaseous oxides, such as NO and N2O, and these forms can be additionally reduced to N2, as shown in Equation 1.2. This process is an anaerobic respiratory pathway that can be performed by aerobic bacteria, in conditions of O2 deficiency, or can be performed as a way of cellular detoxification, in environments with an excess of NO3- or NO2-. This is a process with lower energy profit than oxygenic respiration, making denitrification only efficient in low O2 concentrations (Knowles, 1982; Lu, Chandran and Stensel, 2014).
NO3- NO2- NO N2O N2
Equation 1.2: Denitrification process. NAR stands for nitrate reductase, NIR for nitrite reductase, NOR for nitric oxide reductase and NOS for nitrous oxide reductase.
Denitrification is a widely spread process, that can occur in terrestrial as well as aquatic systems (Skiba, 2008).
Microorganisms can have the ability to perform denitrification and N fixation (Kloos et al., 1995). These two processes are usually temporally separated, however, their regulation is extremely important to maintain the N cycle fluxes balanced (Joye and Paerl, 1994; Fan, Bolhuis and Stal, 2015).
The widespread distribution of denitrifying genes can be the outcome of their cooccurrence with N fixation and can have arisen by divergence and lineage sorting and horizontal transfer events (Jones et al., 2008; Alvarez et al., 2011; Levy-Booth, Prescott and Grayston, 2014).
Microorganisms can use this process as a way to detoxify when under a high concentration of NO3- or NO2-, including diazotrophs (Hopkinson and Giblin, 2008; Strock, 2008).
9 Denitrification can be important to diazotrophs because NO3- is an inhibitor of nitrogenase, so it is essential to decrease inhibitory concentrations of this N form to allow N fixation to happen (Carroll and Gresshoff, 1983; Luciński, Polcyn and Ratajczak, 2002).
With the increase in NO3- concentration by N deposition, there is an increase in the denitrification process. Denitrification can lead to different problems, such as loss of N fertilizers, when they are applied in this form, and atmospheric consequences by the production of NO and N2O (Hagman et al., 2008; Portmann, Daniel and Ravishankara, 2012; Lu, Chandran and Stensel, 2014).
1.3.3. Ammonification
Ammonification is the process by which organic N is converted into inorganic N in the forms of NH3 or NH4+, as presented in Equation 1.3. Microorganisms derive energy from this metabolic process. Ammonification is a very widespread process in various environments (Hopkinson and Giblin, 2008; Strock, 2008) .
R-NH2 + HOH NH3 + R-OH
Equation 1.3: Ammonification reaction.
1.4. Imbalances of N input in ecosystems
The natural processes through which Nr species are created in an ecosystem are via BNF or by lightning. Before the industrial revolution, N introduction in the soil occurred anthropogenically through food production - the legume production increases N input due to their association with N-fixing microorganisms - or through energy production, with NO emissions as a waste product of fossil fuel combustion (Vitousek et al., 1997; Smil, 2001).
With the exponential growth of the population, the demand for food production substantially increased the need for a process that produced a bioavailable form of N. This method was possible in 1913, by producing NH3 from N2 and H2, by the Haber-Bosh process (Aber, 1998).
The artificial synthesis of NH3 drastically amplified the Nr added anthropogenically, and the increase of these compounds had several consequences, some of which are yet to be unraveled. The results of increased Nr concentration can increase ecosystem productivity in the short term, however, in the long term it can lower productivity. These changes can lead to a loss in ecosystem diversity, through acidification and eutrophication, which leads to imbalances in the biogeochemical cycles (Matson, Lohse and Hall, 2002; Vitousek et al., 2002; Galloway et al., 2003; Karl and Michaels, 2019).
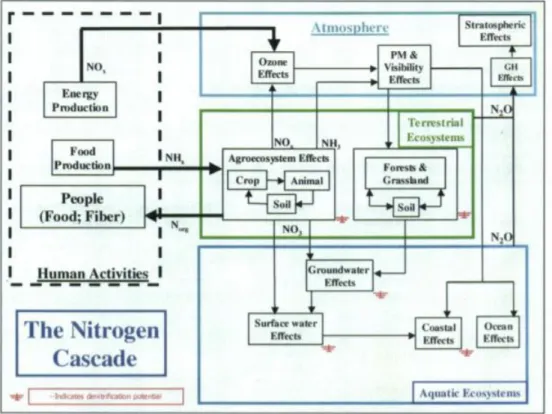
10 The problems to the environment can occur in succession, referred to as nitrogen cascade, presented in Figure 1.7, which is described as “the sequential transfer of Nr through environmental systems, and which results in environmental changes, as Nr moves through or is temporarily stored within each system” (Galloway et al., 2003). These problems arise from the accumulation of Nr in the environment because of the increase in the Nr input rate over the Nr removal rate, which is projected to continue to grow (Wang et al., 2019).
Figure 1.7: Illustration of the nitrogen (N) cascade showing the sequential effects that a single atom of N can have in various reservoirs after it has been converted from a nonreactive to a reactive form. Abbreviations: GH, greenhouse effect; PM,
particulate matter (Galloway et al., 2003).
The phenomenon of the atmospheric deposition of N can occur in two ways: by dry deposition, which is the uptake at surface level, such as soil, water or vegetation; or by wet deposition, which is the absorption of the gaseous forms into droplets, followed by the precipitation of these droplets (Zannetti and Zannetti, 1990; Pacyna, 2008).
The N use efficiency is a crucial factor in these ecosystems and consists of two parameters: the N uptake efficiency, which is the ability to take up N from the soil, and the use efficiency of the absorbed N, the efficiency with which organisms use the absorbed N to grow (Burns, 2006; Schenk, 2006).
As a result of the anthropogenic alterations to the N cycle, N deposition is increasing, leading to severe consequences to the ecosystems. N deposition has led plant communities in Europe and North America to shift their composition, which can result in a loss in plant diversity, as well as diversity loss of the associated microorganisms (Bobbink et al., 2003; de Vries, Reinds and Vel, 2003; Kleijn et al., 2008; Ochoa-Hueso et al., 2011).
N deposition effects on plants depend on a series of factors, such as time, overall quantity and N form of the contribution, sensitivity of the plant species and abiotic circumstances of the ecosystem. These factors will promote different series of events, however, some effects are common such as: acidification of the soil, by the accumulation of sulfur compounds; decrease in plant resistance due to
11 stress; and toxic effects to susceptible plant species by N forms, such as NH3 (Lee and Jose, 2003; LeBauer and Treseder, 2008; Yuan and Chen, 2012, 2015).
Previous studies on simulated N fertilization have shown that atmospheric N deposition can increase plant aerial and radicular growth. However, excessive N availability leads to soil acidification and decreased enzymatic activity, reducing soil organic matter decomposition, as well as reducing microbial respiration. N deposition can result in a reduction of the diversity of terrestrial plants, as well as alterations on C, N and P cycles (Lee and Jose, 2003; LeBauer and Treseder, 2008; Yuan and Chen, 2012, 2015).
The acidification of the soil can lead to the loss of base cations and Aluminum (Al) mobilization. This can result in alterations in soil chemistry, affecting soil food webs. The Al resulting from soil pH decreasing is toxic to soil microorganisms (Vitousek et al., 1997; Matson et al., 1999; Chen et al., 2019). The excessive amount of N added to the soil leads to changes in the prevalent microbial strategies, altering the microbial community, as well as the extracellular enzyme activity. A continuous N addition leads to ectomycorrhizal fungi suffering a decline and to the saprotrophs relative abundance increasing (Saiya-Cork, Sinsabaugh and Zak, 2002; Ramirez, Craine and Fierer, 2012; Morrison et al., 2016).
The increase of the harmful effects of N addition on total microbial biomass, bacterial biomass, as well as microbial C, is more intense over time. A meta-analysis has shown an average decline of 15% on soil microbial biomass, being these results more pronounced in long term studies, as well as studies with elevated amounts of N addition to the soil (Pregitzer et al., 2007; Treseder, 2008; Lu et al., 2011; Ramirez, Craine and Fierer, 2012).
These effects are more notorious in microbial groups associated with N transformations, in particular diazotrophs, which, with N deposition, no longer have a competitive advantage in the community, since their input of Nr is no longer necessary.
N fixation is not energetically cost-effective so when conditions change and N availability increases, they switch off the process. However, this may not occur depending on the concentration of dissolved organic C, pH and the C/N ratio (Arp and Zumft, 1983; Cejudo and Paneque, 1988).
Although N deposition has inhibitory effects on nitrogenase action, studies have shown that when N availability decreases it is possible to reverse this process. However, it is unknown if that is still the case with chronic N addition to the soil (Reed, Cleveland and Townsend, 2011; Rousk, Jones and DeLuca, 2013).
For symbiotic diazotrophs, their association with plants is also affected by N deposition, since the plant has accessible N, so the association with the microorganisms is neglected. In short term, there is a reduction in nodule formation and in the case of NO3--based fertilizer, nodule biomass, as well as its number, can be reduced along with nitrogenase activity (Bond and Mackintosh, 1975; Streeter and Wong, 1988; Wang et al., 2018).
The negative effects of chronic N addition occur independently of the amount of N added to the soil, as well as the type of ecosystem, such as tundra, meadow, woodland, swamps and croplands, however, these effects on warmer environments are attenuated on a few levels (Zhang, Chen and Ruan, 2018).
12
1.5. Mediterranean ecosystems
Mediterranean-type ecosystems are the result of Mediterranean climate, described by hot dry summers and mild wet winters. Spring and autumn are considered the growing seasons and this climate is characterized by the presence of temperate natural and annual semi-natural grasslands, shrublands, dry woodlands, and forests (Cowling et al., 1996; Myers et al., 2000).
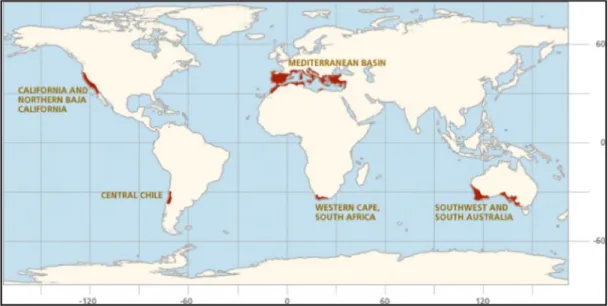
There are five zones on Earth where the Mediterranean ecosystem can be found: California, central Chile, Mediterranean Basin, southern Cape region and southwestern and southern Australia, as shown in Figure 1.8. There are some ecosystems exclusive of Mediterranean basins, like Portuguese
matos and montados, Spanish matorrales, garrigas and dehesas, Italian macchias and Greek phryganas
(Blondel, 2006).
Figure 1.8: Representation of the location where mediterranean climate is present
(https://www.iucn.org/commissions/commission-ecosystem-management/our-work/cems-specialist-groups/mediterranean-type-ecosystems)
The Mediterranean ecosystem is considered a hotspot of biodiversity; the Mediterranean basin was considered one of the places in the world with most biodiversity. Although its biodiversity is immense, the vegetation of these ecosystems can be categorized into two groups: summer semi-deciduous and evergreen sclerophylls (Pacyna, 2008).
These ecosystems are considered environments under N limitation, however, their primary structure and response to N input are specially conditioned by water restriction and P availability. Considering that these environments are used to having limited amounts of N, their communities have evolved to be adapted to these conditions, and as such, changes in N availability will alter the relations between the organisms (Chapin, 2003; Xia and Wan, 2008; Craine et al., 2009).
Due to the distinctive features of the Mediterranean ecosystems, such as the climate, the soil (lower levels of nutrient and organic matter, although it has a high level of carbonate content), the increased N dry deposition, the discrepancy of N accessibility and biological action and even the spatial and chronological heterogeneity, it is predictable that this ecosystem will not have the same response as the north temperate ecosystems. This is important to establish since most of the studies done on N deposition were made in north Europe and America, which are north temperate ecosystems (Cruz et al., 2008; Bobbink et al., 2010; Ochoa-Hueso et al., 2011).
13 Although there are studies on Mediterranean ecosystems, they come from California, which does not share the same environmental conditions, such as soil fertility and P availability (Cowling et al., 1996; Fenn et al., 2010; Ochoa-Hueso et al., 2011).
As such, N deposition can have different impacts on Mediterranean basin ecosystems and given the impact these studies can have, the critical loads added to the soil can be determined and a change in agriculture practices and legislation involved can be encouraged. Moreover, the particularity of this being a long-term study can give an insight into a more profound background of the consequences of N deposition.
1.6. Study site
The research presented here was carried out on Serra da Arrábida in the Arrábida Natural Park
(38° 27’34” N, 9° 0’ 20” W), in a Natura 2000 site, positioned south of Lisbon, Portugal (PTCON0010Arrábida/Espichel). This study site is near urban and industrial areas, so the fertilization was made to mimic the inputs of agricultural sources (only N reduced added- NH4+), or the inputs of agricultural and industrial sources (added N reduced and oxidized- NH4+ and NO3-). This location is encompassed in a study since January of 2007 and the fertilization was performed 3 times a year: spring, summer, and middle autumn/winter. Before the present work, the field was fertilized on January 26th 2019 by the Plant & Soil Ecology group and the samples were collected on March 14th 2019.
This work is part of an ongoing study over the last 10 years, in which fields are fertilized with different quantities and forms of N. To characterize the soils from these fields, some soil characteristics were analyzed in different years of the study, namely 2007 (prior to fertilization), 2008 (one year fertilization), 2011 (five years fertilization) and 2018 (10 years fertilization). The characteristics evaluated were: pH, organic matter (OM), N%, C/N, soil inorganic N (Ninorg), NH4+, NO3 -(Dias, Malveiro, et al., 2011; Dias et al., 2014). The results of this characterization are shown in
Figure 1.9.
The values of N% (Graphic A) have not changed in the 10 years of the study, presenting low values for all treatments every year (~0.1%). This indicates that in the fertilized treatments, the fertilization did not change the N content.
The concentration of Ninorg and NO3- (graphic B and C) exhibited more varied results. The concentration of Ninorg has increased during the experiment, especially for the treatment 80AN which presents the highest values and differs from the other treatments in the years 2011 and 2018. The concentration of NO3- follows the same pattern as the Ninorg concentration, with an increase in the last two measurements especially the treatment 80AN.
The Ninorg was measured to assess the N retention, since the lower the soil inorganic N, the higher the N retention. This way the increase of Ninorg in treatment 80AN represents a decrease in the N retention and therefore alterations in the N cycle, possibly with NO3- leaching (de Schrijver et al., 2008; Dias et al., 2014).
14
Figure 1.9: Graphic representation of the soil samples relative to the characteristics evaluated. A- N (%), B- Ninorg (μgg-1), C- NO3- (μgg-1), D- NH4+ (μgg-1), E-OM (%), F- pH and G- C/N ratio. Error bars represent the mean (n = 3 experimental
plots per treatment) ±SE
The concentration of NH4+ (graphic D) did not present differences during the study both among the treatments and throughout the years.
The OM% (graphic E) appears to have changed over the years - in the results from 2011 and 2018 the OM increases from the control treatment, to treatment 40A, followed by treatment 40 AN and treatment 80AN presents the highest values. These findings may have resulted from an increase in the decomposition, which has great relevance in soils of the mediterranean basin, since it has naturally low values of OM (Jones et al., 2012; Dias et al., 2013).
The pH (graphic F) does not present differences between the treatments in any year, however, throughout the years pH decreased in the treatments. Most studies report acidification with N addition; however, the soil high content of calcium carbonate may be the reason why it is not possible to observe a difference between the fertilized treatments and the control (Schultz, 2005; Bobbink et al., 2010).
The same results can be observed for the C/N ratio (graphic G), throughout the years the ratio continues similar in the treatments, however, in the results of 2018 the control treatment appears to have a higher value then the N fertilized treatments. This way, the ratio of C/N remains within the range for the Mediterranean Basin (Sardans et al., 2008).
15
1.7. Thesis purpose and goals
The effects of increased nitrogen (N) input in the ecosystems have brought concern for some time now, the long-term consequences of this input to Mediterranean ecosystems are poorly studied. These ecosystems are known for being hotspots of biodiversity and for this reason studies on the effects of N deposition on biodiversity in these places are necessary.
To understand these consequences, the diazotrophic community within the rhizosphere of
Ulex densus was studied as a proxy to the ecosystem’s response to different N addition to the soil, in the
context of a long-term field study where various plots were continuously exposed to different forms and amounts of N-fertilizers.
For each soil treatment, selective isolation for diazotrophs was made and the isolates collection that resulted from that was characterized in order to evaluate the structural differences in the diazotrophic community on the distinct treatments. 40 representative isolates of this collection were selected and identified through 16S rRNA gene sequencing.
To evaluate the functional differences, other functions of the N cycle, such as denitrification, nitrification, and ammonification were evaluated in order to assess the multifunctionality of these isolates within the N cycle. For some of these isolates, the metabolic plasticity was studied to determine if the different fertilizations changed the metabolism of the microorganisms.
Under these circumstances, this thesis goals are:
• Characterize the effect of N availability on Ulex densus rhizospheric diazotrophic community, based on the structural and functional diversity of the respective isolates, in order to find an ecological marker of high N availability;
• Morphophysiological and genomic characterization of the rhizospheric diazotrophic community, obtained from isolation in N-free media;
• Evaluation of the structural differences of the community between the different treatments under distinct N addition;
• Evaluation of the multifunctionality of the community, within the N cycle, and comparison between the different treatments under distinct N addition;
• Evaluation of the differences in the metabolic plasticity of the community between the different treatments under distinct N addition.
16
1.8. Strategy
17
2. MATERIALS AND METHODS
2.1. Experimental design and soil sampling
The field experimental scheme consisted of 12 plots, of 400 m2 each, as presented in Figure 2.1. All determinations and analyses were conducted inside an internal 100 m2 square, to limit the boundary effect and dilution processes. Nitrogen availability was altered through the addition of 40 and 80 kg N ha−1 yr−1 in the form of NH4NO3 (doses designated 40 AN and 80 AN respectively) and 40 kg N ha−1 yr−1 as a 1:1 mix of N-NH4Cl and N-(NH4)2SO4 (designated 40 A). Control plots were not fertilized. Each treatment had three replicates (3 plots). To counteract nitrogen ‘pollution’ flow-through from fertilized plots, the experimental plots were spread in three lines along the slope, with the controls being positioned in the top row. The principles of determining the nitrogen doses and forms applied to the soil are described in Dias, Neto, et al. (2011).
Soil samples were obtained from rhizospheric soil from four plants in each corner of the internal square and one plant in the center. For each plant, four samples were collected corresponding to the four cardinal points. This procedure was done in every plot as illustrated in Figure 2.1.
Figure 2.1: Experimental scheme of the plots in the field and the sampling scheme for the soil samples.
2.2. Sample treatment
Each sample was composed of soil collected from each cardinal point making a total of five samples per plot, one for the rhizospheric soil of each plant. For the processing of the samples, each of them was sieved through a 4 mm pore, to prevent debris passage. These samples were separated in three portions: two were stored at 4ºC (for the isolation of microorganisms) and one was placed at -20ºC (for posterior analysis, corresponding to the soil characterization in Figure 1.10).
As shown in the sample treatment section of Figure 1.10, the composite samples were constituted by 5 g of soil from each of the five individual samples described above, making a total of
18 25 g of soil per plot. These composite samples were placed in 500 mL Erlenmeyer flasks with 200 mL of Sterile pure water (SPW) with 0.05% (w/v) Calgon, acting as a chelating agent, and 0.01% (v/v) Tween 80, to release hydrophobic bacteria from the aggregates they form with soil particles. These suspensions were incubated for an hour at 28ºC at 160 rpm and then centrifuged at 300 x g in a Centrifuge 5810R (Eppendorf, Germany) for 60 min. The collected supernatants were filtered with FILTER-LAB1250 (10-13 μm).
For each suspension, 1 mL was collected in a microtube, centrifuged at 10000 x g in a Centrifuge 1-15P (Sigma, USA) for 10 min, washed in 1x Phosphate Buffer Saline (PBS) and stored in 20% (v/v) glycerol at -80ºC. The remaining volume was centrifuged at 10000 x g in a Centrifuge 1-15P (Sigma, USA) for 10 min and washed in 1x PBS. The obtained pellets were used for microorganism isolation in serial dilutions from 10-1 to 10-6.
2.3. Selective isolation of nitrogen fixers
For microorganism’s isolation two different media were used: Nitrogen free broth (NFB) medium with sucrose addition and Mannitol agar. NFB is a more selective medium, since it uses malic acid as a carbon source, which can have inhibitory effects on some species (Rathnayaka, 2013). The medium was supplemented with sucrose, to allow the growth of microorganisms that cannot use malic acid as a carbon source. To ensure microorganisms incapable of growing on NFB would not be lost in the isolation process, Mannitol agar was used in parallel, since it is a more general medium that allows the growth of aerobic diazotrophic microorganisms. This medium usually contains calcium carbonate, but it was removed to facilitate colony visualization.
The Mannitol agar medium composition was: 15 g mannitol; 0.5 g K2HPO4, 0.2 g MgSO4, 0.1 g CaSO4, 0.2 g NaCl, 15 g Agar, in 1 L of RO-Water. The medium was sterilized by autoclave, at 121ºC for 15 min.
The NFB medium with sucrose contained: 5 g malic acid, 5 g sucrose, 0.5 g K2HPO4, 0.2 g MgSO4∙7H2O, 0.1 g NaCl, 0.02 g CaCl2∙2H2O, 2 mL micronutrient solution (0.4 g CuSO4∙5H20, 0.12 g ZnSO4∙7H20, 1.4 g H3BO3, 1 g Na2MoO4∙2H2O, 1.5 g MnSO4∙H20 in 1 L of RO-water), 2 mL bromothymol blue solution (0.5% (v/v) in 0.2 N KOH), 4 mL 1.64% (w/v) Fe(III) Ethylenediamine tetraacetic acid (EDTA), 1 mL vitamin solution (10 mg biotin and 20 mg pyridoxol HCl in 100 mL of SPW) in a final volume of 1 L RO-water, pH adjusted to 6.8 with 1 M NaOH, before sterilization by autoclave at 121ºC for 15 min. The vitamin solution was filtered (0.22 μm), and it was added after the medium was autoclaved. Both media were used with supplementation of 0.01% cycloheximide to prevent the growth of fungi.
NFB medium was first used in semi-solid form, 0.2% agar, as described by Baldani et al. (2014) and Chowdhury et al. (2007), as a means of enrichment for diazotrophic microorganisms. This occurs with the formation of a film within the medium, which provides a microaerophilic condition that favors the nitrogenase action. These enrichments were inoculated with 100 and 10-1 dilutions in 3 mL of medium in transparent glass tubes, so it was possible to visualize film formation. The enrichments were incubated for a week at 28ºC, after which the films were collected and inoculated onto NFB with 1.5% agar plates. For Mannitol agar, 10-2 and 10-3 dilutions were inoculated. All plates were incubated at 28ºC until growth was visible.
All plates were observed under a stereomicroscope S4E (Leica, Germany) and the colonies with different morphology were picked off and streaked onto fresh NFB plates.
19 Colonies were then picked off onto Tryptone Soy Agar (TSA), because in NFB they were extremely mucous, not allowing isolation. Repeated passages were made to ensure isolation, prior to characterization and the creation of an isolate culture collection.
2.4. Isolate characterization
The isolates were characterized based on morphological features using classic phenotypic methods, namely Gram staining and KOH test combined with oxidase and catalase tests and endospore staining.
Genomic DNA was extracted from bacterial cells in a pure culture using an adapted Guanidium Thiocyanate method described by Pitcher, Saunders and Owen (1989). The modifications were made mainly in the first steps of the method. The bacterial cells were collected from the plate and were resuspended in 250 μL of lysis buffer (50 mM Tris; 250 mM NaCl; 50 mM EDTA; 0.3% SDS; pH 8.0) and 100 μL of microspheres were added. Posteriorly, the cells were homogenized in a vortex for 2 min, after which they were incubated at 65ºC for 30 min, followed by 2 min of homogenization. Then, the GES reagent was added (5 M guanidium thiocyanate; 10 mM EDTA; 0.5% Sarkosyl; pH 8,0) and the original method was followed, however, precipitation was achieved using 1 volume of isopropanol.
PCR-fingerprinting with primer M13 (5’ – GAGGGTGGCGGTTCT – 3’) (Meyer et al., 1993) was performed in a total volume of 25 μL, with 1x PCR buffer (Invitrogen), 3 mM MgCl2, 25 pmol of primer, 0.2 mM of dNTP’s mix, 1 U of Taq Polymerase (Invitrogen) and 1 μL of template DNA. Amplification was performed in a UNO II Thermal Cycler (Biometra, Germany), with the following conditions: 5 min of initial denaturation at 95°C, followed by 40 cycles of 1 min of denaturation at 95°C, 2 min of annealing at 50°C and 2 min of extension at 72°C, followed by a final elongation step of 5 min at 72°C.
PCR products were visualized by gel electrophoresis, alongside with 1 kb plus DNA ladder (Invitrogen), in a 1.2% (w/v) agarose gel in 0.5x TBE buffer (40 mM Tris; 45 mM Boric acid; 1 mM EDTA; pH 8.3). Electrophoresis was run at 2.5 V/cm for 3 h, followed by gel staining in an Ethidium Bromide solution and shot in an Alliance 4.7 UV Transilluminator (UVItec, Cambridge), utilizing Alliance software version 15.15 (UVItec, Cambridge).
Gel images with the fingerprinting profiles obtained were uploaded and treated with Bionumerics software (version 6.6). Dendrograms were constructed for the isolates based on the profiles obtained for M13, using Pearson correlation coefficient to construct the similarity matrix and the Unweighted Pair Group Method with Arithmetic Average (UPGMA) as the clustering method. Reproducibility was established by randomly selecting 10% of the isolates to use as replicates in the amplification. A dendrogram constructed based on these duplicates was used to estimate the reproducibility cut-off and to calculate the optimization (0.5) and curve smoothing (1) parameters that better paired the repeats.
To assess the soils diazotrophic diversity Shannon (J’) and Simpson’s (D) diversity indices were used (Zar, 2010), establishing a cluster cut-off at 70% to define groups (Appendix A), which was the minimum similarity between the duplicates. The diversity indices were calculated based on