Much attention has focused on potential adverse health effects associated with expo-sure to mercury and mercury compounds. Of particular public health concern has been possible neurologic impairment associated with prolonged exposure to elemental mer-cury (Hg0) vapor (Clarkson 2003; Echeverria et al. 1998; Goering et al. 1992). Children are known to be particularly vulnerable to Hg0, prolonged exposure to which may cause impairment of the developing central nervous system, along with attendant personality, motor function, and behavioral disorders (Counter and Buchanan 2004; Davidson et al. 2004; Levy et al. 2004).
A principal source of Hg0exposure in children is through dental amalgam fillings, which are approximately 50% metallic mer-cury by weight. Hg0vapors released from amalgam fillings in tooth surfaces are readily absorbed into the systemic circulation by inhalation (Berglund et al. 1988; Mackert and Berglund 1997; Svare et al. 1981; Vimy and Lorscheider 1985). Once absorbed, Hg0 undergoes biotransformation predominantly in erythrocytes, to mercuric ion (Hg2+), the ultimate mediator of mercury toxicity (Halbach and Clarkson 1978; Magos et al. 1978). Debate continues as to the potential adverse effects of low-level Hg0exposure
from dental amalgam, particularly in children (Brownawell et al. 2005; Clarkson and Magos 2006).
Findings from two concurrently con-ducted clinical trials that were designed to evaluate the potential neurologic and neu-robehavioral consequences of prolonged Hg0 exposure from dental amalgam fillings in children have been recently reported (Bellinger et al. 2006; DeRouen et al. 2006). As part of one of those clinical trials (DeRouen et al. 2006), we performed annual measurements of urinary mercury concentrations in children between 8 and 18 years of age as an assessment of longitudinal exposure to Hg0from amalgam fillings. Here we describe changes in urinary mercury levels in children with and without amalgam fillings over the course of the trial. We also report age-, race-, and sex-related changes in urinary mercury concentrations associated with amalgam exposure.
Methods
Description of the study population and details of dental treatments. Five hundred seven children (54% boys, 46% girls) 8–10 years of age at baseline who were residents of the Casa Pia school system in Lisbon, Portugal, participated in a randomized,
prospective clinical trial to examine the potential health effects of exposure to dental amalgam tooth filling materials. Children were evaluated at baseline and at seven subse-quent annual intervals after initial dental treatments with an extensive battery of neu-robehavioral, neurologic, and renal function assessments. The dental materials used in this trial (amalgam or composite resin) were state-of-the art, universally accepted tooth filling materials. The choice of amalgam was the brand most widely used in the United States, Dispersalloy by Dentsply Caulk (York, PA, USA), which, like most other brands, is approximately 50% Hg0. All dental treat-ments met existing standards of care in the United States and Portugal. The study proto-col was approved by the institutional review boards at the University of Washington and the University of Lisbon. All parents or guardians gave written informed consent, and all children provided signed assent. A detailed description of the demographics of the study population as well as the design and methods employed has been previously published (DeRouen et al. 2002).
Procedures for urine collection and meas-uring urinary Hg and creatinine. A urine sample (~ 50 mL) was collected from each child at baseline and at each subsequently scheduled annual visit to the University of Address correspondence to J.S. Woods, Department of Environmental and Occupational Health Sciences, University of Washington, 4225 Roosevelt Way NE, Suite 100, Seattle, WA 98105 USA. Telephone: (206) 685-3443. Fax: (206) 685-4696. E-mail: jwoods@u.washington.edu
The research was funded by Cooperative Agreement U01DE11894 from the National Institute of Dental and Craniofacial Research (NIDCR) of the National Institutes of Health.
J.G.L. is principal investigator for a clinical research project at the Biomaterials Laboratory at the University of Lisbon, which is supported by the Ivoclar Vivadent Company to test a novel indirect veneer material. Ivoclar Vivadent manufactures both composite resins and dental amalgams, but no prod-uct used in the process is discussed in this article, and J.G.L. has received no direct compensation from this contract. M.F.B. has received finanacial supoort from Dentsply DeTry Company, which manufac-tures dental instruments and amalgam, to travel to the University of Washington for professional devel-opment in research methods. None of the other authors declares competing financial interests.
Received 9 March 2007; accepted 28 June 2007.
The Contribution of Dental Amalgam to Urinary Mercury Excretion
in Children
James S. Woods,1Michael D. Martin,2Brian G. Leroux,3Timothy A. DeRouen,3Jorge G. Leitão,4
Mario F. Bernardo,4Henrique S. Luis,4P. Lynne Simmonds,1John V. Kushleika,1and Ying Huang3
1Department of Environmental and Occupational Health Sciences, 2Department of Oral Medicine, and 3Department of Dental Public Health Sciences, University of Washington, Seattle, Washington, USA; 4Faculdade de Medicina Dentaria, Universidade de Lisboa, Lisbon, Portugal
BACKGROUND: Urinary mercury concentrations are widely used as a measure of mercury exposure from dental amalgam fillings. No studies have evaluated the relationship of these measures in a longitudinal context in children.
OBJECTIVE: We evaluated urinary mercury in children 8–18 years of age in relation to number of amalgam surfaces and time since placement over a 7-year course of amalgam treatment.
METHODS: Five hundred seven children, 8–10 years of age at baseline, participated in a clinical trial to evaluate the neurobehavioral effects of dental amalgam in children. Subjects were random-ized to either dental amalgam or resin composite treatments. Urinary mercury and creatinine con-centrations were measured at baseline and annually on all participants.
RESULTS: Treatment groups were comparable in baseline urinary mercury concentration (~ 1.5 µg/L). Mean urinary mercury concentrations in the amalgam group increased to a peak of ~ 3.2 µg/L at year 2 and then declined to baseline levels by year 7 of follow-up. There was a strong, positive association between urinary mercury and both number of amalgam surfaces and time since placement. Girls had significantly higher mean urinary mercury concentrations than boys throughout the course of amalgam treatment. There were no differences by race in urinary mercury concentration associated with amalgam exposure.
CONCLUSIONS: Urinary mercury concentrations are highly correlated with both number of amal-gam fillings and time since placement in children. Girls excrete significantly higher concentrations of mercury in the urine than boys with comparable treatment, suggesting possible sex-related dif-ferences in mercury handling and susceptibility to mercury toxicity.
KEY WORDS: amalgam, children, dental, mercury, urine. Environ Health Perspect 115:1527–1531 (2007). doi:10.1289/ehp.10249 available via http://dx.doi.org/ [Online 28 June 2007]
Lisbon School of Dental Medicine for den-tal, neurologic, and neurobehavioral evalua-tions. Immediately after urine collection, a 10-mL aliquot was removed and acidified with 1 N HCl. Analysis of total mercury was performed using continuous flow, cold vapor spectrofluorometry as previously described (Pingree et al. 2001b). Urinary creatinine concentrations were measured in unacidified urine using a standard colori-metric procedure (Sigma #555-A; Sigma-Aldrich, St. Louis, MO, USA). Urinary mercury levels were calculated as both micrograms per gram creatinine and micro-grams per liter urine.
Statistical procedures. As a check on the randomization procedure, we compared the two treatment groups (amalgam or compos-ite) in terms of the distributions of sex, race, and baseline values of age, urinary mercury concentration, urinary creatinine concentra-tion, blood lead concentraconcentra-tion, and IQ (Figure 1 and Table 1). Mean values of mer-cury concentration and creatinine-adjusted mercury concentration were graphed by treatment group and year, and treatment group means were compared at each follow-up year using t-tests. We used arithmetic means for these analyses because of their ease of interpretations; analyses of geometric
means (not shown) gave qualitatively similar results. We compared treatment group means first for all study participants and then separately for male and female participants. We compared males and females within the amalgam group using t-tests at each study year. The amount of amalgam treatment was characterized by the number of amalgam surfaces placed at baseline (i.e., within 1 year from the first visit) and during the follow-up period. Amalgam group participants were classified according to baseline treatment (0–4, 5–9, or > 9 surfaces) and follow-up treatment (0, 1–9, or > 9 surfaces) (Table 2). Mean urinary mercury concentrations for each of the resulting nine subgroups were then compared with means for the compos-ite group as a whole. We used linear regres-sion analysis to examine the prediction of creatinine-adjusted urinary mercury concen-tration (on the logarithmic scale) as a func-tion of sex, race, baseline age, study year (as categorical variable), number of amalgam surfaces placed in first year, number of amal-gam surfaces placed in subsequent years, and number of amalgam surfaces placed at base-line that were subsequently lost due to tooth exfoliation or extraction. An additional analysis used weighted counts of surfaces placed and lost, weighted for size of restora-tion (1 = small, 2 = medium, 3 = large), which gave qualitatively very similar results (not reported). The method of generalized estimating equations (Liang and Zeger 1986) was used for this analysis to account for cor-relation between observations on the same subject in different years. The statistical analyses used all available data, and missing data on children who were not followed were ignored. The main study conclusions were not affected heavily by missing data, because the latter pertain to the initial 5 years of follow-up when missing was infrequent.
Statistical analyses were performed using the statistical package R (version 2.4.1; R Foundation for Statistical Computing, Vienna, Austria).
Results
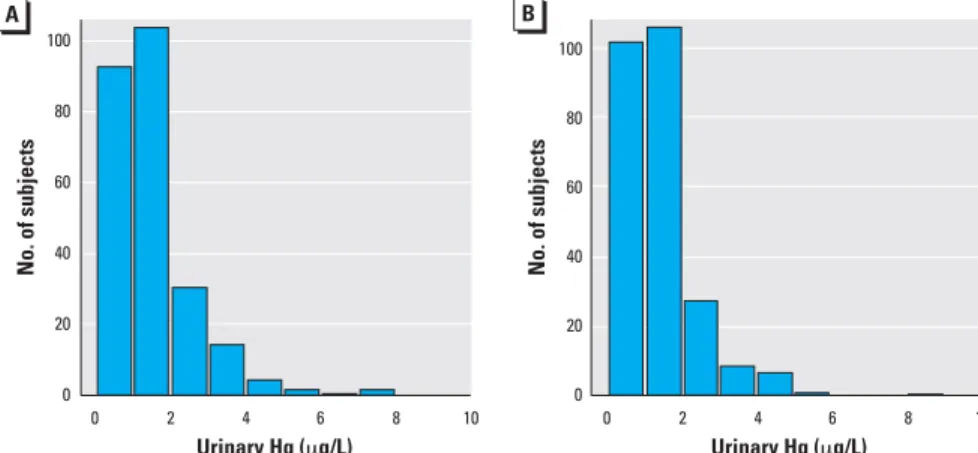
Baseline comparisons of treatment groups. The treatment groups were similar in distrib-ution of sex, race, baseline age, and baseline urinary mercury concentration (Table 1). The distributions of baseline urinary mer-cury concentrations were very similar in the two treatment groups (Figure 1). The groups were also balanced on other baseline vari-ables examined (DeRouen et al. 2006) including average creatinine-adjusted urinary mercury concentration (1.8 µg/g for the amalgam group, and 1.9 µg/g for the com-posite group), IQ score (85 and 85), blood lead concentration (4.7 and 4.5 µg/dL), number of carious surfaces (15.6 and 15.9),
Table 1. Demographics and baseline urinary mercury concentrations of the study participants by assigned
treatment group.
Variable Amalgam group (n= 253) Composite group (n= 254)
Sex Female 116 (46) 112 (44) Male 137 (54) 142 (56) Race White 178 (70) 181 (71) Black 75 (30) 68 (27) Asian 0 (0) 5 (2)
Baseline age (years) 10.1 ± 1.0 (8.0–12.4) 10.0 ± 0.9 (8.2–12.0) Baseline urinary mercury 1.5 ± 1.2 (0.1–7.7) 1.4 ± 1.1 (0.0–8.6)
concentration (µg/L)
Values are no. (%) or mean ± SD (range).
Table 2. Categorization of the amount of amalgam treatment at baseline (within the first year after the
initial visit) and during the follow-up period separately for male and female participants. Baseline amalgam Follow-up amalgam
treatment treatment Male Female
(no. of surfaces) (no. of surfaces) [no. (%)] [no. (%)]
0–4 0 13 (9.5) 11 (9.5) 1–9 10 (7.2) 3 (2.6) > 9 4 (2.9) 4 (3.4) 5–9 0 11 (8.0) 14 (12.1) 1–9 23 (16.8) 17 (14.7) > 9 13 (9.5) 10 (8.6) > 9 0 18 (13.1) 13 (11.2) 1–9 30 (21.9) 28 (24.1) > 9 15 (10.9) 16 (13.8) Total — 137 (100) 116 (100)
The amount of treatment during both time periods was similar for males and females.
Figure 1. Histograms of baseline urinary mercury concentrations in amalgam (A) and composite (B) treated groups. Heights of the bars represent the numbers of subjects with values within the indicated range. The distributions of baseline urinary mercury levels were similar in the two treatment groups.
0 2 4 6 8 10 0 2 4 6 8 10 Urinary Hg (μg/L) Urinary Hg (μg/L) 100 80 60 40 20 0
No. of subjects No. of subjects
A B 100 80 60 40 20 0
and creatinine-adjusted albumin concentra-tion (8.6 and 8.3 mg/g).
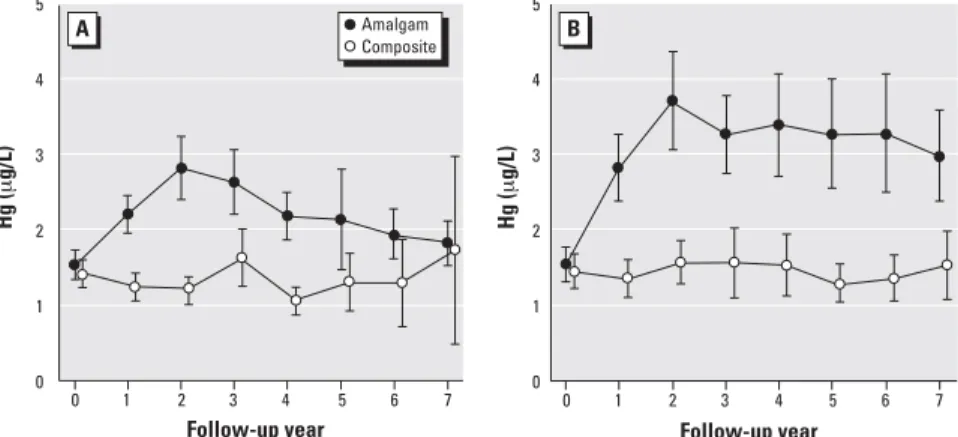
Follow-up mercury concentrations. Mean urinary mercury concentrations in the amal-gam group increased from approximately 1.5 µg/L at baseline to a peak of approxi-mately 3.2 µg/L at year 2 and then slowly declined to near baseline levels by year 7 of follow-up (Figure 2). In contrast, mean mer-cury concentrations changed very little in the composite group throughout the 7-year fol-low-up period. Differences between treat-ment groups were highly significant at all follow-up years except for the final year. For creatinine-adjusted mercury levels, group dif-ferences were significant at all follow-up years, including year 7 (Figure 2B). A possi-ble reason for the lack of significance at year 7 for unadjusted concentrations is the wide confidence interval due to reduced sample size and a small number of large values in the composite group that increased the group mean and SD.
Race comparisons. Mean urinary mercury concentrations for black and white partici-pants were similar at baseline as well as throughout all 7 years of follow-up. No sig-nificant differences were found by race in urinary mercury concentrations associated with amalgam exposure (not shown).
Sex comparisons. Mean urinary mercury concentrations for male and female partici-pants were similar at baseline, but increases after amalgam treatment were larger for females than for males. As shown in Figure 3, females who received amalgam fillings had significantly higher mean urinary mercury concentrations than males throughout the 7 years of follow-up. In contrast, there were no differences in urinary mercury concentra-tions between males and females in the com-posite group. Mean mercury concentrations for female amalgam group subjects reached a peak of approximately 3.5 µg/L at year 2 and remained about 3 µg/L throughout the 7-year follow-up period. In contrast, mean mercury values for males were < 3 µg/L at all years and declined to the same level as seen in the com-posite group by the end of follow-up. The differences between males and females in uri-nary mercury levels were not attributed to the amount of treatment received. As indicated in Table 2, the distributions of amalgam sur-faces placed during baseline and follow-up were similar for males and females.
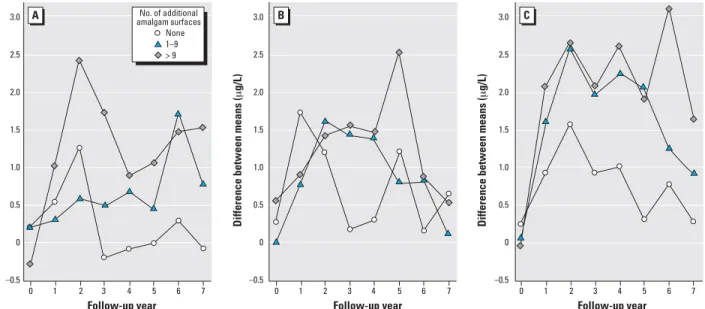
Dose–effect relationships. The increase in urinary mercury concentrations was posi-tively associated with the amount of amal-gam treatment received at baseline and during follow-up (Figure 4). The largest increases in mercury concentrations (reach-ing 3.1 µg/L in year 6) were observed in par-ticipants receiving more than 9 amalgam surfaces at baseline and an additional 10 or
more surfaces during follow-up. In contrast, only small increases in urinary mercury con-centrations were observed in participants receiving 0–4 amalgam surfaces at baseline.
Regression analysis. In regression analysis, child sex (p < 0.001), baseline amalgam sur-faces (p < 0.001), sursur-faces lost (p < 0.001), and follow-up amalgam surfaces (p < 002) were significant predictors of creatinine-adjusted urinary mercury. Concentrations for females were approximately 30% higher than those for males [calculated as exp(0.25), where 0.25 was the difference on the log scale]. Each additional baseline surface was associated with a 0.057 increase in concen-tration on the log scale (corresponding to about a 6% increase in concentration). Each lost surface was associated with an increase on 0.047 on the log scale; the difference 0.057–0.047 represents the effect of a surface placed and then lost on urinary mercury concentration. Each additional follow-up surface was associated with an increase of
0.018 on the log scale. The effects of age and race were not statistically significant.
Discussion
Numerous studies have described the rela-tionship between mercury exposure from dental amalgam restorations and its corre-sponding excretion in the urine of adults (Begerow et al. 1994; Dye et al. 2006; Kingman et al. 1998; Mackert and Berglund 1997; Skare and Engqvist 1994) as well as children (Gearhart et al. 1995; Khordi-Mood et al. 2001; Levy et al. 2004; Pesch et al. 2002; Suzuki et al. 1993). To our knowledge, this is the first study to describe urinary mercury excretion patterns in chil-dren during the longitudinal course of amal-gam treatment from childhood through adolescence and to quantify the relationship between amalgam surfaces and urinary mer-cury concentrations during the course of treatment. The findings demonstrate a strong, positive association between urinary
Figure 3. Mean urinary mercury concentrations for the amalgam group and composite group separately
for male (A) and female (B) participants. Error bars show 95% confidence intervals for the group means. Differences between males and females in the amalgam group were statistically significant (p< 0.05) at all follow-up years except follow-up year 3. The sex comparisons were not altered significantly by adjustment for creatinine (results not shown).
0 2 4 6 Follow-up year Hg ( μ g/L) A B 1 3 5 7 Follow-up year 0 1 2 3 4 5 6 7 Hg ( μ g/L) 5 4 3 2 1 0 5 4 3 2 1 0 Amalgam Composite
Figure 2. Mean urinary mercury concentrations, unadjusted (A) and creatinine-adjusted (B), for the amal-gam group and composite group. Error bars show 95% confidence intervals for the group means. Group differences were highly statistically significant (p< 0.001) for both measures at follow-up years 2 through 6. The group differences at year 7 were not significant for unadjusted mercury (p= 0.07) but signif-icant for adjusted mercury (p= 0.007).
0 2 4 6 Follow-up year Hg ( μ g/L) A B 1 3 5 7 Follow-up year 0 1 2 3 4 5 6 7 Hg ( μ g/g) 5 4 3 2 1 0 5 4 3 2 1 0 Amalgam Composite
mercury concentration and both number of amalgam surfaces and time since placement. Urinary mercury levels were highest approxi-mately 2 years after initial amalgam treat-ment, regardless of number of surfaces, among children receiving no additional fillings. Among children receiving up to 9 initial amalgam fillings, urinary mercury concentrations returned to pretreatment values within one year, consistent with a whole-body biological half-time of mercury on the order of 60–70 days (Clarkson et al. 1988). In contrast, for children receiving ≥ 10 amalgam fillings at baseline and with no subsequent treatment, the decline from peak to pretreatment urinary mercury con-centrations occurred over a period of ≥ 3 years, consistent with the kinetics of a two-compartment model of urinary mercury elimination that predicts a substantially longer whole-body mercury half-time (Barregård et al. 1992).
For children receiving > 9 additional amalgam fillings after initial amalgam place-ment, urinary mercury concentrations remained elevated 2- to 4-fold compared with those of composite controls throughout much of the 7-year follow-up, declining only gradu-ally during this period. This was true regard-less of the number of amalgam fillings placed at baseline. Nonetheless, data presented in Figure 2 imply that the rate of urinary mer-cury excretion exceeds the rate of mermer-cury exposure from dental amalgam in these sub-jects at all time points. Notably, we observed a constant but quantifiable urinary mercury excretion among children in this study who did not receive amalgam restorations, most likely representing the systemic uptake of
mercury from food, air, and other environ-mental sources. Together, these observations imply that the level of mercury exposure from all sources including amalgam fillings did not exceed the capacity for elimination via urinary excretion in these subjects. That urinary out-put increases approximately 1.5-fold between 10 and 15 years of age from approximately 1,000 to approximately 1,500 mL/24 hr (Forfar and Arneil 1984) possibly contributes to this capability, although previous reports have suggested that the 24-hr urinary mercury excretion rate is not significantly influenced by the urinary flow rate (Skare and Engqvist 1990, 1994).
Of particular interest was the finding of significantly higher urinary mercury concentrations in girls compared with boys beginning with the first year after initial amal-gam placements and continuing through the subsequent 7-year follow-up period. These differences held up after adjustment for creati-nine and differences in the amount of amal-gam treatment received (Table 2). Factors possibly accounting for this sex difference include differences in a) eating habits, particu-larly total time spent eating, and consumption of hot beverages (Brune 1988), b) habitual gum chewing (Gay et al. 1979), c) exercise that results in high rates of breathing (Brune 1988), and d) body weight (Levy et al. 2004). Variation in eating habits is not likely to con-tribute to sex differences observed in the pre-sent study, in that most subjects were enrolled in the Casa Pia school system, which provided the same meals to all children. Importantly, fish consumption among participants in this study was comparable and did not constitute a significant source of mercury exposure
(Evens et al. 2001). Similarly, habitual gum chewing, defined as chewing gum for the greater part of every day, was relatively uncommon within this population and not likely to account for the sex differences observed. In terms of body mass differences, Levy et al. (2004) reported a significant inverse relationship of urinary mercury con-centration for children stratified on physical characteristics such as height and weight. However, no sex differences in urinary mer-cury excretion were reported in that investiga-tion. Although height and weight data were not collected in the present study, no signifi-cant differences between boys and girls in cre-atinine excretion—a surrogate measure of body mass—were found over the course of follow-up (Martin MD, unpublished data), suggesting a more predominant effect of sex per se as opposed to body size or exercise rates on the mercury excretion differences observed in this study.
Sex differences in mercury handling in both animals and humans have been described. In terms of inorganic mercury, Hultman and Nielsen (2001) reported signifi-cantly greater whole-body mercury retention as well as greater mercury accumulation in kid-neys and spleens of male compared with female mice of several strains during prolonged exposure to mercuric chloride. In human stud-ies, women were reported to have significantly higher urinary mercury concentrations than men with comparable numbers of dental amalgam fillings (Akesson et al. 1991), similar to findings here. Studies on the excretion of organic and inorganic mercury in methylmer-cury-treated rats (Thomas et al. 1987) showed faster whole-body clearance of mercury in
Figure 4. The increase in urinary mercury concentration is influenced by both the amount and timing of amalgam treatment. Children in the amalgam group were
categorized according to the number of amalgam surfaces placed at baseline—(A) 0–4; (B) 5–9; (C) > 9—and the number of additional amalgam surfaces placed in subsequent years. The values plotted are the differences between mean urinary mercury in a particular subgroup of amalgam-treated children compared with mean urinary mercury concentration in the composite group at each year.
0 2 4 6
Follow-up year
Difference between means (
μ g/L) A B 1 3 5 7 3.0 2.5 2.0 1.5 1.0 0.5 0 –0.5 0 2 4 6 Follow-up year 1 3 5 7 3.0 2.5 2.0 1.5 1.0 0.5 0 –0.5
Difference between means (
μ g/L) 0 2 4 6 Follow-up year 1 3 5 7 3.0 2.5 2.0 1.5 1.0 0.5 0 –0.5
Difference between means (
μ g/L) C None 1–9 > 9 No. of additional amalgam surfaces
females than in males, also consistent with the present findings. Similarly, studies on methyl-mercury exposure in human infants and children (Grandjean et al. 1988; McKeown-Eyssen et al. 1983) as well as animals (Gimenez-Llort et al. 2001; Rossi et al. 1997) reported greater developmental effects in males than in females, consistent with higher overall mercury retention and lower rates of mercury excretion by males. Although numerous fac-tors that might differentially affect mercury disposition have been reported (Vahter et al. 2007), the biological mechanisms underlying sex-related differences in mercury excretion rates or susceptibility to mercury toxicity remain to be identified. Inasmuch as there are no known sex differences in humans with regard to the urine formation rate by the kid-neys, the present findings imply a greater degree of mercury retention by males, possibly consistent with higher tissue levels observed in some studies.
Questions arise from the present observa-tions as to the interpretation of urinary mer-cury concentrations in the assessment of safe mercury exposure levels. If girls are, in fact, more proficient in the excretion of mercury than boys, then it may follow that a specific urinary mercury concentration measured in girls represents a lesser risk of mercury toxicity than the same urinary concentration in boys. This issue speaks directly to the question of differential sensitivity (Brent and Weitzman 2004; Makre et al. 1986) and the establish-ment of precautionary measures directed at protecting the most susceptible from risks of mercury toxicity or mercury-associated disor-ders in children (U.S. Environmental Protection Agency 2000). Toxicokinetic stud-ies that identify underlying sex-related differ-ences in mercury handling and the use of metabolic biomarkers that reflect mercury body and tissue burden (Bowers et al. 1992; Pingree et al. 2001a; Woods 1995; Woods et al. 1993) may be useful in these endeavors.
In conclusion, in the present study we describe a strong, positive correlation between mercury exposure from dental amal-gam fillings and urinary mercury excretion over a 7-year longitudinal course of amalgam treatment in children. However, significant differences in urinary mercury concentrations between boys and girls with comparable lev-els of amalgam treatment and times since placement suggest sex-related differences in mercury handling and, possibly, susceptibility to mercury toxicity. These findings are rele-vant within the context of children’s health risk assessment and suggest directions for future research to determine whether differ-ential sensitivities to mercury between boys and girls do exist.
REFERENCES
Akesson I, Schutz A, Attewell R, Skerfving S, Glantz P-O. 1991. Status of mercury and selenium in dental personnel: impact of amalgam work and own fillings. Arch Environ Health 46:102–109.
Barregård L, Sällsten G, Schütz A, Attewell R, Skerfving S, Järvholm B. 1992. Kinetics of mercury in blood and urine after brief occupational exposure. Arch Environ Health 47:176–184. Begerow J, Zander D, Freier I, Dunemann L. 1994. Long-term mercury excretion in urine after removal of amalgam fill-ings. Int Arch Occup Environ Health 66:209–212. Bellinger DC, Trachtenberg T, Barregard L, Tavares M,
Cernichiari E, Daniel D, et al. 2006. Neuropsychological and renal effects of dental amalgam in children: a random-ized clinical trial, JAMA 295:1775–1783.
Berglund A, Pohl L Olsson S, Bergman M. 1988. Determination of the rate of release of intra-oral mercury vapor from amalgam. J Dent Res 67:1235–1242.
Bowers MA, Aicher LD, Davis HA, Woods JS. 1992. Quantitative determination of porphyrins in rat and human urine and evaluation of urinary porphyrin profiles during mercury and lead exposures. J Lab Clin Med 120:272–281. Brent RL, Weitzman M. 2004. The current state of knowledge
about the effects, risks, and science of children’s environ-mental exposures. Pediatrics 113:1158–1166.
Brownawell AM, Berent S, Brent RL, Bruckner JV, Doull J, Gershwin EM, et al. 2005. The potential adverse health effects of dental amalgam. Toxicol Rev 24:1–10. Brune D. 1988. Mechanisms and kinetics of metal release from
dental alloys. Int Endod J 21:135–142.
Clarkson TW. 2003. Three modern faces of mercury. Environ Health Perspect 110:11–23.
Clarkson TW, Friberg L, Hursh JB, Nylander M. 1988. The pre-diction of intake of mercury vapor from amalgams. In: Biological Monitoring of Toxic Metals (Clarkson TW, Friberg L, Nordberg GF, Sager PR, eds). New York:Plenum Press, 247–264.
Clarkson TW, Magos L. 2006. The toxicology of mercury and its chemical compounds. Crit Rev Toxicol 36:609–662. Counter SA, Buchanan LH. 2004 Mercury exposure in children:
a review. Toxicol Appl Pharmacol 198:229–230. Davidson PW, Myers GJ, Weiss B. 2004. Mercury exposure
and child development outcomes. Pediatrics 113(suppl 4):1023–1029.
DeRouen TA, Leroux BG, Martin MD, Townes BD, Woods JS, Leitão J, et al. 2002. Issues in the design and analysis of a randomized clinical trial to assess the safety of dental amal-gam restorations in children. Contr Clin Trials 23:301–320. DeRouen TA, Martin MD, Leroux BG, Townes BD, Woods JS,
Leitão J, et al. 2006. Neurobehavioral effects of dental amalgam in children. JAMA 295:1784–1792.
Dye BA, Schober SE, Dillon CF, Jones RL, Fryar C, McDowell M, et al. 2006. Urinary mercury concentrations associated with dental restorations in adult women aged 16–49 years: United States, 1999-2000. Occup Environ Med 62:368–375. Echeverria D, Aposhian HV, Woods JS, Heyer NJ, Aposhian
MM, Bittner AC, et al. 1998. Neurobehavioral effects from exposure to dental amalgam: new distinctions between recent exposure and Hg body burden. FASEB J 12:971–980. Evens CC, Martin MD, Woods JS, Soares HL, Bernardo M, Leitão J, et al. 2001. Examination of dietary methylmercury expo-sure in the Casa Pia study of the health effects of dental amalgams in children. J Toxicol Environ Health 64:521–530. Forfar JA, Arneil GC, eds. 1984. Textbook of Pediatrics. 3rd ed.
New York:Churchill Livingstone.
Gay DD, Cox RD, Reinhart JW. 1979. Chewing releases mercury from fillings. Lancet 1:985–986.
Gearhart JM, Clewell JH III, Crump KS, Shipp AM, Silvers A. 1995. Pharmacokinetic dose estimates of mercury in chil-dren and dose-response curves of performance tests in a large epidemiological study. Water Air Soil Poll 80:49–58. Gimenez-Llort L, Ahlbom D, Daré E, Vahter M, Ogren S,
Ceccatelli S. 2001. Prenatal exposure to methylmercury changes dopamine-modulated motor activity during early ontogeny: age and gender-dependent effects. Environ Toxicol Pharmacol 9:61–70.
Goering PL, Galloway WD, Clarkson TW, Lorscheider FL, Berlin M, Rowland AS. 1992. Toxicity assessment of mercury vapor from dental amalgams. Fundam Appl Toxicol 19:319–329. Grandjean P, Weihe P, White RF, Debes F. 1998. Cognitive
performance of children preferentially exposed to “safe” levels of methylmercury. Environ Res 77:165-172. Halbach S, Clarkson TW. 1978. Enzymatic oxidation of mercury
vapor by erythrocytes. Biochim Biophys Acta 523:522–531. Hultman P, Nielsen JB. 2001. The effect of dose, gender, and
non-H-2 genes in murine mercury-induced autoimmunity. J Autoimmun 17:27–37.
Khordi-Mood M, Sarraf-Shirazi A, Balali-Mood M. 2001. Urinary mercury excretion following amalgam filling in children. Clin Toxicol 39:701–705.
Kingman A, Albertini T , Brown LJ. 1998. Mercury concentra-tions in urine and whole blood associated with amalgam exposure in a US military population J Dent Res 77:461–467. Levy M, Schwartz S, Dijak M, Weber J-P, Tardif R, Rouah F. 2004. Childhood urine mercury excretion: dental amalgam and fish consumption as exposure factors. Environ Res 94:283–290.
Liang K-Y, Zeger SL. 1986. Longitudinal data analysis using generalized linear models. Biometrika 73:13–22. Mackert JR Jr., Bergland A. 1997. Mercury exposure from
den-tal amalgam fillings: absorbed dose and the potential for adverse health effects. Crit Rev Oral Med 8:410–436. Magos L, Halbach S, Clarkson TW. 1978. Role of catalase in the
oxi-dation of mercury vapor. Biochem Pharmacol 27:1373–1377. Makre G, Balbus J, Parkin R. 1986. Children’s susceptibility to
chemicals: a review by developmental stage. J Toxicol Environ Health 7:417–436.
McKeown-Eyssen GE, Ruedy J, Neims A. 1983. Methyl mercury exposure in northern Quebec. II. Neurologic findings in children. Amer J Epidemiol 118:470–479.
Pesch A, Wilhelm M, Rostek U, Schmitz N, Weishoff-Houben M, Ranft U, et al. 2002. Mercury concentrations in urine, scalp hair, and saliva in children from Germany. J Expo Anal Environ Epidemiol 12:252-258.
Pingree SD, Simmonds PL, Rummel KT, Woods JS. 2001a. Quantitative evaluation of urinary porphyrins as a measure of kidney mercury content and mercury body burden dur-ing prolonged methylmercury exposure in rats. Toxicol Sci 61:234–240.
Pingree SD, Simmonds PL, Woods JS. 2001b. Effects of 2,3-dimercapto-1-propanesulfonic acid (DMPS) on tissue and urine mercury levels following prolonged methylmer-cury exposure in rats. Toxicol Sci 61:224–233.
Rossi AD, Ahlbom E, Ogren SO, Nicotera P, Ceccatelli S. 1997. Prenatal exposure to methylmercury alters locomotor activity of male but not female rats. Exp Brain Res 117:428–436.
Skare I, Engqvist A. 1990. Urinary mercury clearance of dental personnel after a long-term intermission in occupational exposure. Swed Dent J 14:255–259.
Skare I, Engqvist A. 1994. Human exposure to mercury and sil-ver released from dental amalgam restorations. Arch Environ Health 49:384–394.
Svare CW, Paterson LC, Reinhardt JW, Boyer DB, Frank CW, Gay DD, et al. 1981. The effect of dental amalgam on mer-cury levels in expired air. J Dent Res 60:1668–1671. Suzuki T, Hongo T, Abe T, Matsuo N, Inoue N. 1993. Urinary
mercury levels in Japanese school children: influence of dental amalgam fillings and fish eating habits. Sci Total Environ 136:213–227.
Thomas DJ, Fisher HL, Sumler MR, Mushak P, Hall ll. 1987. Sexual differences in the excretion of organic and inor-ganic mercury by methyl mercury-treated rats. Environ Res 43:203–216.
U.S. Environmental Protection Agency. 2000. Strategy for Research on Environmental Risks to Children. EPA/600/R-00/068. Washington, DC:U.S. Environmental Protection Agency.
Vahter M, Åkesson A, Lidén C, Seccatelli S, Berglund M. 2007. Gender differences in the disposition and toxicity of met-als. Environ Res 104:85–95.
Vimy MJ, Lorscheider FL. 1985. Intra-oral air mercury released from dental amalgam. J Dent Res 64:1069–1071. Woods JS. 1995. Porphyrin metabolism as indicator of metal
expo-sure and toxicity: In: Handbook of Experimental Pharma-cology: Toxicology of Metals—Biochemical Aspects (Goyer RA, Cherian MG, eds). Berlin:Springer-Verlag, 115:19–52. Woods JS, Martin MD, Naleway CA, Echeverria D. 1993. Urinary
porphyrin profiles as a biomarker of mercury exposure: studies in dentists with occupational exposure to mercury vapor. J Toxicol Environ Health 40:235–246.