Quality of life of caregivers
of overweight or obese children
and adolescents
*QUALIDADE DE VIDA DE CUIDADORES DE CRIANÇAS E ADOLESCENTES COM SOBREPESO OU OBESIDADE
CALIDAD DE VIDA DE CUIDADORES DE NIÑOS Y ADOLESCENTES CON SOBREPESO O OBESIDAD
RESUMO
Este estudo avaliou a qualidade de vida re-lacionada à saúde (QVRS) de cuidadores de crianças e adolescentes com sobrepeso e obesidade. Trezentos e sessenta cuidadores de crianças e adolescentes com idade entre 9 e 12 anos, com diagnóstico de sobrepeso (n=96; idade média=11,1 anos), obesidade (n=62; idade média de 10,9 anos) e eutrofia (n=202; idade média de 10,7 anos), matri-culadas em escolas públicas e particulares da cidade de Uberlândia (MG), foram convida-dos a responder o questionário "The 36 item Short Form Questionnaire" (SF-36). Os es-cores obtidos pelo questionário foram com-parados segundo o índice de massa corpórea (IMC) das crianças e adolescentes e não fo-ram encontradas diferenças significativas entre os cuidadores de crianças e adolescen-tes com sobrepeso, obesidade e eutrofia. Logo, os cuidadores de crianças e adolescen-tes com sobrepeso ou obesidade não apre-sentam prejuízo na sua QVRS.
DESCRITORES
Qualidade de vida Cuidadores Criança Adolescente Sobrepeso Obesidade
*Taken from the thesis "Quality of life of caregivers to children and adolescents with overweight or obesity", Universidade Federal de Uberlândia, 2007. 1M.Sc. in Health Sciences, Universidade Federal de Uberlândia. Specialist in Health, Nutrition and Child Food, Universidade Federal de São Paulo. Nutritionist, Hospital das Forças Armadas, Distrito Federal. Brasília, DF, Brazil. [email protected] 2Ph.D., Professor, Primary Healthcare Nursing Department, Nutrition Program, School of Nursing, Universidade Federal de Minas Gerais. Belo Horizonte, MG, Brazil. [email protected] 3 Adjunct Professor, School of Mathematics, Universidade Federal de Uberlândia. Uberlândia, MG, Brazil. [email protected] 4M.Sc. in Health Sciences, Universidade Federal de Uberlândia. Neurologist, Hospital de Clínicas, Universidade Federal de Uberlândia. Uberlândia, MG, Brazil. [email protected] 5Ph.D. in Neurology from University of São Paulo at Ribeirão Preto Medical School. Neuropediatrician, Hospital de Clínicas, Universidade Federal de Uberlândia. Uberlândia, MG, Brazil. [email protected] 6Undergraduate Student, Medical Program, School of Medicine, Universidade Federal de Uberlândia. Uberlândia, MG, Brazil. [email protected] 7Associate Professor, Department of Pediatrics, School of Medicine, Universidade Federal de Uberlândia. Uberlândia, MG, Brazil.
O
RIGINAL
A
R
TICLE
Tatiana Rocha Melo1, Ann Kristine Jansen2, Rogério de Melo Costa Pinto3, Rogério Rizo de Morales4, Nívea Macedo Morales5, Marília Martins Prado6, Carlos Henrique Martins da Silva7
ABSTRACT
This study evaluated the health-related quality of life (HRQL) of caregivers of over-weight and obese children and adolescents. Three-hundred and sixty caregives of chil-dren and adolescents (ages ranging from 9 to 12 years) diagnosed with overweight (n=96; average age 11.1 years), obesity (n=62; average age 10.9 years) and eutro-phy (n=202; average age 10.7 years), regu-lar students of public and private schools in Uberlândia (Minas Gerais), were invited to answer "The 36 item Short Form Ques-tionnaire" (SF-36). The scores obtained were compared according to the body mass index (BMI) of the children and adolescents, and no significant differences were found between caregivers of overweight, obese and etrophic children and adolescents. Hence, there is no harm to the HRQL of caregivers of overweight and obese chil-dren and adolescents.
DESCRIPTORS
Quality of life Caregivers Child Adolescent Overweight Obesity
RESUMEN
Este estudio evaluó la calidad de vida rela-cionada a la salud (QVRS) de cuidadores de niños y adolescentes con sobrepeso y obe-sidad. Trescientos sesenta cuidadores de niños y adolescentes con edad entre 9 y 12 años, con diagnóstico de sobrepeso (n=96; edad media=11,1 años), obesidad (n=62; edad media 10,9 años) y eutrofia (n=202; edad media 10,7 años), matriculados en escuelas públicas y particulares de la ciu-dad de Uberlandia (MG, Brasil), fueron in-vitados a responder el cuestionario "The 36 items Short Form Questionnaire" (SF-36). Los puntajes obtenidos por el cuestionario fueron comparados según el índice de masa corporal (IMC) de los niños y adolescentes y no se encontraron diferencias significati-vas entre los cuidadores de niños y adoles-centes con sobrepeso, obesidad y eutrofia. Se infiere que los cuidadores de niños y ado-lescentes con sobrepeso y obesidad no pre-sentas perjuicio en su QVRS.
DESCRIPTORES
INTRODUCTION
Child obesity is an emerging public health problem and this is a source of concern, as a direct relation exists be-tween a high body mass index in childhood and hyperlipi-demia, insulin resistance, hypertension, obesity and car-diovascular disease in adult life(1). Most of the consequences for health (respiratory, orthopedic, gastrointestinal, neu-rological and endocrine) will be clinically relevant in adult life only. Immediate morbidities (hepatic steatosis, sleep apnea, slipped capital femoral epiphysis and type 2 diabe-tes) can occur in overweight and obese children and ado-lescents(1). Psychosocial repercussions, however, such as low self-esteem(2), stigmatization and compromised quality of life, are the most significant in the short term(1). The in-crease in the Body Mass Index (BMI) is inversely propor-tional to children and adolescents’ quality of life(2-8).
The repercussions of chronic illnesses also affect the family universe and can hamper its members’ quality of life and family dynamics (comprising the home economy and care for the other children)(9). Family caregivers to chil-dren and adolescents with chronic health
problems do not only have their common re-sponsibilities, but also assume additional tasks to comply with their children’s treatment agenda.
According to the World Health Organiza-tion, quality of life (QoL) is defined as
individuals’ perception of their position in life in the context of the culture and value systems in which they live and in relation to their goals, expectations, standards and concerns(10).
In the biomedical area, health-related
quality of life (HRQoL) describes individuals’ perception in the physical, psychological and social function.
Programs to welcome and treat children and adoles-cents with overweight and obesity show diverging results. A study carried out in 2005 found negative results in treat-ment for these children(2), while another carried out in 2008(7), showed favorable treatment results, reducing harm for quality of life. Better knowledge on patients and family members’ psychosocial demands may contribute to more effective health actions(8). Hence, the assessment of patients and family caregivers’ wellbeing can contribute to analyze the results of health actions for the treatment of overweight and obesity in this age range.
Until date, the HRQoL of caregivers to overweight and obese children and adolescents has not been assessed. As the main health problems deriving from this disease are not immediately perceptible(4), it is postulated that caregivers to children and adolescents with overweight/ obesity show no negative impact on their HRQoL, although it contributes to higher stress levels among caregivers(11).
OBJECTIVE
The goal of this study is to get to know the HRQoL of caregivers to children and adolescents with overweight or obesity through the SF-36 (36 - Item Short Form Health Survey Questionnaire).
METHOD
A cross-sectional research was carried out, after obtain-ing approval from the Institutional Review Board at Universidade Federal de Uberlândia on June 17th 2005, un-der protocol No 129/05. The study was accomplished be-tween August 2005 and February 2006, with the coopera-tion of three previously trained research aids.
Participants
Caregivers (parents or responsible persons) to children and adolescents enrolled in public and private schools from different regions of Uberlândia (North, South, East, West and Center) were invited to participate in the study, with ages ranging between nine and twelve years and whose nutritional status was marked by overweight, obesity and eutrophy.
To calculate the sample size, prevalence levels of 10% for overweight and 2 to 3% for obesity were considered among children and adolescents(12), as well as the number of chil-dren and adolescents enrolled in private and public schools in Uberlândia–MG, in the age range chosen for the study. A 95% confidence interval and a maximum error of 3% were set.
A proportion of 3:1 was maintained be-tween the group of caregivers to obese children and ado-lescents and the group of caregivers to eutrophic children and adolescents, and 2:1 between the overweight and eutrophic group.
Caregivers to overweight and obese children and ado-lescents constituted the study groups. For the sake of com-parison, caregivers to eutrophic children and adolescents were selected.
The children and adolescents’ nutritional status was as-sessed through the Body mass index (BMI = Weight/Height²) and Height/Age indicators, expressed as the difference be-tween the observed ratios and the reference ratios for age and gender, with distance from the mean quantified in per-centiles, according to the reference population. The Cen-ter for Disease Control’s anthropometric standard was used for reference purposes(13).
The anthropometric Height/Age ratio higher than per-centile 3 and BMI between perper-centiles 5 and 85 were de-fined as eutrophy; BMI equal to or higher than percentile 85 but lower than percentile 95 as overweight, and BMI equal to or higher than percentile 95 as obesity.
...the assessment of patients and family caregivers’ wellbeing
can contribute to analyze the results
Obese children and adolescents were classified accord-ing to the severity percentage of the BMI in percentile 95, through the formula: % severity of BMI P95 = (current BMI/ BMI P95) X 100(14)
.
Mild obesity was considered as the case in which the severity percentage of the BMI in percentile 95 reached up to 110%, moderate between 111% and 120%, and severe above 120%.
Caregivers who reported chronic illnesses were excluded from all groups.
Anthropometric measures
Anthropometric measures were taken according to the World Health Organization’s descriptions(15):
•
Weight – platform scales were used, brand Marte, ca-pacity up to 200 kg and 50-gram division.•
Height – height was measured with a 150-centimeter metric tape, with one-millimeter precision, with the help of a wooden set square.Instrument:The 36 – Item Short Form Health Survey Ques-tionnaire (SF - 36)
The SF-36 is a generic instrument for HRQoL assessment, widely used to assess different health conditions. The ques-tionnaire was translated to Portuguese, validated and cul-turally adapted for the Brazilian population(16). The SF-36 is based on a multidimensional health model that comprises two components – the physical and the mental. The physi-cal component contains the following domains: role limita-tions due to physical health, general health perceplimita-tions, bodily pain and physical functioning. The mental compo-nent contains the domains of mental health, vitality, social functioning and role limitations due to emotional problems.
The domain scores are obtained by adding up the item scores in each domain, just like the component scores de-rive from the related domains, ranging from 0 to 100, which indicates the worst and best possible general health per-ceptions, respectively.
To test the reliability of the SF-36, i.e. this instrument’s degree of precision, the reliability of the instrument’s in-ternal consistency was verified.
Procedures
After drafting the schools that would participate in the research, the persons in charge were contacted to clarify the research aims and, then, obtain permission to accom-plish the study.
Anthropometric measures of weight and height were ob-tained and the BMI was calculated to classify the nutritional status of children and adolescents between the third and
sixth grade of primary education, between nine and twelve years of age. Through a draft, the number of children and adolescents with overweight, obesity or eutrophy was se-lected, as defined in the sample plan. Then, their caregivers were contacted by phone to receive explanations about the study aims and were invited to participate in the research.
Caregivers who agreed to participate signed the In-formed Consent Term, provided information about the child (name, birth date, gender), personal information (age, edu-cation level, marital status, family income) and answered the SF-36 through an interview.
SF-36 domain and component scores of caregivers to children and adolescents with overweight, obesity and eu-trophy were compared, as well as the SF-36 domain and component scores of caregivers to children and adolescents with mild, moderate and severe obesity. Correlations were established between the SF-36 domain and component scores and the BMI.
Statistical analysis
Descriptive analysis was used for socio-demographic characterization, as well as for the determination of the children, adolescents and caregivers’ nutritional character-istics. To compare socio-demographic data among groups, Pearson’s chi-square test was applied.
Normality was tested for all data through D’Agostino’s test, showing that the data did not show normal distribution.
The reliability of internal consistency was verified through Cronbach’s alpha coefficient for each multi-item scale.
Kruskal-Wallis’ test was used to compare the mean scores of the SF-36 domains and components for the caregivers to children and adolescents with overweight, obesity and eutrophy.
Spearman’s correlation coefficient was used to verify the relation between the SF-36 domains and components and the BMI.
The significance level to reject the null hypothesis was set at p<0.05.
RESULTS
Socio-demographic characteristics
Most caregivers (87.6 %) were mothers, with a mean age of 37.6 years (27 to 60 years; SD=6.80), 38.1 years (28 to 62 years; SD=6.50) and 35.6 years (24 to 53 years; SD=5.6), re-spectively, for children and adolescents with overweight,
obesity and eutrophy. In all groups, caregivers were distrib-uted similarly according to marital status and family income. Among caregivers to children and adolescents with obesity, more caregivers had finished primary education (Table 1).
Table 1 – Socio=demographic data of caregivers according to children and adolescents’ nutritional status
Overweight n=96
Obesity n=62
Eutrophy n=202
Mean age in years (SD) 37.6 (6.8) 38.1 (6.5) 35.6 (5.6)
Caregiver n (%)
Mother 85 (87.6) 55 (88.7) 184 (90.7)
Education n (%)*
Illiterate 1 (1.0) 0 (0.0) 1 (0.5)
Unfinished primary 35 (36.5) 15 (24.2) 78 (38.6)
Finished primary 18 (18.8) 19 (30.6) 20 (10.1)
Unfinished secondary 29 (30.2) 20 (32.3) 70 (34.7)
Finished higher 13 (13.5) 8 (12.9) 33 (16.3)
Marital status n (%)
Married 74 (76.3) 46 (74.2) 157 (77.4)
Family income n (%)
Up to 3 minimum wages 32 (33,3) 18 (29,0) 50 (24,5)
Between 3 and 5 minimum wages 34 (35,4) 28 (45,9) 82 (40,2)
More than 5 minimum wages 30 (31,2) 16 (25,8) 72 (35,5)
* Significant (p<0.05) according to Chi-Square test; SD= standard deviation
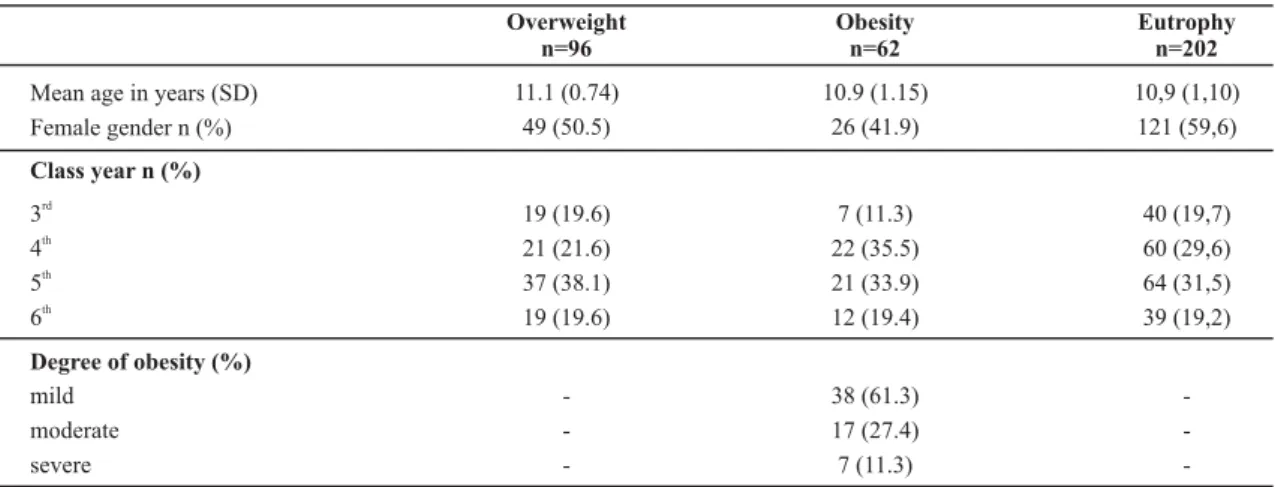
The mean ages of overweight, obese and eutrophic chil-dren and adolescents were, respectively, 11.1 years (SD=0.74), 10.9 years (SD=1.15); 10.9 years (SD=1.10),
rang-ing between 9 and 12 years. No significant differences were found when confronting gender and class year with nutri-tional status (Table 2).
Table 2 – Clinical and socio-demographic characteristics of children and adolescents according to nutritional status
Overweight n=96
Obesity n=62
Eutrophy n=202
Mean age in years (SD) 11.1 (0.74) 10.9 (1.15) 10,9 (1,10)
Female gender n (%) 49 (50.5) 26 (41.9) 121 (59,6)
Class year n (%)
3rd
19 (19.6) 7 (11.3) 40 (19,7)
4th
21 (21.6) 22 (35.5) 60 (29,6)
5th
37 (38.1) 21 (33.9) 64 (31,5)
6th
Degree of obesity (%) mild
moderate severe
19 (19.6)
-12 (19.4)
38 (61.3) 17 (27.4) 7 (11.3)
39 (19,2)
SD = standard deviation
Out of 62 obese children and adolescents, 38 (61.3%), 17 (27.4%) and 7 (11.3%) were classified as mild, moderate and severe obesity, respectively.
Assessment of HRQoL
Cronbach’s alpha coefficient was higher than 0.70 on all SF-36 domains for the different groups, except for the
social functioning domain in all groups and the bodily pain
domain in the group of caregivers to obese children and adolescents.
Table 3 – Median, minimum and maximum scores for SF-36 domains and components in caregivers according to classification of children and adolescents’ nutritional status
Domains and components Overweight
(Min-Máx)
Obesity (Min-Máx)
Eutrophy
(Min-Máx) *p value
Role limitations due to physical health 95 (30-100) 90 (20-100) 90 (20-100) 0.19
Physical functioning 100 (1-100) 100 (0-100) 100 (0-100) 0.82
Bodily pain 72 (0-100) 67 (10-100) 72 (0-100) 0.90
General health perceptions 82 (17-100) 82 (20-100) 90 (10-100) 0.68
Role limitations due to emotional problems 100 (0-100) 100 (0-100) 100 (0-100) 0.78
Vitality 65 (15-100) 75 (15-100) 68 (5-100) 0.06
Mental health 68 (16-100) 76 (8-96) 72 (4-100) 0.24
Social functioning 81 (13-100) 88 (13-100) 88 (13-100) 0.07
Physical component 53 (26-68) 52 (25-61) 53 (21-66) 0.46
Mental component 49 (12-67) 53 (11-63) 50 (13-64) 0.09
* Kruskal Wallis test
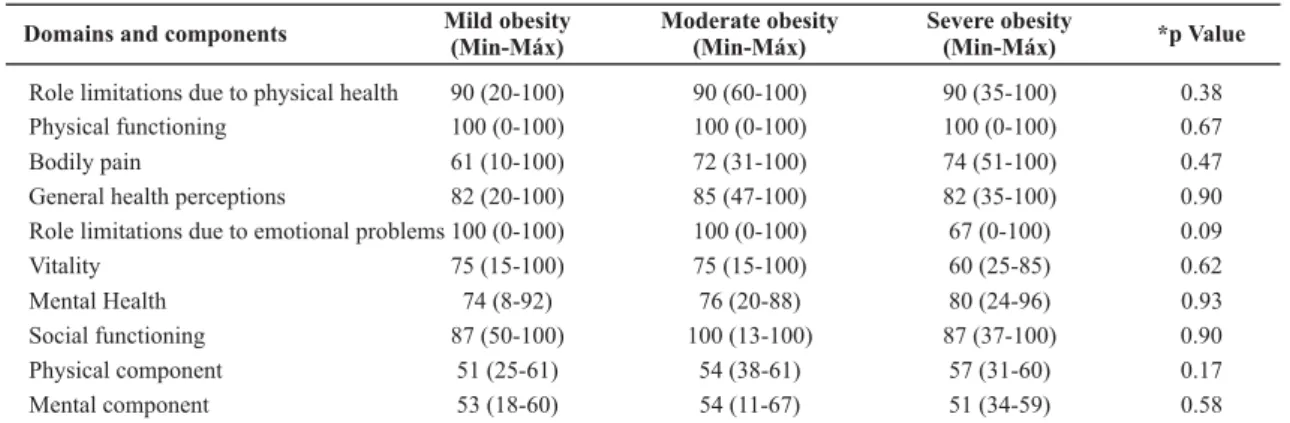
No differences were found (p>0.05) in SF-36 domain and component scores among groups of caregivers for children
and adolescents with mild, moderate and severe obesity (Table 4).
Table 4 – Comparison of SF-36 domains according to obesity
Domains and components Mild obesity
(Min-Máx)
Moderate obesity (Min-Máx)
Severe obesity
(Min-Máx) *p Value
Role limitations due to physical health 90 (20-100) 90 (60-100) 90 (35-100) 0.38
Physical functioning 100 (0-100) 100 (0-100) 100 (0-100) 0.67
Bodily pain 61 (10-100) 72 (31-100) 74 (51-100) 0.47
General health perceptions 82 (20-100) 85 (47-100) 82 (35-100) 0.90
Role limitations due to emotional problems 100 (0-100) 100 (0-100) 67 (0-100) 0.09
Vitality 75 (15-100) 75 (15-100) 60 (25-85) 0.62
Mental Health 74 (8-92) 76 (20-88) 80 (24-96) 0.93
Social functioning 87 (50-100) 100 (13-100) 87 (37-100) 0.90
Physical component 51 (25-61) 54 (38-61) 57 (31-60) 0.17
Mental component 53 (18-60) 54 (11-67) 51 (34-59) 0.58
* Kruskal Wallis test
The correlations between the SF-36 domain scores and the children and adolescents’ BMI were weak and non-sig-nificant (p>0.05) (Table 5).
Table 5 – Spearman Correlation Coefficients between BMI and
SF-36 domains and components
Domains BMI *p value
Role limitations due to physical health -0.07 0.20
Physical functioning -0.04 0.46
Bodily pain -0.04 0.48
General health perceptions 0.02 0.64
Role limitations due to emotional problems 0.01 0.87
Vitality -0.02 0.66
Mental health 0.05 0.34
Social functioning -0.06 0.26
Physical component -0.07 0.19
Mental component 0.04 0.46
* t test
DISCUSSION
The use of a generic instrument to assess the HRQoL of children and adolescents with overweight or obesity, such as the SF-36, and the comparison with a group of caregivers to children and adolescents with eutrophy, confirmed the hypothesis that overweight and obesity in children and ado-lescents do not cause a negative impact on their caregivers’ physical and psychosocial function. The present study results are interesting because the harm various studies observed in terms of obese children and adolescent’s HRQoL(3-6) could negatively affect the caregivers’ HRQoL (3-5,7-8).
their weight and non-acceptance of their body, making them feel marginalized in society. Other aspects these young people highlight refer to the pejorative nicknames related with excess weight, inducing them to low self-esteem, limitations in physi-cal exercise, in addition to feelings of impotence and failure. Just like children, they feel difficulties related to clothes, mak-ing new friends and datmak-ing situations(17).
Sometimes, obese children and adolescents can seem happy and carefree in social life, but suffer from feelings of inferiority, dissatisfaction and affective shortage, and tend to reveal a pro-found need to be loved and accepted(17). On the other hand, one cannot affirm that they all present psychological problems, as a relation between obesity and anxiety is not always observed in obese children and adolescents(18).
Due to obesity’s psychological and physical repercus-sions, it is fundamental to raise caregivers’ awareness of children and adolescents’ nutritional status, whose alter-ations in most cases develop as a reflex of parents or re-sponsible persons’ food and physical exercise habits.
Although obesity is a chronic illness, related with in-creased morbidity and mortality levels, and provokes a negative impact on children and adolescents’ physical and/ or psychosocial and/or school functioning as the BMI in-creases(3-6), in this study, their caregivers’ quality of life did not show alterations as their children’s BMI increased, not even between different degrees of obesity.
It is interesting that, in the vitality and mental health
domains and in the mental component, higher median scores were found for caregivers to obese children and ado-lescents (in comparison with the medians of caregivers to eutrophic children and adolescents), although not statisti-cally significant. These results could indicate a trend towards a better mental function in caregivers to obese children and adolescents. A generic instrument like the one used here – the SF-36 – may not be able to identify specific differences (like in the psychosocial function), in case these exist, be-tween caregivers to overweight, obese and eutrophic chil-dren and adolescents. Another plausible explanation would be the fact that, in general, in the short term, obesity in this age range is not associated with severe health compli-cations, which is the case with other chronic illnesses.
Studies show that, often, parents do not consider over-weight or obesity a disease and underestimate their children’s weight(19-21). It is estimated that only 48% of the parents cor-rectly identify their children’s weight(19) and the fact that the mother is overweight makes her underestimate the weight of her sons and daughters even more than a normal-weight mother(20-21), although both tend to underestimate their daughters’ weight more frequently than their sons ‘ weight(20).
In some cases, the parents acknowledge obesity as a risk for health, but react as if it were a momentary problem that will be solved as the children grow up, and forget that, the longer a person stays obese, the greater the chance that this nutritional status and its associated consequences will continue(20).
According to the parents of children and adolescents with overweight or obesity, their children are no more physically limited than eutrophic children regarding habits and skills to perform activities, except in children younger than six years(22). The same author describes that only 26% of par-ents are concerned with their children’s weight and agree that they very strongly influence their children’s food choices and physical exercise(22). Another study shows that 33% of parents consider themselves responsible for child obesity, but do not take any attitude to control this situation(23).
Approximately 20% of caregivers to overweight and obese children and adolescents show some type of stress related to their children’s disease, which is considered low in com-parison with other chronic illnesses that reveal a greater im-pact on parents’ lives(11). These findings can contribute to avoid negative influence on the quality of life of caregivers to overweight and obese children and adolescents, while that of caregivers for other chronic illnesses is affected.
In general, the Brazilian version of the SF-36 is a reliable instrument for use in the assessment of caregivers to over-weight and obese children and adolescents. Internal consis-tency reliability was adequate, except in the social function-ing domain (Cronbach’s alpha below 0.70). This domain con-tains only two items with inverse answers, which can cause greater comprehension difficulty than in other domains.
The SF-36 provides relevant data, is multidimensional and very practical, due to its rapidness and easy applica-tion. As it is a generic instrument, however, it does not ad-dress different psychosocial aspects that could be present in caregivers of overweight and obese children and adoles-cents. Hence, the use of a generic instrument may not be sufficient to detect important specific aspects of a condi-tion or illness that interfere in people’s quality of life. A specific instrument for caregivers would be more adequate for the study, but existing instruments have not been trans-lated into Portuguese yet, nor validated and culturally adapted to the Brazilian population. Thus, there is an ur-gent need for translation and validation research on spe-cific instruments for the study population, due to the grow-ing increase in obesity levels in Brazil.
CONCLUSION
In conclusion, it should be emphasized that overweight and obesity in children and adolescents did not influence their caregivers’ quality of life, which may be related to the non-acknowledgement of obesity as a chronic illness that contributes to increased morbidity and mortality levels.
Further research is needed to better assess the quality of life of caregivers to overweight and obese children and adolescents, so that health professionals, based on
knowl-edge about the actual impact of this illness in caregivers’ lives, can advise them better.
REFERENCES
1. Whitlock EP, Williams SB, Gold R, Smith PR, Shipman SA. Screening and interventions for childhood overweight: a summary of evidence for the US Preventive Services Task For-ce. Pediatrics. 2005;116(1):e125-44.
2. Griffiths LJ, Parsons TJ, Hill AJ. Self-esteem and quality of life in obese children and adolescents: a systematic review. Int J Pediatr Obes. 2010;5(4):282-304.
3. Schwimmer JB, Burwinkle TM, Varni JW. Health-related quality of life of severely obese children and adolescents. JAMA. 2003;289(14):1813-9.
4. Friedlander SL, Larkin EK, Rosen CL, Palermo TM, Redline S. Decreased quality of life associated with obesity in school-aged children. Arch Pediatr Adolesc Med. 2003; 157(12):1206-11. 5. Swallen KC, Reither EN, Haas SA, Meier AM. Overweight, obesity
and health related quality of life among adolescents: the National Longitudinal Study of Adolescent Health. Pediatrics. 2005;115(2):340-7.
6. Williams J, Wake M, Hesketh K, Maher E, Waters E. Health-related quality of life of overweight and obese children. JAMA. 2005; 293(1):70-6.
7. Wille N, Erhart M, Peterson C, Ravens-Sieberer U. The impact of overweight and obesity on health-related quality of life in childhood-results from an intervention study. BCM Public Health. 2008;8:421-9.
8. Wille N, Bullinger M, Holl R, Hoffmeister U, Mann R, Goldapp C, et al. Health-related quality of life in overweight and obese youths: results of a multicenter study. Health Qual Life Out-comes. 2010;8:36-62.
9. Stein REK, Jessop DJ. A non categorical approach to chronic
childhood illness. Public Health Rep.1982;97(4):354-62. 10. The World Health Organization Quality of Life assessment
(WHOQOL): position paper from the World Health Organiza-tion. Soc Sci Med. 1995;41(10):1403-10.
11. Guilfoyle SM, Zeller MH, Modi AC. Parenting stress inpacts obesity-specific health-related quality of life in a pediatric obesity tretatment-seeking sample. J Dev Behav Pediatr. 2010;31(1):17-25.
12. International Association for the Study of Obesity (IASO); International Obesity Tasckforce. Childhood obesity [Internet]. London; 2005 [cited 2005 Mar 10]. Available from: http:// www.iotf.org/childhoodobesity.asp
13. Centers for Disease Control and Prevention (CDC). National Center for Health Statistics. Growth Charts [Internet]. Atlanta; 2000 [cited 2005 Mar 10]. Available from: http://www.cdc. gov/growthcharts.
14. Cintra IP. Avaliação da composição corporal e do gasto energético basal em crianças pré-púberes, com obesidade grave, na vigência de programa de orientação nutricional [tese doutorado]. São Paulo: Escola Paulista de Medicina, Univer-sidade Federal de São Paulo; 1999.
15. World Health Organization (WHO). Physical status: the use and interpretation of anthropometry. Report of a WHO Expert Commitee. Geneva; 1995.
16. Ciconelli RM. Tradução para a língua portuguesa e validação do questionário genérico de avaliação da qualidade de vida ‘’Medical Outcomes Study 36-Item Short-Form-Health Survey (SF-36) [dis-sertação]. São Paulo: Escola Paulista de Medicina, Universidade Federal de São Paulo; 1997.
17. Ferriani MGC, Dias TS, Silva KZ, Martins CS. Auto-imagem cor-poral de adolescentes atendidos em um programa multidis-ciplinar de assistência ao adolescente obeso. Rev Bras Saúde Mater Infant. 2005;5(1):27-33.
18. Carvalho AMP, Bugliani MAP, Netto JRC, Borges CD, Mariano FN, Brancaleoni AP, et al. Maturidade emocional, lócus de controle e ansiedade em pré-adolescentes obesos. Paidéia (Ribeirão Preto). 2001;11(20):39-47.
19. Etelson D, Brand DA, Patrick PA, Shirali A. Childhood obesity: do parents recognize this health risk? Obes Res. 2003;11(11):1362-8.
20. Boutelle K, Fulkerson JA, Neumark-Sztainer D, Story M. Mothers’ perceptions of their adolescents’ weight status: are they accurate. Obes Res. 2004;12(11):1754-7.
21. Doolen J, Alpert PT, Miller SK. Parental disconnect between perceived and actual weight status of children: a metasynthesis of the current research. J Am Acad Nurse Pract. 2009; 21(3):160-6.
22. Eckstein KC, Mikhail LM, Ariza AJ, Thomson JS, Millard SC, Binns HJ, et al. Parents’ perceptions of their child’s weight and health. Pediatrics. 2006;117(3):681-90.
23. Nazario Rodriguez IJ, Figueroa WI, Rosado J, Parrilla Idel C. Perception of parents regarding their children’s weight. Bol Assoc Med PR. 2008;100(2):33-8.