1
Ligand accessibility to heme cytochrome b5 coordinating sphere and enzymatic activities enhancement upon tyrosine ionization
Alejandro K. Samhan-Arias 1, Cristina M. Cordas 1, Marta S. Carepo 1, Luisa B. Maia 1, Carlos Gutierrez-Merino 2, Isabel Moura 1 and José J. G. Moura 1
(1) LAQV, REQUIMTE, Departamento de Química, Faculdade de Ciências e Tecnologia, Universidade Nova de Lisboa, 2829-516.
(2) Department of Biochemistry and Molecular Biology, Faculty of Sciences, and Institute of Molecular Pathology Biomarkers, University of Extremadura, 06006 Badajoz, Spain.
Corresponding authors: [email protected] and [email protected]. Phone numbers: +351- 91-8376729 and +351-21-2948382
2 ABBREVIATIONS
Cb5, cytochrome b5; CD, circular dichroism; CV, cyclic voltammetry; DTPA, diethylene triamine
pentaacetic acid; D2O, deuterium oxide; EDTA, ethylenediaminetetraacetic acid; EPR, electron
paramagnetic resonance; GDN, guanidine chloride; H2O2, hydrogen peroxide; NHE, hydrogen
3 ABSTRACT
Recently, we observed that at extreme alkaline pH, cytochrome b5 (Cb5) acquires a
peroxidase-like activity upon formation of a low spin hemichrome associated to a non-native state. A functional characterization of Cb5, in a wide pH range, shows that oxygenase/peroxidase
activities are stimulated in alkaline media, and a correlation between tyrosine ionization and the attained enzymatic activities was noticed, associated to an altered heme spin state, when
compared to acidic pH values at which the heme group is released. In these conditions, a competitive assay between imidazole binding and Cb5 endogenous heme ligands revealed the
appearance of a binding site for this exogenous ligand that promotes a heme group exposure to the solvent upon ligation. Our results shed light on the mechanism behind Cb5
oxygenase/peroxidase activity stimulation in alkaline media and reveal a role of tyrosinate anion enhancing Cb5 enzymatic activities on the distorted protein before maximum protein unfolding.
KEYWORDS: cytochrome b5; tyrosine ionization; hydrogen peroxide; oxygenase; peroxidase; b-type hemoproteins.
4 INTRODUCTION
Oxidation is the most common event associated to loss of hemoproteins function. The most typical example is the case of hemoglobin where methemoglobin, the oxidized form of
hemoglobin, is unable to bind oxygen. Hemoprotein autoxidation process occurs naturally in vivo and it is estimated that 1.9-3.8% of the hemoglobin found in blood is in the methemoglobin form, although higher percentages can be found in children [1]. Several causes have been related to hemoproteins oxidation including, genetic diseases, drug administration and oxidative stress [2, 3]. The ferric hexacoordinated aqueous state, in equilibria with the hydroxy form, are the most common states found in the hemoglobin superfamily during oxidation [4], although other forms of this protein have also been detected [5]. In metalloproteins, ligand accessibility to the metal is required for acquisition of enzymatic activities, although protein hemichromes
(hemoproteins with conformational changes not implicating unfolding and alteration of heme coordination) present enzymatic activities [6-8]. In hemoglobin, a reversible hemichrome type called hemichrome H was thought to represent the imidazole ligation to the heme group, with water displaced and capable to renature to functional hemoglobin [9]. Upon incubation in time, hemichrome H can be transformed to hemichrome B, which is incapable to renature to functional hemoglobin [5]. The electron paramagnetic resonance (EPR) parameters (g-values) of the
hemoglobin hemichrome B were similar to those found for Cb5 [10], where the hemichrome H
had g-values similar to those present upon addition of base to bis-imidazole heme complex or to Cb5 [11, 12].
Due to presence of hemichromes in vivo (i.e. cold-water fishes, where different hemichrome types of hemoglobin have been reported), a biological relevance of these states has been suggested [13].
5
The interaction of ligands with Cb5 has been overlooked for years due to its full coordination
sphere. Cb5 at neutral pH occupies its non-covalently bond heme group to histidine residues, in
the fifth and sixth positions, holding this protein as member of the heme b-type hemoprotein family, with electron carrier properties. Some early studies with Cb5 showed that this protein can
acquire a high-spin state after protonation and deprotonation [11, 12, 14]. In addition, mutations of the Cb5 coordinating histidines allowed the binding of other ligands like CN-, CO and O2 to
the hemoprotein [15, 16]. Very recently, we have found that at extreme alkaline pH values (pH 12), Cb5 acquires a peroxidase-like activity upon formation of a low spin hemichrome associated
to a non-native state [7]. This hexacoordinated hemichrome is characterized by a time dependent loss of the Soret band, a lower redox potential that the one found at neutral pH, associated to a more oxidized state of the protein, and a lack of tryptophan fluorescence increase associated to change of the folding properties. The hemichrome state could monitor the protein transition between hexa- and pentacoordinated states, with an accessible binding site to exogenous ligands, when the protein is in this transition. Noteworthy, it is unknown whether hydroxide anion has a specific role on its formation. The pKa of some amino acid residues in the alkaline range can be
listed: lysine (pKa less than 10.4 [17], arginine pKa approximately 13.8 [18] and tyrosine
10.3-10.4 [19]. In addition, the fluorescence properties of tyrosine allow to easily determine the exact pKa for this residue of each protein that can be modulated by a specific microenvironment [20].
In the present manuscript, changes induced by pH on heme Cb5 were monitored by cyclic
voltammetry (CV), nuclear magnetic resonance (NMR), electronic absorption, fluorescence, EPR and Circular Dichroism (CD) spectroscopies. A structure-function characterization of the protein allowed us to reveal a catalytic peroxidase/oxygenase activity of Cb5, that accompanies
6
dependent on the stable form found at alkaline pH, that keeps the heme group bound to the peptide chain.
7 MATERIAL AND METHODS
Purification of recombinant human erythrocyte Cb5. Purification of recombinant human erythrocyte Cb5 was performed by overexpression of the protein using transformed BL21
(DE3)-derived strains of E. coli containing the recombinant plasmid as described before [21]. NMR. Samples were measured using 0.5 mM Cb5 samples, in buffer + 10% D2O. NMR
spectroscopy experiments were carried out at 25ºC in a Bruker Avance II-600 spectrometer equipped with a TCI cryoprobe and a variable temperature control unit. The zgesgp pulse sequence was chosen, with a spectral width of 70 ppm, 64k data points, and 1024 scans
accumulated per spectrum. Experiments were carried out by adjusting the pH with the addition of small amounts of HCl or NaOH and monitored by a Crison micro pH 2002 pH meter equipped with a micro pH electrode (Cat #5209). All spectra were processed using TOPSPIN 3.2 (Bruker). Assignments for all four heme methyl groups, the 2-vinyl protons, two of the four propionate β-methylene protons and some amino acid side chains in the vicinity of pyrroles I and II have been reported previously [22, 23]. 1H chemical shifts were referenced to the H
2O resonance (4.76 ppm
at 298 K).
Fluorescence measurements. Tryptophan fluorescence of Cb5 (5 μM) was measured using a
fluorescence spectrophotometer (Perkin Elmer 650–40; Perkin Elmer, Norwalk, CT, USA) and a quartz thermostated cuvettes (2 mL) at 25ºC. The excitation and emission wavelengths were 290 nm and 350 nm, respectively. The excitation and emission slits were 2 and 5 nm, respectively. The buffer used in the measurements was potassium phosphate 100mM, Borate 50 mM, KCl 150 mM, EDTA 1 mM prepared at different pH values, or GDN 10 M, under stirring. Tyrosine
8
The fixed excitation and emission wavelengths were 270 nm and 305 nm. The excitation and emission slits were 2 and 4 nm, respectively.
Inner filter correction was applied to fluorescence data, as previously indicated [21, 24, 25]: 𝐹𝑐𝑜𝑟𝑟 = 𝐹𝑜𝑏𝑠 ∗ 10^(
Exc O.D.+ Em O.D.
2 )
where Fcorr and Fobs are the corrected and observed fluorescence, respectively, and Exc O.D. and Em O.D. are the sample optical densities at the excitation and emission wavelengths,
respectively.
Electrochemistry. All measurements were performed at room temperature in anaerobic
conditions (20 min of argon bubbling and keeping the electrochemical cell under positive argon atmosphere during the assays) as previously indicated [7]. The experiments were attained using a PGSTAT12 or a PGSTAT30 AUTOLAB potentiostat/galvanostat and analysis of the data was performed using GPES (Eco Chimie) software. Working electrode was a mercaptopropionic acid modified gold disk, secondary electrode was a Pt wire and as reference an Ag/AgCl electrode was used, in a single cell compartment. Proteins were immobilized using a membrane (3 kDa cut-off). CV assays were performed at different scan rates to define the best conditions to
measure Cb5 redox features and its pH dependence (5 mV/s). Second scans of multiple assays (at
least 3 replicates), performed at each pH value were used for the analysis. All the potentials were converted and are presented in reference to the normal hydrogen electrode scale (NHE).
EPR measurements. The X-band EPR spectrum of Cb5 at different pH values was measured as
previously described [7], using a Bruker EMX 6/1 spectrometer and a dual mode ER4116DM rectangular cavity (Bruker); the samples were cooled with liquid helium in an Oxford
9
were acquired at 10 K, with a modulation frequency of 100 kHz, modulation amplitude of 0.5 mT and microwave power of 635 μW. Assays conditions are described in figures captions.
Oxygenase and peroxidase activity. Oxygenase and peroxidase activity were measured tracking the oxidation of Amplex Red [7], in absence and presence of H2O2, respectively. Fluorescence
was recorded using a spectrofluorimeter Perkin-Elmer 650-40 with the following set up:
excitation and emission wavelengths of 530 nm and 590 nm, with excitation and emission slits of 5 and 10 nm and normal gain. Resorufin was used to calibrate the signal.
Imidazole binding analysis.
Titrations with imidazole were performed after incubations of Cb5 (50 μM) in a buffer with the
following composition: phosphate buffer 100 mM, Borate 50 mM, KCl 150 mM, EDTA 1 mM at the indicated pH for each experiment. Incubation times were selected based on Cb5 Soret band
stabilization kinetic present at each pH. After protein incubation, Cb5 was diluted to 5 μM with
buffer prepared at the same pH but supplemented with imidazole. Absorbance spectra were immediately recorded. The dissociation constant for the complex formation was calculated based on the Soret absorbance increase at 414 nm observed, when Cb5 was added to the buffer in the
presence of increasing imidazole concentrations. The analysis of imidazole binding to the protein was performed as indicated in [26]. Only imidazole is able to bind to the heme center in
relationship to. imidazolium and imidazolate that do not bind (pKa1 and pKa2 is 7.05 and 14.4,
respectively) The calculated amount of imidazolate was approximately 1 % at pH 13.5 and thus omitted in calculation of the free imidazole amount present at the measured alkaline pH values. Circular Dichroism measurements. Circular dichroism (CD) measurements were carried out in a Chirascan qCD spectrometer (Applied Photophysics) at 25 ºC. The Cb5 (16 µM or 50 µM) CD
10
cell of 10 mm or 0.2 mm, respectively. Cb5 concentration was 15 µM and the visible CD
measurements were done at different pH values, 4, 7, 11, 11.5, 12 and 12.5 Cb5. The CD spectra
were recorded after protein incubation in buffers at different pH values, for the previously indicated times at which the Soret band absorbance was stabilized. The acquisition conditions were the following: Step Size: 1 nm, Bandwidth: 1 nm, 3 scans. The protein was afterwards incubated with imidazole (250 mM) at the same pH values and the CD spectra were acquired using the same experimental conditions.
Materials. All Materials used to perform the experiments shown in this manuscript were analytical grade commercial reagents.
Statistical analysis. All the results reported in this paper are the average ± standard error (SE) of triplicate experiments.
11 RESULTS
Structural alterations of Cb5 induced by pH
We assigned the following resonances for the heme group on the 1H-NMR spectra by
comparison with previously published assignments of Cb5 [22, 23]: 5-Me, 7 CH, 6
alpha-CH, 6’ alpha-alpha-CH, 3-Me, 1-Me, corresponding to the resonances found at 21.7, 18.8, 16.4 , 15.4, 13.9 and 11.9 ppm respectively at pH 7.0 (Figure 1A). We found a major contribution for only one of the two heme isomers described for Cb5 (assignment of the resonances at 31.3 and 21.7
ppm, for the 3'-Me corresponding to the "minor" and the 5-Me of the "major" orientation, respectively) being in the range of previously described ratios (1:5) for this protein [27]. On the pH range between 6 and 10, only modest changes were found in accordance with the presence of a low spin Cb5 at pH 7.0 [7, 27]. In addition, the one-dimensional NMR spectra of
Cb5 obtained at these pH values are the typical for a well folded protein. At alkaline and acid pH,
chemical shift dependence of the heme resonances was found with pH. A decrease of the resonances intensities was revealed above pH 11, to almost disappear at pH 12. The residual intensities were only detectable when the same experiments were performed by increasing the transients accumulation at pH 12 (Supp Fig S1). Therefore, at pH 12, we identified the following signals of the following Cb5 heme resonances (peak b= 21.89 ppm that corresponds to 5-Me and
peak e= 12.02 ppm that corresponds to 1-Me) also present in samples at pH 11 with some deviations. Noteworthy, we were not made an assignment in some cases due to resonance overlapping between two of them, in correlation with results described in the literature: (peak a=28.12 ppm that might correspond to 2α-vinyl or a 8-Me of Cb5 minor isomer [28]; c= 17.16
ppm that might correspond to 7-α CH minor isomer or meso Hs as previously described [28]. Moreover, we also found a very weak signal (d= 14.81 ppm) that we can speculate to correspond
12
to 3-Me and the undetermined * and *’ at 20.5 ppm and 19.79 ppm. In addition, we did not find resonances above 35 ppm (up to 150 ppm), that might suggest formation of high spin species (Supp. Fig S1). At pH 6.0, we found a decrease of the signal intensity that correlated with a protein tendency to aggregate at pH values below 5.0 (Figure 1A). Hence, the 1H NMR spectra
of Cb5 reported at pH 4.5 are related to the percentage of Cb5 present in solution (approximately
50 % at pH 4.5, based on the number of scans per spectrum needed to approximately acquire the same NMR spectrum obtained at pH 5.0).
The same behavior found for the oxidized Cb5 was also found for the reduced form (Supp. Fig.
S2). We made a tentative assignment of some of the human erythrocyte ferroCb5 heme
resonances based on those described for the trypsin digested native bovine liver Cb5 reduced
with dithionite at pH 7.0 [29], which sequence was previously shown to be identical to that of erythrocyte Cb5 [30]. The signals found at 9.91 ppm and 9.71 ppm would mainly correlate with
those of δ meso-H and β meso-H signals found for the major isomer of the native bovine liver ferroCb5 at 9.88 ppm and 9.71 ppm, but also the δ meso-H and β meso-H of the minor isomer
attributed to the resonance at 9.71 ppm at pH 7.0 of the trypsin digested bovine liver ferroCb5
[29].
Our data show that below pH 7, the signal intensity of the ferroCb5 heme resonances decreased
with a sample aggregation and precipitation below pH 5. At alkaline pH values, we observed a decrease of the signal intensity of ferroCb5 heme resonances above pH 9 with a detection lack of
these resonances above pH 12 (Supp. Fig. S2).
To further prove that the changes observed in samples incubated below pH 5.0 were associated to sample aggregation, we evaluated this phenomenon by measuring the light scattering of samples in a range of pH values (Figure 1B). We found a time dependent increase of the scattering
13
inducing fluorescence in samples incubated at pH 4.0 that was maximum after 5 minutes
incubation (Figure 1B, inlet), not found in samples incubated at the rest of the measured alkaline pH values (Figure 1B).
HSQC experiments were also performed at pH, 4.8, 7.0 and 11.6 with the 15N labeled protein in
the presence of 10% of D2O (Figure 1C). The obtained NMR spectra suggest different protein
behaviors when samples were incubated at alkaline or acid pH values. Spectra obtained at pH 7.0 resembles to that previously obtained for this protein at this pH [21]. A deterioration of Cb5
HSQC spectra was observed at pH 11.6, manifested by a qualitative intensity decrease of some of the heme resonances. This effect correlated with that found for other proteins with a distorted conformation [31]. The sample spectra of Cb5 incubated at pH 4.8 differs from that obtained at
pH 11.6 and pH 7. The narrow distribution of chemical shifts in the free protein indicates that the protein started to get denatured as a behavior observed in the HSQC spectra of other proteins in this state [32-34].
Moreover, Cb5 secondary structure changes upon alkaline pH were studied by far-UV CD
(Figure 1D). At pH 7.0 (black line), we obtained a far-UV CD spectrum typical of a mainly α-helix protein with two negative maximums at 206 and 220 nm as previously described [35]. A decrease of the 220 nm band was observed at pH 11 (green line), although the protein was still structurally ordered. At pH 12 (red line), the 220 nm band further decreases and a negative band at 202 nm appears showing that at this pH we have a more disorder form of the protein and the secondary structure is being affected. A more pronounced change to that measured at pH 12 was observed for the sample incubated at pH 12.5 (pink line). HSQC and CD spectra clearly
14
Figure 1. 1H-NMR spectra of Cb5. 1H-NMR spectra of Cb
15
operating at 600.13 MHz were measured using a solution of protein at 500 μM prepared in the following buffer: potassium phosphate 100 mM, borate 50 mM, KCl 100 mM, EDTA 1 mM 10 % D2O and measured using a 5 mm NMR tube. Samples were adjusted to the selected pH using
a microelectrode before each measurement. Panel A shows the Cb5 spectra at the region from 35
to 10 ppm at pH 5.0, 6.0, 7.0, 8.0, 10.0, 11.0 and 12.0. Panel B shows light scattering
measurements of Cb5 incubated for 5 minutes in buffer prepared at different pH values using a
Perkin Elmer 650–40; Perkin Elmer, Norwalk, CT, USA) using quartz cuvettes (2 mL)
thermostated at 25 ºC. The inlet shows the kinetics of the increase of light scattering of samples incubated at pH 4.0 (black line) vs. pH 12.0 (red line). Panel C 15N- and 1H-HSQC spectra of Cb5 (160 μM) in buffer at pH values: 7.0, 11.6 and 4.8. Spectra were acquired with 15N labeled
protein in presence of D2O at 298 K using a Bruker Avance 600 MHz spectrometer equipped
with a TCI cryoprobe. The 2D spectra were processed with TOPSPIN 2.1 (Bruker). The number of peaks counted over the background signal was 134, 57 and 134 for the samples incubated at pH 7, 11.6 and 4.8, respectively. Panel D. Cb5 far-UV CD spectra incubated at different pHs.
Measurements were carried out in a Chirascan qCD spectrometer (Applied Photophysics) at 25 ºC as indicated in the Material and Methods and recorded from 190-260 nm, using a quartz cell of 0.2 mm. Cb5 concentration was 50 µM and the measurements were performed at different pH
values, 7 (black line), 11 (green line), 12 (dark blue line), and 12.5 (light blue line) at time 0. Panel E shows Cb5 EPR spectra at the X-band for samples incubated at pH 12.0 (red) 5.0 (black)
and 4.0 (blue). The EPR spectra of Cb5 incubated at pH 12.0 has been previously published [7].
We also studied the effect of acidic pH values (pH less than 7) on Cb5 by EPR spectroscopy,
aiming to follow the heme spin state changes and to compare them with those described at alkaline pH values (red line) [7] (Figure 1E). At pH 5.0 (black line), the Cb5 spectrum shows a
low spin signal (S = 1/2) identical to that described at pH 7.0 (g1,2,3 = 3.05, 2.20, 1.36 [7]). Yet, at
pH 4.0 (Figure 1E, blue line) the spectrum shows features characteristic of axial high spin (S = 5/2) Fe3+ species, with a main component at g⊥= 5.8, for which a g
// is approximately 2 is
expected (not resolved). An intensity signal decrease of the Cb5 EPR spectra sample incubated at
pH 4.0, in respect to pH 5.0 and 12.0, could be associated to protein precipitation, as demonstrated by light scattering experiments.
Cb5 oxygenase activity and correlation with redox potential
Activity measurements. Previous NMR and EPR experiments showed spin alterations on Cb5 at
16
position on a protein can be used to foresee those conditions in which enzymatic activities can occur [36]. Since peroxidase and oxygenase activities share catalytic intermediaries in
hemoproteins, oxygenase activity can be analyzed as a secondary activity present in proteins with peroxidase activity.
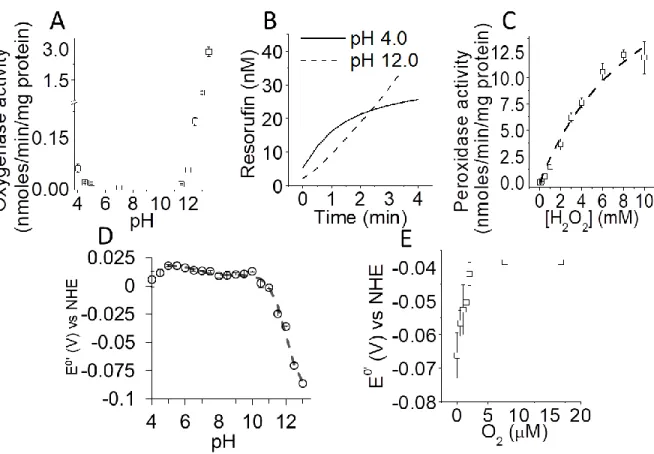
Figure 2 Measurement of the oxygenase and peroxidase activity of Cb5. Cb5 oxygenase
activity dependence upon pH (panel A). Cb5 (1 μM) was incubated in buffers prepared at
different pH values. Amplex red oxidation was measured as indicated in the Material and
Methods section. The signal was calibrated at each pH with resorufin to obtain the values for the oxygenase activity. The kinetic for the oxygenase activity of Cb5 at pH 4.0 (continuous line) and
13.0 (dashed line) is shown in panel B. The peroxidase activity of Cb5 at pH 4.0 dependence
with H2O2 is shown in panel C. Cb5 formal redox potential vs. pH plot is shown in panel D.
Plotting of the formal redox potential data vs. pH shows the large shift on the potential induced by incubation of Cb5 in alkaline pH. Dashed grey line indicates the best data fitting considering
two protonation processes. The effect of O2 on Cb5 redox potential at pH 12 is shown in panel E.
A plot of the Cb5 formal redox potential changes induced by O2 is shown. Redox potential of Cb5
17
Measurement of the Amplex red oxidation dependence upon pH, at a constant Cb5 concentration
(1 μM) allowed us to determine the pH where maximum oxygenase activity can be measured (Figure 2A). A calibration curve with resorufin, the oxidation product of Amplex Red, at each pH allowed us to determine that the maximum oxygenase activity is reached at pH 4.0 and 13.5. At acid pH (pH 4.0), analysis of initial rates for Amplex Red oxidation (Figure 2B, continuous line) let us to determine an oxygenase activity of 0.06 ± 0.01 nmoles/min/mg of Cb5, although the
activity was stopped after a couple of minutes (Figure 2B, continuous line). Addition of Cb5 to
the buffers above pH 11.5 induced an increase on Amplex Red oxidation. After a lag phase of one minute, an acceleration of the activity over time was detected (Figure 2B, dotted line). The maximum measured oxygenase activity of Cb5 was found at alkaline in relationship to acidic pH
values (at pH 13.5 the activity was 2.8 ± 0.2 nmoles/min/mg). Since the oxygenase activity measured at pH 12 (0.05 ± 0.01 nmoles/min/mg protein) was similar to that found at pH 4.0 (table 1), we measured the peroxidase activity of Cb5 at pH 4.0 (Figure 2C) to compare with the
values previously reported at pH 12 [7]. Addition of H2O2 to the sample (1 μM) induced a
prominent increase on Amplex Red oxidation that was dependent upon H2O2 concentration. The
curve was fitted to a two substrates Michaelis-Menten equation, considering Amplex red and H2O2 as substrates [7], to obtain a kcat value of 11 ± 1 ms-1 and a Km for H2O2 of 12.3 ± 2.6 mM,
for the peroxidase activity at pH 4. A summary of the reported activities of Cb5, using Amplex
red as substrate can be found in table 1. Although a correlation between activity and a negative shift on redox potential was previously shown [7], the complete redox potential changes sequence with the pH was also measured.
Redox potential measurement. Cb5 redox behavior was evaluated by thin layer cyclic
18
normalized current intensity after blank subtraction) obtained at different pH values are plotted in Figure 2D (Supp. Figures S3A, S3B and S3C, shows original voltammograms before subtraction and Supp. Figure S3D after subtraction). The formal potential of Cb5 suffers a small shift
between pH 6 and 10, being the formal potential increase around 10 mV (Figure 2D). The
obtained pKox and pKred values are close, respectively, 6.7 ± 0.1 and 6.8 ± 0.1 and are similar to previously reported values by Lloyd and co-workers (pKox and pKred of 6.0 ± 0.1 and 6.3 ± 0.1) [27]. However, due to its similarity (pKox approximately pKred) we must also consider the hypothesis that these values might not have physical meaning. When the redox potentials were measured in a wider pH scale range, we noticed that Cb5 was suffering a strong shift on the redox
potential of around 90 mV from pH 10.0 to pH 13.0 (Figure 2D). Below pH 5.5 we were also able to detect a smaller shift on its redox potential towards negative values, although we could not achieve to measure the changes associated to the whole transition since there are some limitations to measure the redox potential below pH 4.0 i.e.: loss of the current signal in respect to the controls. Fitting of the curve to a two pH dependent equilibria, allowed us to obtain the apparent pKa values at alkaline conditions: pKox = 11.6 ± 0.1 and pKred = 12.3 ± 0.1. Since we
cannot exclude that at alkaline pH Cb5 conformational state may be affected, (Figure 2D) the pK
values obtained at these pH ranges should be only considered as apparent pK values. O2 binding to Cb5 at alkaline pH. A comparison of Cb5 redox potential measurements
performed under aerobic or anaerobic, allowed us to quantify a 30 mV difference on the protein formal potential between conditions. This difference may indicate O2 binding to the protein
center, associated to changes in the redox potential at pH 12. Cb5 formal potential calculated
from voltammograms obtained in strict anaerobic conditions, inside an anaerobic chamber, upon the presence of non-deoxygenated water (oxygen concentration present in water was measured
19
with an Oxygraph Plus DW1 electrode, Hansatech Instruments), were suffering a concentration-dependent shift towards positive values (Figure 2E). A shift of the formal potential with
increasing amounts of O2 was found, demonstrating the existence of protein interaction with the
gas that may be binding to the heme group, since this ligation is expected to alter the center’s formal potential [37, 38]. Plotting of Cb5 formal redox potential values shifts upon different O2
concentration exposition is shown in Supp. Figure S3E. The data were fitted to a rectangular hyperbolic curve of the type: y = P1*x/ (P2 + x) were P1 is the number of binding sites (in our case, one center), x is the concentration of O2 and P2 is equivalent to the equilibrium binding of
the ligand to Cb5. Solution of this equation gave us a Kd value of 1 ± 0.2 μM for the complex
O2:Cb5.
Autofluorescence measurements
Tryptophan fluorescence. Tryptophan fluorescence was used to track structural changes on Cb5
is associated to its folding state (Figure 3A). Addition of Cb5 to the buffer at pH 4.0 (black line),
revealed a kinetic process leading to an increase of the tryptophan fluorescence intensity in relationship to pH 7.0 (dashed line), with a half-life lower than 1 min, that correlated with the times where maximum oxygenase activity was shown at acid pH (Figure 2B). An increase on the tryptophan autofluorescence was found above pH 12.1 (Figure 3A and Supp. Figure S4), being the rate of the kinetic process faster at pH values higher than 12.6, although reaching the same maximum fluorescence intensity between pH 12.6 and 13.2. Cb5 fluorescence intensity found at
acid and alkaline pH were lower than those obtained with GDN 6 M (red line), that contrast with the intensity signal of the fully unfolded protein and pointing out that only a partial unfolding of Cb5 is reached at pH values 4.0 and 12.6-13.2.
20
Tyrosinate ion. Cb5 tyrosine fluoresce was measured as indicated in the Material and Methods
section. The fluorescence spectra of Cb5 at pH 7.0 shows a maximum emission fluorescence
band at 305 nm (black line) when an excitation wavelength at 270 nm was used (Figure 3B). The same spectra measured at pH 12.0 shows a decrease of the emission fluorescence intensity (arrow), that can be used to measure the pKa of this residue, as calculated for other proteins [20].
The pKa value of free tyrosine is known (10.3-10.4) [19]. Noteworthy, the pKa value of the
tyrosine residue in peptides and proteins can drastically shift depending on the microenvironment [20, 39-41]. The wavelengths at which Cb5 shows the maximum fluorescence peak was
monitored after addition of increasing concentrations of KOH (Figure 3C). As shown in this figure, the results fit well to the Henderson-Hasselbalch equation, and allows to calculate a pKa
of 11.1 ± 0.1.
Figure 3. Tryptophan and tyrosine fluorescence of Cb5. Tryptophan fluorescence was measured as previously shown [7] and indicated in the Material and Methods section (panel A) at: pH 4.0 (dotted black line), 7.0 (continuous red line) and 12.6 (continuous grey line). The fluorescence intensity at each pH was compared to that obtained of Cb5 in 6 M of guanidine
chloride (GDN) (dotted red line). Emission spectra of Cb5 prepared at pH 7.0 (black line) and pH
12.0 (grey line) with a tyrosine excitation wavelength of 270 nm are shown in panel B. Cb5
fluorescence was measured as indicated in the Material and Methods section using a
fluorescence spectrophotometer (Perkin Elmer 650–40; Perkin Elmer, Norwalk, CT, USA) using quartz thermostated cuvettes (2 mL) at 25 ºC. The fixed excitation wavelength was 270 nm. The
21
excitation and emission slits were 2 and 4 nm, respectively. Data intensities were normalized in this figure relative to the fluorescence intensity at pH 7.0 (F0). Cb5 tyrosine’s fluorescence was
titrated with pH with a fixed emission wavelength (305 nm) (panel C). Increasing amounts of concentrated NaOH were added to the cuvette to obtain a pKa for tyrosine ionization.
Cb5 absorption spectra at acid and alkaline pH.
Cb5 absorption was also studied over the pH. Cb5 visible spectra were recorded from 350 nm to
750 nm wavelengths from pH 4.0 to 12.0. The protein remained stable with no changes on the visible spectra from pH 5 to 10. At acid pH (Figure 4A) from 5.0 (blank line) to 4.0 (grey line), we found the existence of a fast transition on Cb5 absorbance spectra. At pH 4.0, Cb5 suffered a
loss and shift of the Soret band at 413 nm to 407 nm and loss of the bands at 532 nm and 560 nm. We also found that these changes were paired with a slight absorbance intensity increase of bands located at 360-380 nm, 490-520 nm and 630-650 nm (Figure 4A, inset graph). Appearance of these bands is indicative of acquisition of a high spin state by Cb5 at this pH [12], but these
bands are also reminiscent to that found for free hemin. In addition, centrifugation of the sample at pH 4.0 during 15 minutes at 15,000 g, showed precipitation and formation of a red pellet suggesting aggregates formation in the sample, or heme release to the media, as previously measured at acid pH when the apoprotein is prepared [42]. As previously shown, the spectral changes of Cb5 incubated at alkaline pH can be easily monitored through its Soret band [7]. Cb5
absorbance was tracked in time at 414 nm (Figure 4B). An acceleration of the absorbance loss rate was observed when the protein was incubated at pH values above 11.0.
22
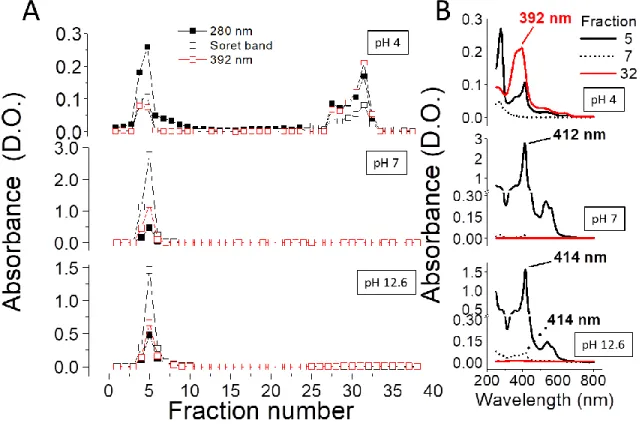
Figure 4. Cb5 electronic absorption spectra at acid and alkaline pH values. Cb5 absorbance
spectra (5 μM) was measured at pH 5.0 (black line) and 4.0 (grey line) panel A. The inlet figure shows a zoom of on the 600-700 nm region for the sample incubated at pH 4.0, where a band at 635 nm rises. The kinetic of the Cb5 Soret band absorbance lost (414 nm) of Cb5 at pH 11.0
(black line) 11.5 (red line), 12.0 (blue line), 12.5 (pink line) and 13 (green line) is shown in panel B.
Heme binding properties to the peptide chain at different pH values
To further determine the ligation properties of the heme group to the protein, at different pH values where the Soret band was shown to disappear, Cb5 (1 mL, 50 μM) aliquots prepared at
different pH conditions were loaded onto a PD-10 (GE Healthcare) desalting chromatographic support (5 kDa exclusion limit) (Figure 5). The protein (determined by the peak at 280 nm) was mainly eluted in fraction 5 at all measured pH values: 4.0, 7.0 and 12.6. A dependence of the Soret band intensity with pH was found. In addition, the band at 280 nm in fraction 5 (and the tail observed in following fractions) of the sample prepared at pH 4.0 were more intense than that found for Soret band, suggesting that the heme group was released from the protein. At pH 12.6, we found a decrease of the Soret band respect to the sample run at pH 7.0, but with a similar ratio between Soret and absorbance at 280 nm. In the sample previously incubated at pH
23
4.0, a fraction (32) was eluted from the column upon washing the column with NaOH, with maximum absorbance spectra at 392 nm (reminiscent to that high spin heme) with a shoulder at 380 nm (reminiscent to that of free heme). Non-spectral differences were found in the same fractions obtained at pH 7.0 and 12.6. Figure 5B shows the spectra of different fractions (5, 7 and 32) for samples prepared at pH 4.0, 7.0 and 12.6.
Figure 5. Measurement of heme binding to the Cb5 peptide chain at different pH values. Analysis of the heme binding properties to the peptide chain was performed by loading the protein incubated at different pH values: 4.0, 7.0 and 12.6 onto a PD10 column (8 mL)
equilibrated at the same pH (panel A). After loading the sample, the column was washed with 15 mL of buffer and spectra of 1 mL aliquots was measured. After washing the column with 10 mL of water, NaOH (0.5 M) was added to the column. The absorbance spectra of eluted fractions with NaOH were measured. Spectra of fractions 5, 7 (eluted with washing buffer at each pH) and 32 (eluted with NaOH) are shown in panel B for each pH 4.0, 7.0 and 12.6.
24 Imidazole interaction with Cb5.
Visible spectra of Cb5 incubated at alkaline pH and imidazole effect. We analyzed the effect of imidazole as a potential ligand for the heme cavity, when this cavity is available. For other soluble hemoproteins, exogenous ligands have the ability to bind to the heme group by displacement of the native ligand i.e. methionine in the case of Cyt c and Cyt c2 [43, 44].
Therefore, imidazole binding to some hemoproteins produces a blue shift in the Soret region [45]. In the case of some Cb5 mutants, the spectra are expected to change after addition of
imidazole when it has been used for the same purpose [46].
To quantify the changes induced by imidazole on the protein, we measured the difference spectra of Cb5 in presence and absence of imidazole, once the Soret band absorbance was stabilized
(Figure 4B). The difference spectra for pH 11.0, 11.5, 12.0, 12.5 and 13.0 are shown in Supp. Figure S5. Each line corresponds to the following imidazole concentrations: 50, 100,150, 200, 250, 300, 400 and 500 mM. At pH values below 12.5, the decrease of the Soret band was dependent upon imidazole concentration being synchronized in time with the appearance of a band around 430-436 nm. Both events were dependent upon the imidazole concentration present in the assay (band changes are indicated by arrows). This effect was better observed when a difference spectrum was recorded (imidazole vs. no imidazole addition) at pH 11.5 (grey line) (Figure 6A and Supp. Figure S5). At pH 12.5 and above, addition of imidazole induced an increase of the Soret band (maximum absorbance at 410-414 nm), as shown by the difference spectra of a sample incubated with imidazole vs no imidazole at pH 13.5 (Figure 6A, black line and Figures. S5C, S5D and S5E). The plot of the absorbance increment of the 414 nm band dependence upon imidazole concentration at different pH values is shown in Figure 6B. The curves were fitted to the equation described in the Material and Methods section. We calculated a
25
Kd value for imidazole complex with Cb5 at each pH: 6.1 ± 1.1 μM, 3.0 ± 2.0 μM, 0.4 ± 0.2 μM,
0.5 ± 0.1 μM, 0.3 ± 0.2 μM and 2 ± 0.5 μM with Hill’s coefficient (n) of: 1 ± 0.4, 1.2 ± 0.1, 1.6 ± 0.3, 1.6 ± 0.3, 1.7 ± 0.3, 1.2 ± 0.4 for pH 11.0, 11.5, 12.0 12.5, 13 and 13.5, respectively. The Soret band absorbance recovery induced by imidazole at saturating concentration (500 mM) (green bars) was compared to Cb5 absorbance after Soret band stabilization with time (white
bars), at each pH before imidazole addition (Figure 6C). The maximum absorbance recovery reached and induced by the presence of imidazole (500 mM) was also plotted as a dependence upon pH (Figure 6C, inlet figure) allowing us to obtain a pKa of 12.4 ± 0.1. To further discern
between the interaction of imidazole to the heme ligated to Cb5 or free heme group at alkaline
pH we measured the Soret-CD spectra of free hemin and Cb5, in the absence and presence of
imidazole.
Figure 6. Cb5 spectral changes induced by imidazole. Difference spectra of samples incubated at pH Cb5 11.5 and 13.5 in the presence of increasing imidazole concentrations in respect to
26
Soret band lost was stabilized. Aliquots were prepared dilute concentration (5 μM) in buffer prepared at each pH with the imidazole concentration indicated in the figure. The absorbance increment dependence with imidazole concentration of samples associated to changes in the Soret band measured at 414 nm is shown in panel B. A plot of the Soret absorbance lost (grey bar) upon incubation of the sample at each pH and the recovery of the Soret band induced by imidazole (green bar is shown in panel C). Inlet indicates the recovery of the absorbance by imidazole (500 mM) dependent with pH. Cb5 Soret-CD spectra was measured as indicated in the
Material and Methods section after incubation of the sample (15 μM) at each pH at the times were the Soret band lost was stabilized (panel D). The effect of imidazole (250 mM) on Cb5
Soret-CD spectra was measured (panel E). The CD spectra of hemin (15 μM) complexed with increasing imidazole concentration at pH 12.0 is shown in panel F (arrows indicate the shift direction on hemin spectra incubated with increasing imidazole concentrations).
CD spectra of Cb5 incubated at alkaline pH and imidazole effect. The Soret-CD spectra of Cb5 was obtained at different pH values, 4.0, 7.0, 11.0, 11.5, 12.0 and 12.5 (Figure 6D). At pH
7.0 the Soret-CD spectra has a negative band at 419 nm and a positive shoulder at 392 nm and 485 nm (red line).
At acid pH (4.0) (black line), the heme CD signal observed at pH 7.0 disappears suggesting a loss of chirality by the heme group. At alkaline pH values, there was a pH dependent
disappearance of the CD bands (pH 11.0 and 11.5, green line and blue line, respectively). At pH 12.0 (light blue line), the Soret-CD signal almost disappears and at pH 12.5 (pink line), there is no signal. Soret-CD spectra of Cb5, in the presence of imidazole was recorded at the same pH
values and the results are shown in Figure 6E. At pH 4.0, there was no signal and no changes induced by imidazole were found in the CD spectra. At pH 7.0 imidazole presence did not affect the CD spectra. At pH 11.0 an intensity decrease of the heme negative signal (at 419 nm) was observed with imidazole added to the assay. At pH 11.5 and 12.0, imidazole induced
disappearance of the negative band at 419 nm and a positive band at 439 nm started to appear simultaneously. At pH 12.5 a strong symmetrical band appears with a negative maximum at 419 nm and a strong positive band with a maximum at 440 nm.
27
To differentiate between the heme signal from the protein complexed with imidazole from that of the free hemin complexed with imidazole, CD spectra of the hemin-imidazole complex was measured at pH 12.0 (Figure 6F). The CD spectra of a hemin solution 16 μM in the presence of imidazole 250 mM at this pH had a major positive band with a maximum at 440 nm with a minor negative shoulder at 401 nm.
DISCUSSION
A structural and functional characterization of Cb5 enzymatic activity has been performed at
alkaline and acid pH, based on previous reports showing a shift on the spin state induced by protein protonation and deprotonation [11, 12, 14]. We previoulsy reported a peroxidase activity of Cb5 dependent upon the acquisition of a non-native state by the protein at pH 12 (7). These
results become highlighted when activities are compared between extreme pH values (pH 4.0 and 13.5) and show that protein reactivity is associated to the loss of the native protein structure. The oxygenase activity is higher at alkaline pH where the protein was still hexacoordinated than at acidic pH, where the heme group is mainly released (Figures 1, 2 and 5) [7]. This effect was more clearly reflected when the peroxidase activity was measured and compared at both pH values: 4.0 and 12.0 (Table 1). The weak peroxidase activity at pH 4.0 vs. 12.0 is supported by measured enzymatic parameters: lower kcat value for the peroxidase activity at acid pH (11 ± 1
ms-1) in comparison to alkaline pH (k
cat =700 ± 100 ms−1), as also denoted by the lower Vmax 26 ±
5 nmoles/min/mg of Cb5 respect to 578 ± 41 nmoles/min/mg found at pH 12.0 [7], at saturating
28
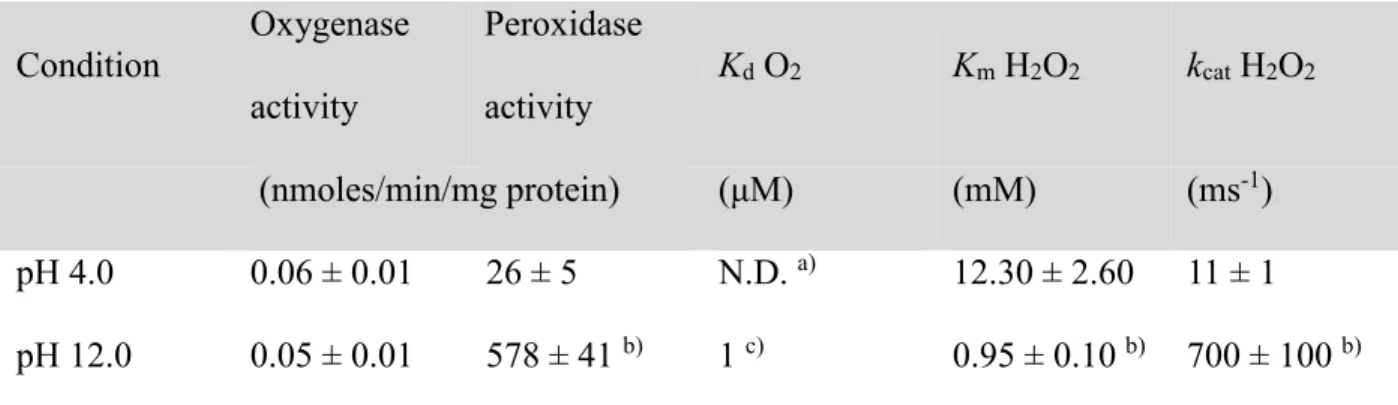
Table 1. Enzymatic parameters of the peroxidase and oxygenase activity of Cb5
Condition Oxygenase activity Peroxidase activity Kd O2 Km H2O2 kcat H2O2 (nmoles/min/mg protein) (μM) (mM) (ms-1) pH 4.0 0.06 ± 0.01 26 ± 5 N.D. a) 12.30 ± 2.60 11 ± 1 pH 12.0 0.05 ± 0.01 578 ± 41 b) 1 c) 0.95 ± 0.10 b) 700 ± 100 b)
a) The small change observed on Cb5 redox potential did not allow us to accurately calculate
the Km for O2 at acid pH.
b) Calculated from the previously obtained kinetic data [7].
c) Apparent Kd based on cyclic voltammetry data.
The results show that beside the percentage of protein in a high spin state, other forces regulate this activity in alkaline media, since this parameter (spin state) does not sustain the differences on the peroxidase activity found at alkaline and acid pH by itself. Although a peroxidase activity has been shown for free hemin and some analogues, in alkaline media due to formation of oxo-iron porphyrin species [47, 48], this activity is loss upon formation of bis-coordinated bond with imidazole analogues [49]. Moreover, an effect induced by the possible hydroxide anion binding to the heme group at pH 12.0 was discarded, because the Cb5 EPR spectra did not show any
evidence for the interaction of hydroxide with the heme [7]. In order to shed light on this
behavior a structural characterization and correlation with activity was performed at different pH values. 1H-NMR data showed that at both acid (pH 4.0) and alkaline media (pH 12.0), there is
disappearance of the heme resonances (Figure 1A and Supp. Fig. S1) supporting a chemical exchange between different forms which may reflect a spin-equilibrium. Although, we did not
29
observe any additional resonance at higher frequencies (80-30 ppm) characteristics of a high spin state, above pH 11.0 the signal intensity decrease of the Cb5 heme resonances (Supp. Fig. S1) are
correlative with the heme spin alterations, observed by EPR at pH 12 [7].
At low pH values, the apparent decrease in intensity could be ascribed to a broadening beyond detection in the aggregated sample or exchange phenomena between the native species and a minor fraction of the high spin species that becomes dominant at lower pH values. Indeed, in a small protein containing a low spin, S=1/2 , heme ferric ion a large fraction of resonances would experience pseudo contact shifts and the loss of heme shall therefore cause chemical shift
perturbations for all of these resonances.
In addition, our data support a stronger resilience of ferroCb5 vs. ferriCb5 heme resonances to
suffer chemical shifts at alkaline pH values above 11, that correlates with the higher protein pKa
found by electrochemical methods for the reduced protein: pKox = 11.6 ± 0.1 and pKred = 12.3 ± 0.1 for the oxidized and reduced protein, respectively (Supp. Fig. S2).
Our 15N and 1H NMR spectra (Figure 1C) together with the far-UV CD spectra (Figure 1D)
indicates that the protein structure was already significantly affected at alkaline pH values. At pH 11.6, the reduced number of observed resonances in the HSQC spectra (Figure 1C) can be
ascribed to exchange with bulk water. Nevertheless, the distribution of peaks suggests a different protein conformation with respect to neutral pH, as also supported by far-UV CD spectra, where the loss of secondary structure is already evident at pH 11 and pH 12. Noteworthy, the
maximum protein unfolding was only achieved at pH 12.6 as shown by tryptophan fluorescence (Figure 3), with absence of a heme group release from the protein (Figure 5). These results contrast with formation of distorted hexacoordinated Cb5 species found at pH 12, that have an
30
Moreover, the tryptophan fluorescence increase found in samples incubated at pH values above 12, suggest that protein can get further unfolded, although not reaching those levels found by Cb5
incubated at pH 4 or by denaturalization using GDN 6M (Figure 3 and Supp. Fig. S4). Intrinsic tryptophan fluorescence of hemeproteins is very dependent on the quenching effect exerted by the heme group on the tryptophan residues (in this case a singular tryptophan residue present in the peptide chain). These results are in agreement with a heme group displacement in the heme cavity that might be responsible for the detected protein alteration, over the already distorted protein as shown by NMR, EPR and far-UV CD (Figure 1 and Supp. Fig. S1), that affects the catalytic site leading to activity acquisition and ligand interaction with the heme iron (Figure 2 and 6).
This effect can be correlated with Cb5 tryptophan fluorescence behavior when incubated at acid
pH values (Figure 3) that also monitors the ligand accessibility to the heme iron, although for other reasons that does not happen at alkaline pH value, as it is the heme release from the peptide chain (Figure 5). The effect found at acid pH values is coupled with protein aggregation present at pH 4, as measured by light scattering and the narrow distribution of chemical shifts in the Cb5
HSQC spectra at pH 4.8 (Figure 1B and C), that suggest that the protein started to get denatured at acid pH. Precipitation of the sample at acid pH has also been described in other studies [50]. A reason for an immediate precipitation and aggregation of Cb5 at pH values below 5.0 could be
the collapse of the protein net charge from negative to positive values since the isoelectric point for soluble Cb5 was 4.3 [51]. This effect could be induced by glutamate ionization (pKa 4.2 [52])
due to the high number of glutamic residues present in the protein forming part of lobes holding the heme group [53]. In addition, the characteristic EPR high spin spectrum of Cb5 at pH 4.0
31
12.0 [7]. Noteworthy, the oxygenase/peroxidase activity values found at both alkaline and acid pH values were higher than those at found at neutral pH (absence of activity). The high activity found at alkaline media is also supported by the enhanced negative redox potential shifts observed at these pH values (Figure 2D). The formal redox potential of Cb5 found between pH
5.0 and 10.0, where no enzymatic activity was found, was very stable. The strong shift of the Cb5
redox potential found from pH 11.0 to pH 13.0 (approx. ̶ 100 mV) allowed us to obtain an apparent pKox 11.6 ± 0.1 and pKred 12.3 ± 0.1. A change on the redox potential could be
associated to Cb5 penta-coordination, since the protein was found to unfold at pH 12.6 and 4.0
(Figure 3 and Supp. Fig. S4), also correlating with the highest oxygenase values present at both pH values and above pH 12.6 (Figures 2 and 3). A trend toward negative values of the redox potential was also observed in acidic media below pH 6.0, in addition to the alkaline pH values, although aggregation of the sample did not allow us to obtain the conclusive data to calculate the apparent pKox and pKred for the acid transition. Moreover, the different redox potentials observed
between performed experiments, inside and outside the anaerobic chamber, in alkaline media, are in agreement with a possible O2 binding to Cb5, with a Kd of 1 ± 0.2 μM (Figure 2E). This value
in the range of other Kd found for O2 binding to other hemoproteins and in the low micromolar
range [54]. This interaction is also expected to happen at acid media, although the small shift on Cb5 redox potential at pH 4.0 did not allowed us to accurately determine the effect of oxygen
presence on the redox potential. The existence of O2 binding to the protein correlates with the
observed oxygenase activity found at this pH.
Protein autofluorescence emission (in the 300-360 nm wavelength range) recorded with a fixed excitation wavelength at 270 nm show a spectrum with two main contributors: tyrosine and tryptophan [25]. The intensity of these bands can be modulated by some factors, but the
32
microenvironment modulating tyrosine and tryptophan autofluorescence and the distance between these residues (FRET) make not simple the discrimination between them when a 270 nm excitation wavelength is used. Noteworthy, ionization of tyrosine is characterized by a red shift displacement of its maximum emission wavelength, allowing to track this residue ionization [25]. A role of tyrosine ionization has been described in the catalytic cycle of catalases,
delocalizing the heme radical density on proximal weak ligands like tyrosinate or coupling the spin delocalization on this ionized amino acid residue [55, 56]. One of the three tyrosine residues of Cb5 (Y34) is at less than 5 Angstroms from the heme group at neutral pH (Supp. Figure S6),
although we cannot discard the proximity of other tyrosine residues to the heme at alkaline pH. The presence of ionized tyrosine (pKa 11.1 ± 0.1) also correlate with those pH values at which
we started to observe an interaction of imidazole before the measured unfolding by tryptophan fluorescence (pH 11.0-12.0) and the presence of a peroxidase activity associated to the
hexacoordinated Cb5 hemichrome at pH 12.0 [7]. Imidazole has been used to measure
hemoproteins pentacoordination through the visible spectral shifts upon complex formation [45]. We found a differential effect induced by imidazole, in alkaline media that was dependent upon pH. For Cb5 prepared between pH 11.0 to pH 12.0, imidazole interaction with the protein
induced a loss of the intensity of the Soret band absorbance. In contrast, imidazole induced an increase of the Soret band absorbance above pH 12.0. Since above this pH we have measured by Cb5 intrinsic tryptophan fluorescence, a significant protein unfolding that leads to heme cavity
opening (open Cb5 conformation), our results point out that imidazole interaction with the
protein is modulated by pH in the range 11 to 13.5. Thus, these results strongly suggest that imidazole interacts with the heme cavity displacing the endogenous His ligand between pH
33
values 11 and 12.1 (closed Cb5 conformation), and directly with the heme cavity when the
endogenous ligand was miss-ligated, above pH 12.1 (open Cb5 conformation).
In addition, when the protein was in the closed conformation, imidazole induced an increase of another band at 430-440 nm simultaneous to the decrease of the Soret band (Figure 6). The band at 430-440 nm has been stated, in the bibliography, as the band for the bis-imidazole heme complex of free hemin. Analysis of the imidazole binding process (n value) allowed us to show that above pH 11.0, the interaction of one imidazole molecule induced some cooperativity (n more than 1) that could facilitate the release of the heme group from the cavity, as indicated by appearance of this band at 430-440 nm. Therefore, our data support that at pH values below 12.5, imidazole was destabilizing the protein inducing an enhanced solvent exposure of the heme group. CD and UV-visible experiments suggest that upon substrate ligation, the binding might facilitate the access to the catalytic site. Soret-CD spectra supported our results obtained with imidazole. Below pH 12.0, Cb5 heme is influenced by the peptide chain as shown by the chirality
signal still present in the absence of imidazole. Upon addition of imidazole at those pH values, the loss of the band at 420 nm and appearance of the band a 440 nm on the CD spectra was time dependent and correlative with Cb5 absorption data (disappearance of the absorption at 410 nm
and appearance of the band at 435 nm). To assess that the absorption band found at 430-440 nm was associated to heme group release, we measured the CD spectra of hemin, in the presence of imidazole at pH 12.0. The results obtained corroborate the heme loss, due to the observation of a similar positive band at 440 nm in the CD spectra when complexed with imidazole (Figure 6F). We demonstrated that the band at 430 nm in the visible spectra belongs to the free hemin bis-imidazole complex. The analysis of these data might also suggest that catalytic site gets
34
distorted as shown by NMR, far-UV CD and EPR spectra. These results agree with the regulatory role of the surface-exposed areas located far from the catalytic site, that regulate substrate-affinity, turnover and drives some enzymes adaptation to low temperature through allosteric tuning [57].
In the open conformation above pH 12.5, imidazole induced the appearance of a strong band at 410 nm in the visible spectra as expected for the protein in a pentacoordinated state, letting ligands like imidazole to interact with the heme group. Our Soret-CD spectra confirmed that imidazole added at these pH values induced a return of the chirality (previously lost by sample incubation in time).
To summarize, our results show a correlation between hemichrome formation and the low and high spin state transition of Cb5 (closed and open conformation) in alkaline media, as supported
in the competition assays with imidazole and unfolding measurements. The presence of exogenous ligands like imidazole would compete with the endogenous ligands (histidine residues) at alkaline pH (above pH 11). The use of imidazole to monitor an open and closed conformation in proteins has also been used for some CCP catalases and Cb5 mutants [58]. The
mechanism that we propose in terms of substrate accessibility to the Cb5 catalytic site (heme), at
these pH values, would not differ to that present in other similar hemoproteins like cytoglobin [59], where the protein is hexacoordinated and get pentacoordinated upon ligand binding and explain the strong peroxidase activity found in these conditions. Once the pentacoordinated state is present or induced by ligand binding, hydrogen peroxide is expected to generate highly reactive radical species or associated signals to compound I and II supported by our previous data [7].
35 ACKNOWLEDGMENT
This work was supported by the Associate Laboratory for Green Chemistry- LAQV which is financed by national funds from FCT/MCTES (UID/QUI/50006/2019). Experimental work was also supported by funding from Ayuda a Grupos de la Junta de Extremadura (Group BBB008) co-financed by the European Funds for Structural Development (FEDER). AKSA and LBM also thank FCT/MCTES for the post-doctoral fellowship grants (SFRH/BPD/100069/2014 and SFRH/BPD/111404/2015, respectively), which were financed by national funds and co-financed by FSE. AKSA, CMC, MSC and LBM also acknowledge FCT/MCTES for their "Investigador Doutorado" contracts' funding and signed with FCT/UNL in accordance with DL 57/2016 e Lei 57/2017. We also acknowledge “Biolab” REQUIMTE and the National NMR Network
(RNRMN) FCT/MCTES (RECI/BBB-BQB/0230/2012) for CD spectrometer and NMR
spectrometers assays, respectively. We would like to thank Rui Almeida and Ana Lopes for their assistance recording NMR spectra.
36 REFERENCES
1 K. F. Rechetzki, R. Henneberg, P. H. da Silva and A. J. do Nascimento (2012) Rev Bras Hematol Hemoter 34:14-16.
2 M. J. Percy, N. V. McFerran and T. R. Lappin (2005) Blood Rev 19:61-68.
3 J. M. Rifkind, E. Nagababu, S. Ramasamy and L. B. Ravi (2003) Redox Rep 8:234-237. 4 A. Merlino, B. D. Howes, G. Prisco, C. Verde, G. Smulevich, L. Mazzarella and A.
Vergara (2011) IUBMB Life 63:295-303.
5 J. Peisach and W. B. Mims (1977) Biochemistry 16:2795-2799. 6 Y. W. Lin and J. Wang (2013) J Inorg Biochem 129:162-171.
7 A. K. Samhan-Arias, L. B. Maia, C. M. Cordas, I. Moura, C. Gutierrez-Merino and J. J. G. Moura (2018) Biochim Biophys Acta Proteins Proteom 1866:373-378.
8 A. Vergara, M. Franzese, A. Merlino, G. Bonomi, C. Verde, D. Giordano, G. di Prisco, H. C. Lee, J. Peisach and L. Mazzarella (2009) Biophys J 97:866-874.
9 E. A. Rachmilewitz (1969) Ann N Y Acad Sci 165:171-184.
10 J. Peisach, W. E. Blumberg and A. Adler (1973) Ann N Y Acad Sci 206:310-327. 11 R. Bois-Poltoratsky and A. Ehrenberg (1967) Eur J Biochem 2:361-365.
12 M. Ikeda, T. Iizuka, H. Takao and P. Hacihara (1974) Biochimica et Biophysica Acta (BBA) - Protein Structure 336:15-24.
13 A. Vergara, M. Franzese, A. Merlino, L. Vitagliano, C. Verde, G. di Prisco, H. C. Lee, J. Peisach and L. Mazzarella (2007) Biophys J 93:2822-2829.
14 L. Vickery, T. Nozawa and K. Sauer (1976) Journal of the American Chemical Society 98:351-357.
37
15 L. Avila, H.-w. Huang, J. C. Rodríguez, P. Moënne-Loccoz and M. Rivera (2000) Journal of the American Chemical Society 122:7618-7619.
16 J. C. Rodríguez and M. Rivera (1998) Biochemistry 37:13082-13090.
17 D. G. Isom, C. A. Castaneda, B. R. Cannon and B. Garcia-Moreno (2011) Proc Natl Acad Sci U S A 108:5260-5265.
18 C. A. Fitch, G. Platzer, M. Okon, B. E. Garcia-Moreno and L. P. McIntosh (2015) Protein Sci 24:752-761.
19 G. R. Grimsley, J. M. Scholtz and C. N. Pace (2009) Protein Sci 18:247-251. 20 S. Pundak and R. S. Roche (1984) Biochemistry 23:1549-1555.
21 A. K. Samhan-Arias, R. M. Almeida, S. Ramos, C. M. Cordas, I. Moura, C. Gutierrez-Merino and J. J. G. Moura (2018) Biochim Biophys Acta Bioenerg 1859:78-87. 22 R. M. Keller and K. Wuthrich (1980) Biochim Biophys Acta 621:204-217.
23 G. N. La Mar, P. D. Burns, J. T. Jackson, K. M. Smith, K. C. Langry and P. Strittmatter (1981) J Biol Chem 256:6075-6079.
24 A. K. Samhan-Arias, M. A. Garcia-Bereguiain, F. J. Martin-Romero and C. Gutierrez-Merino (2006) J Fluoresc 16:393-401.
25 J. R. Lakowicz (2006) Principles of fluorescence spectroscopy. Springer, New York. 26 F. Nastri, L. Lista, P. Ringhieri, R. Vitale, M. Faiella, C. Andreozzi, P. Travascio, O.
Maglio, A. Lombardi and V. Pavone (2011) Chemistry 17:4444-4453.
27 E. Lloyd, J. C. Ferrer, W. D. Funk, M. R. Mauk and A. G. Mauk (1994) Biochemistry 33:11432-11437.
28 S. J. McLachlan, G. N. La Mar, P. D. Burns, K. M. Smith and K. C. Langry (1986) Biochim Biophys Acta 874:274-284.
38
29 S. J. McLachlan, G. N. La Mar, P. D. Burns, K. M. Smith and K. C. Langry (1986) Biochim Biophys Acta 874:274-284.
30 S. R. Slaughter, C. H. Williams, Jr. and D. E. Hultquist (1982) Biochim Biophys Acta 705:228-237.
31 F. L. V. Gray, M. J. Murai, J. Grembecka and T. Cierpicki (2012) Protein science : a publication of the Protein Society 21:1954-1960.
32 S. K. Tomar, S. H. Knauer, M. Nandymazumdar, P. Rosch and I. Artsimovitch (2013) Nucleic Acids Res 41:10077-10085.
33 U. Mayor, J. Günter Grossmann, N. W. Foster, S. M. V. Freund and A. R. Fersht (2003) Journal of Molecular Biology 333:977-991.
34 R. Kitahara, A. Okuno, M. Kato, Y. Taniguchi, S. Yokoyama and K. Akasaka (2006) Magnetic Resonance in Chemistry 44:S108-S113.
35 H. M. Peng and R. J. Auchus (2014) Arch Biochem Biophys 541:53-60.
36 I. Moura, S. R. Pauleta and J. J. Moura (2008) J Biol Inorg Chem 13:1185-1195.
37 S. J. Field, M. D. Roldan, S. J. Marritt, J. N. Butt, D. J. Richardson and N. J. Watmough (2011) Biochimica et Biophysica Acta (BBA) - Bioenergetics 1807:451-457.
38 C. M. Cordas, A. G. Duarte, J. J. Moura and I. Moura (2013) Biochim Biophys Acta 1827:233-238.
39 E. Katchalski and M. Sela (1953) Journal of the American Chemical Society 75:5284-5289.
40 M. Sela and E. Katchalski (1956) Journal of the American Chemical Society 78:3986-3989.
39
41 J. P. Schwans, F. Sunden, A. Gonzalez, Y. Tsai and D. Herschlag (2013) Biochemistry 52:7840-7855.
42 B. Mrazova, M. Martinkova, V. Martinek, E. Frei and M. Stiborova (2008) Interdiscip Toxicol 1:190-192.
43 C. Dumortier, J. M. Holt, T. E. Meyer and M. A. Cusanovich (1998) J Biol Chem 273:25647-25653.
44 M. Ikeda-Saito and T. Iizuka (1975) Biochim Biophys Acta 393:335-342. 45 A. Schejter and I. Aviram (1969) Biochemistry 8:149-153.
46 W. H. Wang, J. X. Lu, P. Yao, Y. Xie and Z. X. Huang (2003) Protein Eng 16:1047-1054.
47 D. Portsmouth and E. A. Beal (1971) Eur J Biochem 19:479-487.
48 H. J. Schugar, C. Walling, R. B. Jones and H. B. Gray (1967) Journal of the American Chemical Society 89:3712-3720.
49 T. Uno, A. Takeda and S. Shimabayashi (1995) Inorganic Chemistry 34:1599-1607. 50 C. D. Moore, O. N. al-Misky and J. T. Lecomte (1991) Biochemistry 30:8357-8365. 51 K. Abe and Y. Sugita (1979) Eur J Biochem 101:423-428.
52 J. M. Berg, J. L. Tymoczko, L. Stryer and L. B. Stryer (2007) Biochemistry. W. H. Freeman ; Basingstoke : Palgrave [distributor], New York.
53 D. S. Gill, D. J. Roush and R. C. Willson (1994) J Chromatogr A 684:55-63. 54 J. B. Wittenberg (1966) J Biol Chem 241:104-114.
55 W. J. Chuang and H. E. Van Wart (1992) J Biol Chem 267:13293-13301.
40
57 H. G. Saavedra, J. O. Wrabl, J. A. Anderson, J. Li and V. J. Hilser (2018) Nature 558:324-328.
58 J. E. Erman, D. Chinchilla, J. Studer and L. B. Vitello (2015) Biochim Biophys Acta 1854:869-881.
59 D. de Sanctis, S. Dewilde, A. Pesce, L. Moens, P. Ascenzi, T. Hankeln, T. Burmester and M. Bolognesi (2004) J Mol Biol 336:917-927.
41 SUPPLEMENTARY FIGURE LEGENDS
Supplementary Figure S1. 1H-NMR spectra of Cb5 (500 µM)at pH 12 in buffer diluted 4 times
using a 5 mm NMR tube. Spectra were acquired with the following set up using a Bruker Avance II 400. Standard 1H NMR experiments with 90◦ pulses, acquisition time 0.52 s., relaxation delay 0.5 s, 50,000 transients of a spectral width of 125000 Hz at 400.15 MHz working frequency) were collected into 130 K time domain points (panel a). An expansion of the vertical scale of the area in brackets (red) from 35 to 10 ppm is shown in panel b, allowing to identify the following resonances: a, b, c, d, e, * and *’ found at: 28.12, 21.89, 17.16, 14.81, 12.02, 20.5 and 19.79 ppm.
Supplementary Figure S2. δ meso-H and β meso-H signals of the major isomer of ferroCb5. 1H-NMR spectra of ferroCb5 acquired with a Bruker Avance operating at 600.13 MHz were
measured adding a few dithionite crystals to a Cb5 solution at 500 μM prepared in the following
buffer: potassium phosphate 100 mM, borate 50 mM, KCl 100 mM, EDTA 1 mM 10 % D2O and measured using a 5 mm NMR tube. Samples were adjusted to the selected pH using a microelectrode before each measurement.
Supplementary Figure S3. Plot of the current values vs scan rate for the CV measurements of Cb5. Cb5 representative voltammograms (continuous line) vs blank (dash line), obtained at a
scan rate of 5 mV/s, and pH values of 4 (panel A), 6 (panel B), 13 (panel C) are respectively shown. Cb5 voltammograms obtained at the previous indicated pH values after control
subtraction and current normalization are shown in panel D. Simulation of the curve fitting for the oxygen binding to Cb5 at pH 12 is shown in panel E. The curve was fitted to an hyperbolic
42
center), x is the concentration of O2 and P2 is equivalent to the equilibrium binding of the ligand
to Cb5.
Supp. Figure S4. The kinetics of Cb5 unfolding can be monitored with Trp fluorescence. Measurement of Cb5 unfolding was measured by recording the increase of the Cb5 tryptophan
fluorescence intensity incubated in buffers prepared in different conditions as indicated in the Material and Methods section. Different lines show the kinetics of Cb5 unfolding after addition
of the protein to buffers prepared at the following pH values: pH 4.0 (black dashed line), pH 4.4 (light grey dashed line) pH 7.0 (red continuous line), pH 12.1 (light grey continuous line), pH 12.6 (grey continuous line), pH 12.8 (dark grey continuous line), pH 13.2 (black continuous line) and guanidinium chloride (GDN) 6M (red dotted line).
Supplementary Figure S5. Difference spectra of Cb5 samples incubated at pH values: 11.5, 12, 12.5, 13 and 13.5, in the presence of the imidazole concentration indicated in each panel in respect to imidazole absence, are shown in panel A, B, C, D and E, respectively.
Supplementary Figure 6 Y37 location respect to the heme group is shown in this figure. Cb5
backboned is colored in brown, the heme group in red, coordinating histidines side chains are colored in yellow and Y37 side chain is colored in blue.
![Figure 3. Tryptophan and tyrosine fluorescence of Cb 5 . Tryptophan fluorescence was measured as previously shown [7] and indicated in the Material and Methods section (panel A) at: pH 4.0 (dotted black line), 7.0 (continuous red line) and 12.6 (continuo](https://thumb-eu.123doks.com/thumbv2/123dok_br/15238147.1022804/20.918.121.784.587.832/tryptophan-fluorescence-tryptophan-fluorescence-previously-indicated-material-continuous.webp)