39
CLIMATE, TECTONICS AND BEACH EROSION:
THE CASE OF ESPINHO (NW PORTUGUESE COAST)
M
ARIA DAA
SSUNÇÃOA
RAÚJO*
Abstract Sea level is a very changeable surface. Furthermore, the land mayalso be moving, in a slower rate, generating relative sea level changes. The causes of relative sea level changes are variable, but the ones that cause more intense variations are related to climate.
During Little Ice Age (LIA) Northern Hemisphere's summer temperatures fell significantly below the AD 1961–1990 range. This climate situation was responsible for a greater discharge of rivers, which could lead to a greater transportation of sediments to the coastline. During these cold periods, sea level was lower than in present time. All this could imply a coastline progradation, with the successive abandon of older beach ridges, reinforcing the sandy supply for dune building. The coastal situation should be, in some sense, the opposite of the situations that we face today.
In present warm period, rivers carry less sediment than during LIA. Moreover, the recent sea level rise contributes to a coastal migration inlands and the erosion of previous beaches and dunes.
Our investigation on ancient marine levels and Holocene cemented dunes suggests that the area near Esmoriz (20 km south of Porto, NW Portuguese coast) is probably subsiding. This possible subsidence, together with recent sea level rise, induced by the end of LIA, could explain the severe coastal erosion that is taking place at Espinho area (15 km south of Porto) since the middle of the XIX century. This example shows clearly the complexity of relative sea-level changes. Because of this complexity, sea level curves are not similar worldwide, as they depend on the interference of multiple time-scales phenomena.
Key-words: Little Ice Age, sea level changes, neotectonics, Espinho, coastal erosion.
1. INTRODUCTION. THE LITTLE ICE AGE
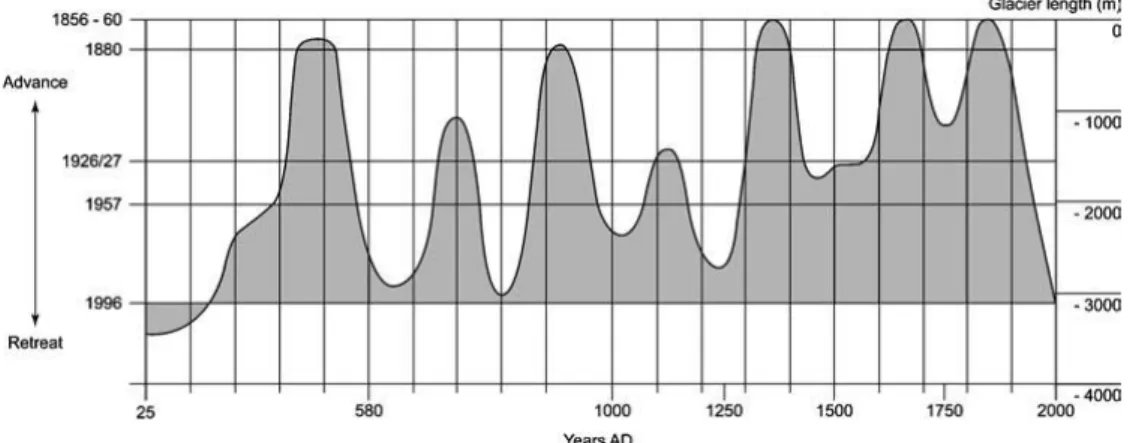
The climatic variations of the last millennia have usually been related to the advances and retreats of alpine glaciers (Fig. 1). In this graph we can see multiple glacial advances and retreats: it is not a simple and linear process with a precise and worldwide valid chronology.
In fact, talking about climate and climate change, we are talking of something very complex in the present and should be equally complex in the past and in the future. Keeping in mind the endless discussions on climate change, this is an important subject, as the past may be a key to our future.
The term “Little Ice Age” (LIA) is generally employed to describe the period of glacial advance of the last few centuries. However, sometimes, the term refers only to the period from 1550 to 1800 (LAMB 1977, in GROVE, 1988).
This climate episode was also characterized by a stronger snowfall in winter and both facts are responsible for a general advance of alpine glaciers (MATTHEWS& BRIFFA, 2005) (Fig. 1).
Figure 1 shows several glacial advances and also that the first cold events had approximately the
same importance as the 17th and 19th centuries
culminations.
According to Grove (2001), all around the North Atlantic, there are evidences of pre 16th century glacial advances but not so important as in Alps region.
Furthermore, temperature variation was rather complex with several highs and lows. However, it is possible to find a meaningful contrast between the average temperatures during Medieval Warm Period (MWP), LIA and modern warm period (GROVE, 2001).
In Brádzil (2005) we can find an excellent state of the art of this complex and interesting matter. It is also an exhaustive paper about the use of proxies, their limitations and the authors that made important contributions on last millennia climate change.
The first report from International Panel for Climate Change (IPCC) still shows medieval temperatures considerably higher than recent temperatures. This seems to be true for the NW Iberian Peninsula (MARTINEZ-CORTIZAS et al., 1999).
___________________________
40
Fig. 1 - Fluctuations in the length of the Grosser Aletsch glacier (the Alps, Switzerland) in the last 2000 years (BRÁDZIL et al., 2005).
Fig. 2 - (a) and (b) Annual sunspot and auroral observations in Korea and China in the 11–18th century (LEE
& LEE, 2007).
Even considering that the correlation between different proxies is sometimes hazardous and the fact that MWP and LIA evidences are not contemporaneous worldwide it seems that both LIA and MWP “have been climatic anomalies with worldwide imprints” (SOON & BALIUNAS, 2003).
However, the existence of those “worldwide imprints” doesn’t mean that during LIA there was a generalized cooling all over the Earth.
It seems that Doñana Park (southern Spain) had a drier climate during MWP and a wetter climate
during LIA (SOUSA & GARCÍA-MURILLO, 2003). Therefore, precipitation characteristics were more important than temperature issues in LIA climate definition at southern Iberia.
Because LIA had several fluctuations and different intensities in different places, its beginning is not easy to define. However, its end seems quite clear: after 1850, temperatures augmented and we arrive to the actual warm period, clearly contrasting with LIA episode.
41 2. POSSIBLE CAUSES OF CLIMATE CHANGE
DURING THE LAST MILLENNIA
Besides orbital parameters pointed out by Milankovitch since 1941, many scientists emphasize the influence of solar irradiance, at several timescales. According to Mörner (1993) most of climate and sea level changes “represent the redistribution of heat and water masses via the ocean current system”. However, “solar effects are not ruled out, especially during the periods of sunspot minima”.
In fact, the number of sunspots is quite variable during the period from AD 1000 till AD 1800, according to Lee & Lee (2007) and its Chinese and Korean database (Fig. 2). Several minima can be defined: Oort, Wolf, Spörer and Maunder. There are obvious similarities between sunspot number and aurora number during the same period.
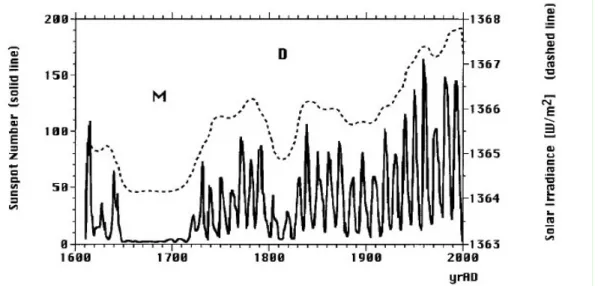
The Spörer Minimum ranges from 1440 to 1460. The Maunder Minimum is the name given to the period roughly from 1645 to 1715 AD, when sunspot became very rare, as noted by solar observers of the time. The Dalton Minimum was another period of low solar activity, lasting from about 1800 to 1830 (Fig. 3).
Fig. 3 - Sunspot number and solar irradiance during the last 400 years with lows of the Maunder Minimum (M) and Dalton Minimum (D) (CREER, 2001).
One of the most discussed issues about solar irradiance is the 11-year cycle (Schwabe cycle) (OLDFIELD, 2005). The solar irradiance variation is quite small (about 0,08 % within the 11 years sunspot cycle) (OLDFIELD, 2005). So, the principal question remains in the process why a small amount of radiation variation can induce important climatic consequences.
Svensmark and Friis-Christensen (1997) demonstrated a high degree of correlation between total cloud cover and cosmic ray flux between 1984 and 1991. The mechanism is quite complex but can be described in a simple way: when the Sun is more active (more sunspots), the magnetic field that is carried by the solar wind intensifies, creating more auroras (Fig. 2) and providing more shielding from low-energy galactic cosmic rays to the Earth. This effect may lead to a decrease in ion production in the lower atmosphere, resulting in the creation of fewer cloud condensation nuclei and less low-level cloud cover, which will allow more radiation to
arrive to the ground and will produce higher temperatures.
This phenomenon also influences 14C
production: the interaction of cosmic ray particles upon the atmospheric gases produces 14C. Solar
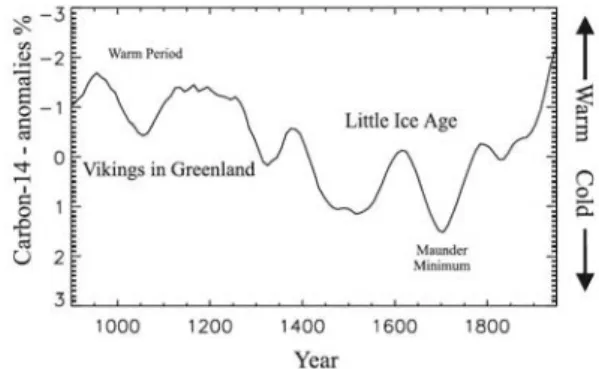
wind intercepts cosmic rays: thus, variability in 14C production is mainly a result of changes in solar activity. High solar activity leads to stronger shielding from the solar wind and thus a reduction in the 14C production rate. Confirming the correlation between these different processes, at figure 4, we can see that 14C anomalies have a
negative correlation with temperatures.
Solar forcing is no doubt a large field of possibilities to be explored: even the scientists who think that solar forcing is not a dominant cause of 20th century Northern Hemisphere warming and
insist on a anthropogenic causes agree that it could have produced a very significant forcing of pre-industrial climate (DAMON & PERISTYKH, 2005).
42 Because of its complexity and the obvious implications in economics and politics, climate change is a delicate field of work. It is still controversial science, even if the scientific mainstream and the public opinion seems “quite unanimous” about it.
The subject is so important for mankind that it must be deeply and thoroughly studied, exploiting all the clues and hypothesis and trying to overcome the misinformation and the catastrophic views that are impregnating much of the discussion on these themes.
Fig. 4 - Changes in 14C production over the past
1000 years relative to 1950. The negative 14C anomalies correspond to high solar activity periods. The positive anomalies correspond to low solar activity periods. The Medieval Warm Period with deterioration around 1050 and a complex Little Ice Age beginning around 1300 and ending around 1830 are clearly discernible (from: SVENSMARK, 2000).
3. CLIMATE CHARACTERISTICS AND
GEOMORPHOLOGIC CONSEQUENCES OF LIA During last millennia cooling phases, glaciers in many parts of Europe began to advance (Fig. 1). There was a high frequency of storms. As the cooler air began to move southward, the polar jet stream strengthened and also move southward, which directed a higher number of storms into Central Europe. This enhanced thermal gradient between latitudes 55° N and 65° N during the Little Ice Age, and can explain the occurrence of intense windstorms over the British Isles, that are responsible for sand dune invasion at several places (LAMB, 1979). In fact,dune formation in the North Sea region seems to have been particularly important during Little Ice Age (AAGAARD et al., 2007).
Grove (2001) refers the existence of great floods in places so far away as Setúbal, Bordeaux and Rome during the winter 1694-95. The augmentation of snow or rain during winter should increase river discharge and sediment transportation. Some of it
should be deposited inside intramountain basins or piedmont plains. Besides that, the rivers would carry more sediment until the coastline.
According to Grove (2001), the intensification of fluvial activity happened from 1250 to 1550 and from 1750 to 1900 in northern, western and central Europe.
After LIA, the transition to a less aggressive climate (EHRARDT, 1956) would imply the down cutting of previous deposited sediments transforming these old sediments into fluvial terraces. These sediments are generally designed as the “younger fill” (GROVE, 2001) and they are a typical occurrence of circum-alpine areas.
In fact, Grove (2001), comparing the historical evolution of population density and the erosion features, concludes that forest clearance is only a part of the reasons to explain the increased sedimentation during LIA and according to him, the “younger fill” could have mostly a climatic origin.
Deltas were also advancing: during 1604 Venetian authorities tried to alter the Po River valley, dragging its mouth to the south to prevent a further silting of Venice lagoon (GROVE, 2001).
Martins et al. (2006) showed the occurrence of muddy events from 2200-1200 years BP and after 500 Cal BP at Vigo’s Ria in the NW coast of Iberian Peninsula (about 30km from Portuguese border). They conclude that these muddy events are a sign of contrasting climatic conditions. The last period corresponds roughly to LIA and so, it seems that also in Northern Iberian Peninsula, LIA was characterized by increased erosion inland and more sediment transportation to the coastline.
Rodrigo et al. (1998) analysed climatic information in private correspondence of the Jesuit order in Castille (Spain) for 1634–1648. They showed prevalence of intense rainfall and cold waves in that period.
Doñana Park, near Cadiz, southern Spain, had a wetter climate during LIA (SOUSA & GARCÍA-MURILLO, 2003), contrasting with a quite dry climate, actually.
In Portugal, according to Alcoforado (1999), during Maunder minimum (1675-1715), the climate was not too different from today: there were a little more anticyclone conditions in winter and spring, producing a dryer climate. This seems to be true also for other areas of Mediterranean Europe. According to Grove (2001), during Maunder minimum (1675-1715), the winters were mostly cold and dry, with the exception of 1690 that was quite snowy.
The climate characteristics were not similar worldwide or even through Europe. Inside its southern area, the lowering in latitude of the jet stream could produce generally a heavier precipitation. However, the persistence of cold air
43 in massive continental areas like Iberian Peninsula, could build thermal anticyclones that would produce a blocking of the western circulation. This blocked situation increases the meridian circulation. The cold and warm waves in this meridian circulation characteristically occupies different positions from one year to the next. So, a given place would experience contrasting weather situations and even opposite extremes of temperature and rainfall in successive years (LAMB, 1979).
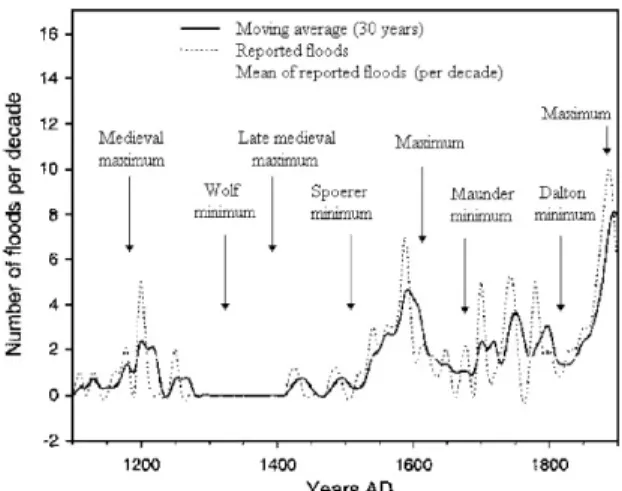
This meridian circulation should cause important regional contrasts and highly variable meteorological situations, with strong contrasts in relatively brief periods of time (Fig. 5).
Fig. 5 - Reported number of floods per decade and maxima and minimum epochs of solar activity (BENITO et al., 2003).
In fact, according to Thorndycraft & Benito (2006), the climate of the Iberian Peninsula, especially during the Late Maunder Minimum (AD 1675–1715), was characterised by extreme variability. During this climatic anomaly the Spanish Atlantic basins were characterised by decadal changes in flood frequency with minor periods of flood peaks alternating with relatively dry periods (Fig. 5). The complaints about the instability of the weather are not exclusive of present times: probably during the year 1533, Gil Vicente, a Portuguese writer of popular theatre plays, express the lamentations of common people saying:
- God is giving us heavy rains in January; - Frosts in April;
- Calms in February; - Heavy mists in May; - And hailstorms in July.
“De que te queixas vilão? De Deus, que é coisa provada que me tem grande tenção […]. Sem ganhar nisso ceitil, vai dar chuvas em Janeiro e
geadas em Abril e calmas em Fevereiro e névoas no mês de Maio e meado de Julho, pedra”.
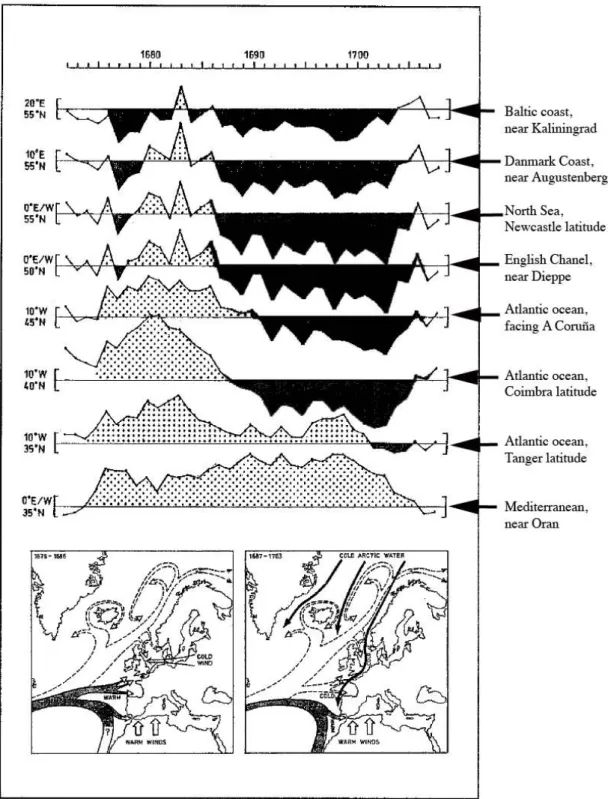
In Mörner (1995, Fig. 6) we find a very interesting graph that shows the temperature variation during Maunder minimum in several places along European western façade. One of the most striking graphs shows the temperature variation at the latitude of Coimbra (ca 40° N). In the beginning of this period, around 1680, the temperatures were higher than today’s media. Then, they began to drop because of a cold water invasion and a deflexion of Gulf current to the south, creating warm conditions that existed almost during all the Maunder minimum at 35° N, in the western coast of Africa.
This figure shows clearly the contrast in temperatures between Northern and Southern Europe, particularly in western Portuguese façade. It also materializes the idea of a redistribution of heat by ocean currents and some of the processes that may lead to the climate variations identified during theMaunder minimum.
The climate irregularity (Fig. 5) should be responsible for a larger amount of sediments transportation till the coastline. Goy et al. (1996) suggests that 500 years ago there was an extraordinary increase in coastal progradation in southern Iberia, which seems to confirm this hypothesis.
Due to strong winds, great sand storms acted upon coastal land regions, redistributing through the coastal areas the increased sediments brought to the littoral by the rivers. This increase in dune construction can be traced also in Portugal. In the northern coast, near Esposende, a medieval cemetery is covered by sand dunes. This shows an advance of coastal dunes after MWP (GRANJA, 1990).
4. CLIMATE VARIATION AND SEA LEVEL CHANGES
Van de Plassche et al. (1998) studied the sea level in the last 1400 years for Hammock River marsh (Clinton, Connecticut). He concludes that it “correlates positively with large-scale regional variations in sea-surface and summer-air temperature, indicating a link between sea-level and the climate-ocean system”. According to this research, “real sea level oscillated centimetres to decimetres on a century time scale over the past 1400 yr. It was “25±25 cm higher ca AD 1050 (Medieval Warm Period) than ca AD 1650 (Little Ice Age)”. After LIA the sea level began to slowly rise. This happened mostly because of thermal expansion of seawater and because of glaciers retreat after LIA.
44
Fig. 6 - (A) Above: Eight temperature records covering the period 1672-1708. Vertical scale gives 1 centigrade above and below the local mean value.
(B) Below: Main oceanic and atmospheric circulation effects on local climate during the late 17th century
"cold period".
Left (1676-1686): The Gulf Stream was strongly increased in its branches towards the Bay of Biscay and Gibraltar
where very warm conditions were prevailing. Hot African air-masses penetrated all the way up to the Mediterranean coast giving very warm temperatures in Algeria. In the years 1677-1679, cold winds from Russia reached out into the North Sea. Right (1687-1703): The Gulf Stream was strongly increased along its southern branch giving warm conditions in the Gibraltar region. Cold Arctic water penetrated all the way down to Portugal giving rise to very cold climatic conditions all along the coastal areas (a 5 °C sea surface cooling is recorded between Iceland and the Faeroe Islands). The warm African air continued to give very warm conditions in Algeria (adapted from Mörner, 1995).
45 Mörner’s curve (1973) (Fig. 7) shows precisely a rising sea level departing from a low stand around 1830, which coincides with Dalton sunspot minimum and one of the last cold advances of LIA. This curve, constructed “by mirroring” the tide gauges in Stockholm and Amsterdam against each other (and testing the result against the tide gauges in Warnemünde and Swinemünde),proves the close relationship between climatic cooling, glacier advance and eustatic lowering. It seems clear that LIA was a period of low sea level.
For the present period, we refer to Mörner’s own paper, in this journal.
Fig. 7 - Eustatic sea level changes from 1700 to 1970. According to Mörner, 1973 (PETHICK, 1985).
5. COASTAL EVOLUTION: A SYNTHESIS OF LIA VERSUS MODERN SITUATION
The following seems characteristic for LIA: • an increased sedimentation along river valleys, creating the so-called “younger fill” (GROVE, 2001) because of intense rain/snow and increased storminess;
• extended coastal dune building due to increased beach nourishment by increased sediment supply downstream and inside the estuaries in association with a lower sea level;
• the sea retreat, abandoning older beach ridges, and reinforcing the sandy supply for dune building as result of a sea level a little lower than present.
On the contrary, during MWP and the recent warm period the following seems to apply:
• the rivers carry less sediment than during LIA. Consequently, having less sediment charge, they will have the strength to cut older sedimentation areas, transforming them into river terraces, at least in the intermediate part of river channel;
• the sea level rise produces some infilling of estuaries because the rivers have not enough strength to carry their sediments into the sea. This also contributes to a coastal retreat because of lack in sediments available to littoral drift;
• the sea level rise produces an inland advance of the coastline and the erosion of previous beaches and dunes;
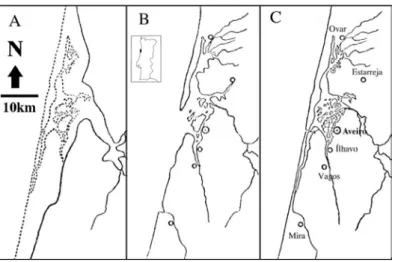
• the history of Aveiro lagoon shows a very fast advance of the sand spit (Fig. 8) that encloses the lagoon, mostly during LIA. At AD 922, Ovar was still a sea harbour (MARTINS, 1949).
Fig. 8 - The sand spit progression and Aveiro lagoon evolution (adapted from MARTINS, 1949).
46 At the end of XV century the sand spit was located at the latitude of Aveiro. At 1756 the sand spit stayed at Mira latitude and Aveiro port entrance was ca 28 km to the south of the city. Aveiro was dying because of a precarious connection to the sea and the lagoon, filled with non-renewed waters, had serious sanity problems (MARTINS, 1949).
The new port entrance was artificially opened in 1808. This means that from ca 1500 to 1756 (about 250 years) the sand spit moved about 28 km: a little more than 1 km each decade. It is important to underline that the fast southward migration of the spit occurred during LIA when, most probably, a greater amount of sediments was arriving to the coastline, as previously stated.
These sediments contributed to a rectification of the coastline that was presumably more irregular
during previous high sea level periods (MWP, for instance).
6. RELATIVE SEA-LEVEL CHANGES:
THE TIDE GAUGES DATABASE
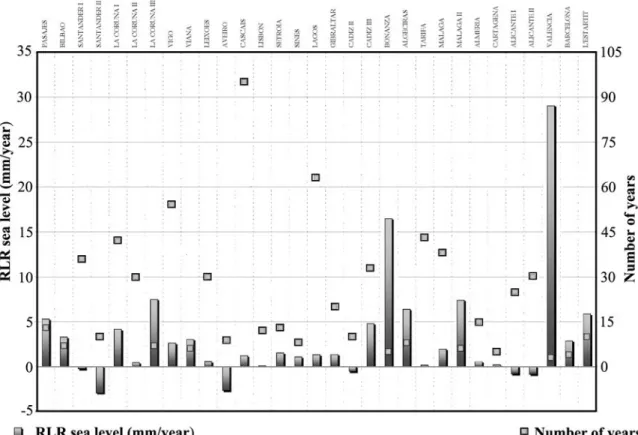
The permanent service for mean sea level (PSMSL) presents the data of ca 2000 sea level stations. The complete data set can be found at: http://www.pol.ac.uk/psmsl/psmsl_individual_statio ns.html4
These data allow us to plot the recent sea level variations for 31 places around the Iberian Peninsula (Fig. 9). See also Araújo (2002).
Fig. 9 - The trends of sea level variation at the Iberian Peninsula (data from Permanent Service for Mean Sea level: PSMSL).
The length of the series varies greatly. Only 20 stations have series of, at least, 10 years. We have also plotted the number of years used to calculate the trends
Figure 9 shows that the calculated trends at the western coast of Iberian Peninsula have a low variation. However, when we approach the
Northern and Southern coast, we have stronger variations and several cases of dropping sea level. We think that the better explication for this phenomenon is the tectonic background of these areas, which represent the newer orogenic belts (Pirinéus at the North, Béticas at the SE coast).
47 7. THE CASE OF ESPINHO: SEA LEVEL CHANGES,
POSSIBLE TECTONICS AND COASTAL EROSION
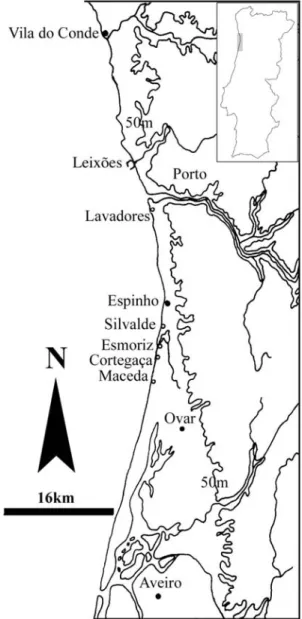
In the area between Vila do Conde and Espinho (Fig. 10) we have identified three marine levels that are staggered (ARAÚJO, 1991). As we are on a generally uplifted area (CABRAL, 1995) the oldest marine levels are the higher ones and the newer ones appear at lower altitude. Last interglacial fossil marine deposits and platforms (ca 125.000 years BP, Eemien) are the most conspicuous of those marine levels. Figure 11 shows the Eemien deposits height (determined with a differential GPS) against the point’s latitude (Datum 73 coordinate system).
Fig. 10 - Localization of studied area and other sites mentioned in the text.
There is a clear N–S tilting trend. There is also a strong intra-site variability which may be ascribed to (1) short-distance tectonic differentiation (this obviously the case at S. Paio), (2) possible multiple interglacial sea levels (5e, 5c, 5a), and (3) marine platform and beach morphology.
In this area, marine deposits are always quite thin and their preservation is related with an iron cementation that only occurs close to thebedrock.
We have measured with the GPS the extreme altitudes of several actual marine platforms. They develop between approximately +1,2 m (inner limit, close to the notch) and –1 m (exterior limit). Consequently, we admit that the altitude of the deposits related to the same marine platform may vary about 2,2 m as a maximum.
We may also have identification problems related to multiple interglacial sea levels that cannot be solved without absolute dating (which is very difficult to perform in iron cuirassed sediments).
We have searched for every possible Eemian outcrop and we found out that the higher ones were invariably related with a higher morphology of the coast (granite or gneissic cliffs). Generally these cliffs are built in the same rock of the adjacent low lying platforms. We think that the best way to explain it is to propose a tectonic uplift of areas like S. Paio and Lavadores, mostly when we also find, in the same places, Eemien marine deposits higher than usual.
The apparent trend visible on figure 11 don’t mean a regular subsidence: the height of marine terraces along the coastline is quite irregular and seems to define a puzzle of small blocks, which are likely to have undergone different tectonic movements.
The littoral area to the South of Espinho is a low area, covered with several dune systems (ARAÚJO, 2006). The retreat of the coastline has carved cliffs upon the dune systems, allowing us to see the fini-Pleistocene and Holocene deposits that lay beneath therecent sand dunes.
There seems to be a consistent variation on the altimetry of podzolic soil horizons installed upon the older fossil dunes. They are lower near Esmoriz lagoon and higher to the south. (ARAÚJO, 1991; GRANJA et al., 1999; ARAÚJO, 2002).
This is the opposite of the apparent dipping to the South we assumed for the Eemien deposits at the North of Espinho.
Therefore, it is possible that the depressed character of the area between Espinho and Esmoriz may have a tectonic origin (Fig. 13).
48
Fig. 11 - The height of Eemien marine deposits outcrops and its evolution along the studied coastline. There is a clear N–S tilting trend. There is also a strong intra-site variability which may be ascribed to (1) short-distance tectonic differentiation (this obviously the case at S. Paio and perhaps Lavadores), (2) multiple interglacial sea levels (5e, 5c, 5a), and (3) marine platform and beach morphology.
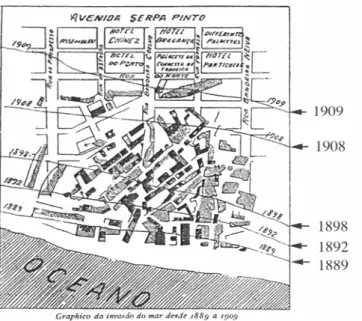
Fig. 12 - The sea invasion at Espinho from 1889 till 1909. The arrows indicate the successive coastlines (FERREIRA DINIZ, 1909, modified).
Fig. 13 - Possible opposedtectonic trends in the Eemien and the Holocene deposits, suggesting subsidence in the Espinho–Esmoriz region.
49 8. CONCLUSIONS: POSSIBLE CAUSES OF
COASTLINE EROSION AT ESPINHO
Espinho has suffered from severe erosion since, at least, 1869 (FERREIRA DINIZ, 1909). The occidental part of the city of Espinho was destroyed around 1909 (Fig. 12).
Ferreira Diniz (1909) concludes that the cause for the erosion at Espinho cannot be the building of Leixões harbour because the coastal retreat began before the time when the construction was ready.
We find the same conclusion at Carvalho (1999), where older “sea invasions” are referred to have occurred at 1834, 1869, 1871 and 1874.
The littoral drift, at this area, is mostly from the north to the south, because of the prevalence of NW sea waves.
As Leixões stays at the North of Douro mouth, its breakwaters will stop the sand coming from the small Northern rivers, (MOTA-OLIVEIRA, 1990) and not the sand transported by Douro, the most important river from this area. Therefore, Leixões breakwaters influence cannot be relevant at Espinho sedimentary budget.
That brings us back to the Mörner curve for sea level evolution. Apparently, the lowest point of sea level was reached at 1830. Then, the sea level began to rise, slowly but continuously, at least until 1940 (see Mörner´s paper, in this journal).
According to Brunn principle (PASKOFF, 1985) for each mm of sea level rising, the coastal variation in the horizontal direction will be 100 times bigger. Therefore, the rate assumed in the Mörner curve (around 1 mm/year) should produce a coastal retreat of 10 cm/year.
Even if it is a slow rate, the cumulative effects from 1830 to the present could generate a significant coastal erosion, surely responsible for some of the coastal retreat that happens at 70 % of the coastlines in the world (BIRD, 1993).
However, the sea level rise is only one of the causes of beach erosion. According to Dias (1990), sea level rise is responsible for only 10 % of the beach erosion problem.
Other reasons can be pointed out:
• the sedimentary deficit of the rivers, due to dam construction (the sand supply to the coast by the Douro river is actually only 20 % of its “natural” conditions (MOTA-OLIVEIRA, 1990);
• the impact of coastal constructions that interfere on coastal drift, causing accumulation on their northern side and erosion on southern side;
• now we must come back to the tectonic trends we inferred from the distribution of marine terraces and the heights of podzolic soils.
If those trends are confirmed, the area between Espinho and Esmoriz corresponds to a tectonic
depression (Fig. 13). This could explain why we have a small lagoon in Esmoriz.
This could also explain why the coastal erosion began before the construction of the breakwaters at Leixões: the effect of rising sea level after the end of LIA, acting upon soft Pleistocene and Holocene deposits, would be increased by a possible subsidence of Espinho-Esmoriz area (Fig. 13), creating a huge erosion problem in that city (Fig. 12).
It must be emphasized that coastal erosion does not depend only on relative sea level changes, but also on coastal dynamics and sedimentary budget.
Social alarmism and misinformation doesn’t help to solve coastal erosion problem.
On the contrary, a correct planning and management implies more knowledge on the complex processes acting on coastal areas, including its evolution in different timescales.
ACKNOWLEDGEMENTS
The author is sincerely grateful to Prof. Nils-Axel Mörner for the revision and scientific improvement of the text, for the inspiring ideas we got from his papers and lectures and for our fruitful discussions in the field.
REFERENCES
AAGAARD, T.; ORFORD, J. & MURRAY, A. (2007).
Environmental controls on coastal dune formation; Skallingen Spit, Denmark. Geomorphology, 83, pp. 29-47.
ALCOFORADO, M.J., (1999). Variações climáticas no passado:
chave para o entendimento do presente? Exemplo referente a Portugal (1675-1715), Territorium, 6, pp. 19-30.
ARAÚJO, M.A. (1991). Evolução geomorfológica da plataforma
litoral da região do Porto, PhD Thesis, FLUP, Porto.
ARAÚJO, M.A. (2002). Relative sea level, diastrophism and
coastal erosion: the case of Espinho (Portuguese NW coast), Littoral 2002 Proccedings, Eurocoast-Portugal, Vol. 2, pp. 125-132.
Also at:
http://www.io-warnemuende.de/homepages/schernewski/Littoral2000/do cs/vol2/Littoral2002_15.pdf
ARAÚJO, M.A. (2006). Algumas divagações sobre as dunas de
Ovar, Dunas – temas e perspectivas, revista anual sobre cultura e património da região de Ovar, 6, pp. 75-88.
BARLOW, K. (2001). The time period A.D. 1400-1980 in central
Greenland ice cores in relation to the North Atlantic sector, Climatic Change, 48, pp. 101-119.
BENITO G.; DÍEZ-HERRERO, A.& FERNÁNDEZ DE VILLALTA, M. (2003). Magnitude And Frequency Of Flooding In The Tagus Basin (Central Spain) Over The Last millennium, Climatic Change, 58, pp. 171-192.
BIRD, E.C.F. (1993). Submerging Coasts. The Efects of a Rising Sea Level on Coastal Environments, John Wiley & Sons, Chichester.
50 BRÁZDIL, R.; PFISTER, C.; WANNER, H.; STORCH, H. &
LUTERBACHER, J. (2005). Historical Climatology in
Europe – the state of the art, Climatic Change, 70, pp. 363-430.
CARVALHO, G.S. (1999). A responsabilidade das estruturas
portuárias na migração das praias para o interior (“Erosão Costeira”), 1as Jornadas de Engenharia Costeira,
International Association of Navigation, Porto, pp. 209-226.
CREER, K.M. (2001). Natural climate variability inferred from cosmogenic isotopes and other geophysical data and its impact on human activity, Journal of Radioanalytical and Nuclear Chemistry, 247, pp. 705-722.
DAMON, P. & PERISTYKH, A. (2005). Solar forcing of global temperature change since A.D. 1400, Climatic Change, 68, pp. 101-111.
DIAS, J.M.A. (1990). A Evolução Actual do Litoral Português, Geonovas, 11, pp. 15-28.
ERHART, H. (1956). La Génèse des sols en tant que phénomène
géologique, Col. Évolution des Sciences, nº 8, Paris, Masson et Cie.
FERREIRA DINIZ (1909). Praia de Espinho, A construção
moderna, IX (29), pp. 226-228.
GOY, J.L; ZAZO, C.; DABRIO, C.; LARIO, X.; BORJA, F.;SIERRO, F. & FLORES, J.A.(1996). Global and regional factors controlling changes of coastlines in Southern Iberia (Spain) during the Holocene, Quaternary Science Reviews, vol. 15, pp. 773-780.
GRANJA, H.M. (1990). Repensar a geodinâmica da zona
costeira: o passado e o presente. Que futuro? (o Minho e o Douro litoral). Universidade do Minho, PhD Thesis. GRANJA, H.M.; RIBEIRO, I.C.; CARVALHO, G. & MATIAS, M.S.
(1999). Some neotectonic indicators in quaternary formations of the Northwest coastal zone of Portugal, Phys. Chem. Earth (A), vol. 24, nº 4, Elsevier Science, pp. 323-336.
GROVE, A.T. (2001). The little ice Age and its Geomorphological consequences in Mediterranean Europe, Climatic Change, Kluwer Academic Publishers, 48, pp. 121-136.
GROVE, J.M. (1988). The Little Ice Age. London, Routledge. LAMB, Y. (1979). Climatic Variation and changes in the wind
and ocean circulation: the Little Ice Age in the Northeast Atlantic, Quaternary Research,11, pp. 1-20.
LEE A., & LEE. D.Y.(2007). Features of great minima in solar activity during the last 1000 years, Advances in Space Research, 40, pp. 942-950.
MARTINEZ-CORTIZAS, A.; PONTEVEDRA-POMBAL, X.; GARCIA
-RODEJA, E.; NOVOA-MUÑOZ, J.C. & SHOTYK, W. (1999). Mercury in a Spanish peat bog: Archive of climate change and atmospheric metal deposition, Science, 284, pp. 939-942.
MARTINS, A.F. (1949). Le centre litoral e le massif calcaire d'Estremadura, Livret Guide du Congrès de Géographie de Lisbonne. CEG, Lisboa.
MARTINS, V.; JOUANNEAU, J.-M.; WEBER, O. & ROCHA F. (2006). Tracing the late Holocene evolution of the NW
Iberian upwelling system, Marine Micropaleontology, 59, pp. 35-55.
MATTHEWS, J.& BRIFFA, K. (2005). The “Little Ice Age”: re-evaluation of an evolving concept, Geografiska Annaler, 87, pp. 17-36.
MILANKOVITCH, M. (1941). Canon of insolation in the ice age problem. Beograd, English translation published by National Science Foundation, Washington D. C., 1969. MÖRNER, N.-A. (1973). Eustatic changes during the last 300
years. Palaeogeography, Palaeoclimatology, Palaeoecology, 13, pp. 1-14.
MÖRNER, N.-A. (1993). Global Change: The Last Millennia,
Global and Planetary Changes, pp. 211-217.
MÖRNER, N.-A. (1995). Earth Rotation, Ocean Circulation and Paleoclimate, GeoJournal, 37, pp. 419-430.
OLDFIELD, F., (2005). Environmental change - key issues and alternative perspectives, Cambridge University Press. PASKOFF, R. (1985). Les littoraux - impact des aménagements
sur leur évolution, Col. Géographie, Paris, Masson.
PETHICK, J., (1984). An Introduction To Coastal
Geomorphology, London, Edward Arnold.
PLASSCHE, O. VAN DE; BORG, O. & JONG A. (1998). Sea level-climate correlation during the past 1400 years, Geology, 26, pp. 319-322.
RODRIGO, F.; ESTEBAN-PARRA, M. & CASTRO-DIEZ, Y. (1998). On the use of the Jesuit order private correspondence records in climate reconstructions: A case study from Castille (Spain) for 1634-1648 A.D., Climate Change, 40. SOON, W. & BALIUNAS, S. (2003). Proxy climatic and environmental changes of the past 1000 years, Climate Research, 23, pp. 89-110.
SOUSA, A. & GARCÍA-MURILLO, P. (2003). Changes in the wetlands of Andalusia (Doñana Natural Park, Sw Spain) at the end of the Little Ice Age, Climatic Change, 58, pp. 193-217.
SVENSMARK, H., (2000). Cosmic rays and Earth’s climate. Space
Science Reviews, 93, pp. 175-185.
SVENSMARK, H. & FRIIS-CHRISTENSEN, E. (1997). Variation of Cosmic Ray Flux and Global Cloud Coverage - a Missing Link in Solar-Climate Relationships, Journal of Atmospheric and Solar-Terrestrial Physics, 59 (11), pp. 1225-1232.
THORNDYCRAFT, V.R. & BENITO, G. (2006). Late Holocene
fluvial chronology of Spain: the role ofclimatic variability and human impact, Catena, 66, pp.34-41.
VICENTE, GIL (1533). Romagem de Agravos, Castelo
Branco-Chaves, Os livros de viagens em Portugal no Século XVIII e a sua projecção europeia, Lisboa, 1977, p. 36.
WEBSITES
IPCC (2001). Climate Change:Working Group I: The Scientific Basis: http://www.grida.no/climate/ipcc_tar/wg1/246.htm
PERMANENT SERVICE FOR SEA MEAN LEVEL (2008).