Proceedings IRG Annual Meeting (ISSN 2000-8953)
© 2019 The International Research Group on Wood Protection
IRG/WP 19-10956
THE INTERNATIONAL RESEARCH GROUP ON WOOD PROTECTION Section 1 Biology
Using X-ray micro-CT to evaluate density loss in anobiid infested
wood
João L Parracha1,2, Manuel F Pereira3, António Maurício3, Paulina Faria1,4, Lina Nunes1,5 1LNEC, National Laboratory for Civil Engineering, Structures Department,
Av. do Brasil, 101, 1700-066 Lisbon, Portugal
2FCT-NOVA, Faculty of Science and Technology, New University of Lisbon,
2829-516, Caparica, Portugal
3CERENA, Centro de Recursos Naturais e Ambiente, Instituto Superior Técnico,
University of Lisbon, 1049-001, Lisbon, Portugal
4CERIS, Civil Engineering Research and Innovation for Sustainability, Instituto Superior Técnico,
University of Lisbon, 1049-001, Lisbon, Portugal
5CE3C, Centre for Ecology, Evolution and Environmental Changes, Azorean Biodiversity Group,
University of Azores, 9700-042, Angra do Heroísmo, Azores, Portugal
Paper prepared for the IRG50 Scientific Conference on Wood Protection Quebec City, Quebec, Canada
12-16 May 2019 IRG SECRETARIAT Box 5604 SE-114 86 Stockholm Sweden www.irg-wp.co Disclaimer
The opinions expressed in this document are those of the author(s) and are not necessarily the opinions or policy of the IRG Organization.
2
Using X-ray micro-CT to evaluate density loss in anobiid infested wood
João L Parracha1,2, Manuel F Pereira3, António Maurício3, Paulina Faria1,4, Lina Nunes1,5
1 LNEC, National Laboratory for Civil Engineering, Structures Department,
Av. do Brasil, 101, 1700-066 Lisbon, Portugal, [email protected] ; [email protected]
2 FCT-NOVA, Faculty of Science and Technology, New University of Lisbon,
2829-516, Caparica, Portugal, [email protected]
3 CERENA, Centro de Recursos Naturais e Ambiente, Instituto Superior Técnico,
University of Lisbon, 1049-001 Lisbon, Portugal, [email protected] ; [email protected]
4CERIS, Civil Engineering Research and Innovation for Sustainability, Instituto Superior Técnico,
University of Lisbon, 1049-001 Lisbon, Portugal
5CE3C, Centre for Ecology, Evolution and Environmental Changes, Azorean Biodiversity Group,
University of Azores, 9700-042, Angra do Heroísmo, Azores, Portugal
ABSTRACT
Considering the relevance of wood borers in construction, the present study had as main objective the evaluation of the impact of anobiid damage on timber elements by establishing an empirical correlation between lost material percentage (LM%, consumed by beetles) and apparent density (original – OTD and residual – RTD). Since the beetles’ attack produces a diffuse damage with a set of tunnels in random directions and sizes, this makes quantification more difficult. In this context, micro-computed tomography (µ-XCT) is essential to enable better assessment of material degradation state as a function of lost material percentage/loss of density. The results showed a high correlation (r2 = 0.85) between RTD and LM% and a medium correlation (r2 = 0.60) between OTD and LM%. The various steps required during the µ-XCT study from the scanning procedure to the final quantitative results are also presented in this study enabling its use as guidelines for future studies.
Keywords: Anobiid infestation, three-dimensional reconstruction, loss of density, damage assessment
1. INTRODUCTION
Timber is known as one of the oldest construction materials and has been widely used in the construction industry over the centuries. However, due to its biological origin, it is susceptible to biodeterioration, which is frequently caused by agents like fungi and insects (Eaton and Hale, 1993). While fungal decay tends to be localised and linked to moisture sources, insect degradation often leads to a general deterioration of the timber structures (Gilfillan and Gilbert, 2001). In the particular case of beetles, the damage is mostly confined to sapwood, though with many exceptions (EN 350, 2016). The correct identification of the insects responsible for timber degradation is essential for the assessment of the structure but also for the selection of the right treatment, when relevant (Bravery et al., 1992).
3
To evaluate the impact of anobiids damage on timber structures, several studies have been already conducted (i.e. Cruz and Machado, 2013; Gilfillan and Gilbert, 2001; Nunes et al., 2019, however, the degradation intensity on the structure was always inferred from an examination of the surface appearance. This visual approach is not completely representative since the estimated internal holes volume grade (%) is much greater than the visually estimated voids’ surface grades (Gilfillan and Gilbert, 2001). Then, it is important to know the percentage of lost material (consumed by beetles) as well as the residual timber apparent density, in order to conclude on structural safety. Micro-computed tomography (μ-XCT) is a non-destructive structural evaluation leading technique that may be used to the visualization and quantification of a three-dimensional structure (3D). In this study, μ-XCT was used as a 3D microscope to assess the anobiids’ tunnelling process result (visualising its spatial distribution and morphology) and calculate void’s volume (lost material). The various steps required during the study, from the sample selection, preparation through scanning procedure to the final quantitative results are described.
2. MATERIALS AND METHODS 2.1 Sample preparation
One structural element of maritime pine (Pinus pinaster Ait.) beam, with varying degrees of infestation, was collected from a first half 20th century roof structure belonging to a residential building in Lisbon, Portugal. The degradation found was restricted to the sapwood and mainly due to insects identified as anobiids (Coleoptera, Anobiidae). After insect identification, the timber was divided in 4 parts (3 parts with degradation and the heartwood) and cut to produce 40 × 20 × 10 mm3 samples. Seventeen samples, representative of the varying degrees of degradation along the beam were submitted to μ-XCT. The heartwood was not used. The samples were assigned into 3 levels of degradation through a visual analysis of the deterioration. Level 1V corresponds to the lowest degradation level and level 3V to the highest. It should be noted that this visual grading approach had already been proved as not fully representative of the internal degradation (Gilfillan and Gilbert, 2001; Cruz and Machado, 2013). After determining the tomographic parameters of interest (wood and voids’ volume), the designation levels of the samples were readjusted according to results.
2.1 Scanning procedure
All pine timber samples were scanned with a compact desktop with micrometric range resolution, μ-XCT Skyscan 1172 microtomograph (Bruker Instruments, Inc., Billerica, Massachustets), using computer-controlled tomography acquisition, processing, reconstruction and analysis software packages (http://bruker-microct.com/products/1172.htm).
The next step, of the μ-XCT methodology preparing the scanning procedure is the best choice of the scanner settings. There are a lot of scan settings that affect substantially image quality, such as resolution, scanner voltage, scan time, number of images acquired, angle of rotation, etc. A summary of the parameters used in the scanning procedure are presented in Table 1. Besides these parameters, the distance between the X-ray source and the sample and between the X-ray source and the detector was 257 and 350 mm respectively, with a scanning time of 1.5 hours. A 0.5 mm aluminium filter is used for absorbing the low-energy X-rays, thereby reducing noise.
4
Table 1: Summary of the parameters used in the scanning procedure. Parameters
Maximum resolution 2 μm Voltage 60 kV
Filament current 165 μA Number of images 288
Angle of rotation 0.7° Filters Al 0.5 mm
Voxel Size 18.09 μm File type 16-bit
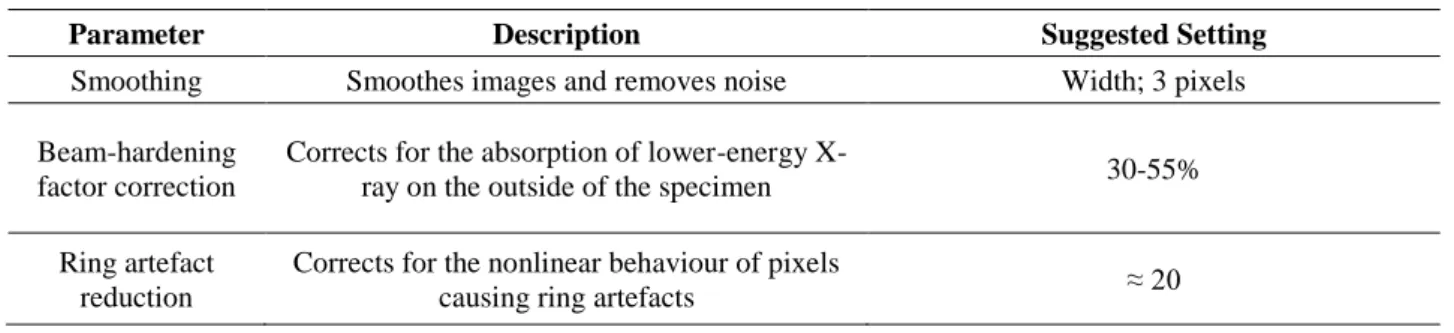
2.2. Reconstruction
Reconstruction process follows the scanning procedure and here 3D volume is reconstructed from the 2D digital radiography image stacks previously acquired. For the reconstruction process, the NRecon software, provided by Bruker, was used. Table 2 shows the reconstruction parameters used in this study. These parameters were applied for the reconstruction of all studied samples. The data was exported to 32-bit files.
Table 2: Reconstruction parameters adopted using NRecon software.
Parameter Description Suggested Setting
Smoothing Smoothes images and removes noise Width; 3 pixels
Beam-hardening factor correction
Corrects for the absorption of lower-energy
X-ray on the outside of the specimen 30-55%
Ring artefact reduction
Corrects for the nonlinear behaviour of pixels
causing ring artefacts ≈ 20
2.3. Analysis
After the reconstruction procedure, the images can be analysed and parametrized to obtain quantitative information (the values of the parameters of interest). This process is highly dependent on the software used. For this study, CTAn software, provided by Bruker, was used together with ImageJ software (https://imagej.nih.gov/ij/), provided by NIH, for image processing and calculation.
A more or less generalized image processing algorithm (Table 3) must be defined to segment three-dimensional images of complex materials in order to extract the different phases (in this study there are 2 phases: wood and voids).
Table 3: Image processing algorithm used to segment 3D images. Algorithm
Parameter Description Suggested setting
Thresholding Segments the foreground from background to
binary images Global; low level 17, high level 255
Despeckle Removes speckles from binary images Remove white speckles < 500 voxels Remove black speckles < 150 voxels
Morphological
5 3. RESULTS AND DISCUSSION
After the scanning procedure, all the 17 samples were conditioned for 2 weeks in a climatic chamber capable of keeping a temperature of 20 ± 2℃ and a relative humidity of 65 ± 5% to stabilize and reach a moisture content identical to that of reference (12%). After that, all the samples were weighed using a scale with a precision of 0.01g.
Original apparent density is calculated by Eq. 1. 𝜌𝑜𝑟𝑖𝑔𝑖𝑛𝑎𝑙 =
𝑚
𝑤𝑣 (1)
Residual apparent density is obtained by Eq. 2. 𝜌𝑟𝑒𝑠𝑖𝑑𝑢𝑎𝑙 = 𝑚
𝑡𝑣 (2)
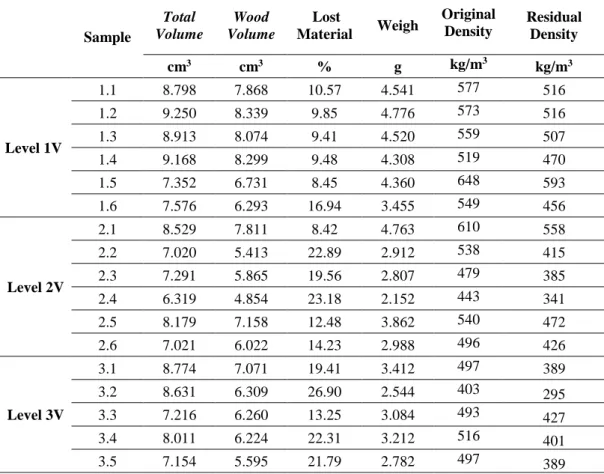
In Eq. 1 and 2, 𝑚 indicates the sample weigh, in kg and 𝑤𝑣 and 𝑡𝑣, in m3, represent the wood volume and the total volume, respectively. Table 4 shows the results obtained.
Table 4: Output parameters, samples weigh and apparent densities (original and residual).
Sample Total Volume Wood Volume Lost Material Weigh Original Density Residual Density cm3 cm3 % g kg/m3 kg/m3 Level 1V 1.1 8.798 7.868 10.57 4.541 577 516 1.2 9.250 8.339 9.85 4.776 573 516 1.3 8.913 8.074 9.41 4.520 559 507 1.4 9.168 8.299 9.48 4.308 519 470 1.5 7.352 6.731 8.45 4.360 648 593 1.6 7.576 6.293 16.94 3.455 549 456 Level 2V 2.1 8.529 7.811 8.42 4.763 610 558 2.2 7.020 5.413 22.89 2.912 538 415 2.3 7.291 5.865 19.56 2.807 479 385 2.4 6.319 4.854 23.18 2.152 443 341 2.5 8.179 7.158 12.48 3.862 540 472 2.6 7.021 6.022 14.23 2.988 496 426 Level 3V 3.1 8.774 7.071 19.41 3.412 497 389 3.2 8.631 6.309 26.90 2.544 403 295 3.3 7.216 6.260 13.25 3.084 493 427 3.4 8.011 6.224 22.31 3.212 516 401 3.5 7.154 5.595 21.79 2.782 497 389
Through an analysis and interpretation of Table 4, it can be considered that one of the samples with the highest percentage of lost material (sample 2.2 – 22.89 LM%) belongs to the second “level of degradation”, which would be where the existing degradation, as well as the percentage of lost material was supposed to be lower. This sample should have been placed at the highest level of degradation (level 3V). This confirms what was expected: visual assessment of timber beam samples was not accurate, and a redistribution of the samples per each level needs to be done (in
6
Figure 1, all samples that were redistributed to a different level are marked in red). It should be noted that samples with the highest redistribution by levels are at levels 2V and 3V (5 out of 7 samples redistributed), which proves that a visual grading approach is more efficient for low levels of degradation. This time, the samples will be reordered per level according to the “real” lost material percentages (calculated through μ-XCT study). This fact also confirms that there is not a clear linear correlation between the area of emergence holes at exposed surfaces and the wood specimen’s strength, so that the structural soundness of anobiids colonized timber cannot be acceptably assessed through examination of the exposed surfaces (Gilfillan and Gilbert, 2001; Cruz and Machado, 2013).
A reorganisation of the samples per level of degradation was proposed: • Level 1 – < 10% of lost material;
• Level 2 – 10 to 20% of lost material; • Level 3 – > 20% of lost material.
Brozovsky et al. (2008) proposed the definition of 3 levels of degradation, but once again based on a cross-section reduction proposed on the basis of an examination of the exposed surfaces. After level reorganization, the results obtained for apparent densities (original and residual) decrease with increasing percentage of lost material, as expected. The lowest value of residual apparent density occurred for level 3, with 386±28 kg/m3. For levels 1 and 2, the average value of residual apparent density was 530±48 kg/m3 and 439±47 kg/m3 respectively. Considering all samples, an average original theoretical density of 529±53 kg/m3, an average residual apparent density of 449±70 kg/m3 and an average loss of apparent density of 80±24 kg/m3 (15.4±5.5 %) was obtained. A medium correlation (r2 = 0.60) was obtained between original apparent density and lost material percentage and a high correlation (r2 = 0.83) was obtained between residual apparent density and lost material percentage. These correlations are very suggestive enabling consider that timber apparent density is a likely determinant of timber quality but also confirms that µ-XCT methodology was well applied in this research study.
4. CONCLUSION
The results obtained showed a medium correlation between LM% and OTD. A higher correlation was obtained when comparing LM% and RTD. Further developments on this issue using these results to assess the impact of anobiid damage of pine timber structures, by establishing a valid correlation between the loss of density and the loss of mechanical properties were meanwhile obtained (Parracha el. al, 2019). Suggestions and guidelines that can be used during a µ-XCT study were provided. The applicability of µ-XCT to define the relevant parameters for anobiid damage was confirmed.
5. ACKNOWLEDGEMENTS
The authors wish to acknowledge to Portuguese Foundation for Science and Technology for the financial contribution of projects: PTDC/ECM-EST/1072/2014: ProTimber (Probabilistic assessment of existing timber structures), PTDC/EPH-PAT/4684/2014: DB-HERITAGE (Database of building materials with historical and heritage interest) and Pest-OE/CTE/UI4028/2011 (CERENA).
7 6. REFERENCES
Baird, E, Taylor, G (2017) X-ray micro-computed tomography. Current Biology Magazine, 27, 283-293.
Bravery, A F, Berry, R W, Carey, J K, Cooper, D E (1992): Recognising wood rot and insects
damage in buildings. Building Research Establishment, Garston.
Brozovsky, J, Brozovsky, J J, Zach, J (2008) An assessment of the condition of timber structures. In: 9th International Conference on NDT of Art, Jerusalem, Israel.
Cruz, H and Machado, J S (2013) Effects of beetle attack on the bending and compression strength properties of pine wood. Advanced Materials Research, 778, 145-151.
Cruz, H, Yeomans, D, Tsakanika, E, Macchioni, N, Jorissen, A, Touza, M, Mannucci, M, Lourenço, P (2015) Guidelines for on-site assessment of historic timber structures. International
Journal of Architectural Heritage, 9(3), 277-289.
Eaton, R A, Hale, M D C (1993): Wood: Decay, Pests and Protection. Chapmman & Hall, London. EN 350:2016. Durability of wood and wood-based products – Testing and classification of the durability to biological agents of wood and wood-based materials. European Committee for Standardization, Brussels.
Farinha, A O, Branco, M, Pereira, M F C, Auger-Rozenberg, M, Maurício, A, Yart, A, Guerreiro, V, Sousa, E M R, Roques, A (2018) Micro X-ray computed tomography suggests cooperative feeding among adult invasive bugs Leptoglosus occidentalis on mature seeds of stone pine Pinus
pinea. Agricultural and Forest Entomology, 20, 18-27.
Gilfillan, J R, Gilbert, S G (2001) Development of a technique to measure the residual strength of woodworm infested timber. Construction and Building Materials, 15, 381-388.
Nunes, L, Parracha, J L, Faria, P, Palma, P, Maurício, A, Pereira, M F C (2019) Towards an assessment tool of anobiid damage of pine timber structures. In: IABSE Symposium – Towards a
Resilient Built Environment – Risk and Asset Management, Guimarães, Portugal, 1734-1741.
Parracha JL, Pereira, MJ, Maurício, A, Machado, JM, Faria, P, Nunes, L (2019) A semi-destructive assessment method to estimate the residual strength of maritime pine structural elements degraded by anobiids. Materials and Structures 52(3). 11pp.