arXiv:1202.0232v1 [nucl-ex] 1 Feb 2012
(will be inserted by the editor)
Determination of the Σ(1385)
0/Λ(1405) ratio in p+p
collisions at 3.5 GeV
E. Epple and L. Fabbietti for the HADES collaboration
Received: date / Accepted: date
G. Agakishiev6, A. Balanda3, D. Belver17, A.V. Belyaev6, A. Blanco2, M. B¨ohmer9, J. L. Boyard15, P. Cabanelas17, E. Castro17, J.C. Chen8, S. Chernenko6, T. Christ9, M. Destefanis10, F. Dohrmann5, A. Dybczak3, E. Epple8, L. Fabbietti8,9, O.V. Fateev6, P. Finocchiaro1, P. Fonte2,b, J. Friese9, I. Fr¨ohlich7, T. Galatyuk7,c, J. A. Garz´on17, R. Gernh¨auser9, C. Gilardi10,
M. Golubeva12, D. Gonz´alez-D´ıazd, F. Guber12, M. Gumberidze15, T. Heinz4, T. Hennino15, R. Holzmann4, I. Iori11,f †, A. Ivashkin12, M. Jurkovic9, B. K¨ampfer5,e, K. Kanaki5, T. Karavicheva12, I. Koenig4, W. Koenig4, B. W. Kolb4, R. Kotte5, A. Kr´asa16, F. Krizek16, R. Kr¨ucken9,
H. Kuc3,14, W. K¨uhn10, A. Kugler16, A. Kurepin12, R. Lalik8, S. Lang4, J. S. Lange10, K. Lapidus8, T. Liu15, L. Lopes2, M. Lorenz7, L. Maier9, A. Mangiarotti2, J. Markert7, V. Metag10, B. Michalska3, J. Michel7, E. Morini`ere15, J. Mousa13, C. M¨untz7, L. Naumann5, J. Otwinowski3,
Y. C. Pachmayer7, M. Palka4, Y. Parpottas14,13, V. Pechenov4, O. Pechenova7, J. Pietraszko7, W. Przygoda3, B. Ramstein15, A. Reshetin12,
A. Rustamov7, A. Sadovsky12, P. Salabura3, A. Schmah8,a, E. Schwab4, J. Siebenson8, Yu.G. Sobolev16, S. Spatarog, B. Spruck10, H. Str¨obele7, J. Stroth7,4, C. Sturm4, A. Tarantola7, K. Teilab7, P. Tlusty16, M. Traxler4,
R. Trebacz3, H. Tsertos13, V. Wagner16, M. Weber9, C. Wendisch5, J. W¨ustenfeld5, S. Yurevich4, Y.V. Zanevsky6
(HADES collaboration)
1Istituto Nazionale di Fisica Nucleare - Laboratori Nazionali del Sud, 95125 Catania, Italy
2LIP-Laborat´orio de Instrumenta¸c˜ao e F´ısica Experimental de Part´ıculas , 3004-516 Coimbra, Portugal
Laura Fabbietti
Excellence Cluster Universe Tel.: +49-89-35831 7136
3Smoluchowski Institute of Physics, Jagiellonian University of Cracow, 30-059 Krak´ow, Poland
4GSI Helmholtzzentrum f¨ur Schwerionenforschung GmbH, 64291 Darmstadt, Germany
5Institut f¨ur Strahlenphysik, Forschungszentrum Dresden-Rossendorf, 01314 Dresden, Germany
6Joint Institute of Nuclear Research, 141980 Dubna, Russia 7Institut f¨ur Kernphysik, Goethe-Universit¨at, 60438 Frankfurt, Germany 8Excellence Cluster ’Origin and Structure of the Universe’ , 85748 Garching,
Germany
9Physik Department E12, Technische Universit¨at M¨unchen, 85748 Garching, Germany
10II.Physikalisches Institut, Justus Liebig Universit¨at Giessen, 35392 Giessen, Germany
11Institute for Nuclear Research, Russian Academy of Science, 117312 Moscow, Russia
12Department of Physics, University of Cyprus, 1678 Nicosia, Cyprus 13Frederick University, 1036 Nicosia, Cyprus
14Institut de Physique Nucl´eaire (UMR 8608), CNRS/IN2P3 - Universit´e Paris Sud, F-91406 Orsay Cedex, France
16Nuclear Physics Institute, Academy of Sciences of Czech Republic, 25068 Rez, Czech Republic
17Departamento de F´ısica de Part´ıculas, Univ. de Santiago de Compostela, 15706 Santiago de Compostela, Spain
a also at Lawrence Berkeley National Laboratory, Berkeley, USA b also at ISEC Coimbra, Coimbra, Portugal
c also at ExtreMe Matter Institute EMMI, 64291 Darmstadt, Germany d also at Technische Univesit¨at Darmstadt, Darmstadt, Germany e also at Technische Universit¨at Dresden, 01062 Dresden, Germany f also at Dipartimento di Fisica, Universit`a di Milano, 20133 Milano, Italy g also at Dipartimento di Fisica Generale and INFN, Universit`a di Torino,
10125 Torino, Italy
Abstract The aim of the present analysis is to determine the relative pro-duction cross sections of the Λ(1405) and Σ(1385)0 resonances in p+p colli-sions at Ekin=3.5 GeV measured with HADES. Upper and lower limits have been determined for the ratio σ(Σ(1385)0+p+K+)/σ(Λ(1405)+p+K+)= 0.76+0.54−0.26.
The knowledge of this ratio is an essential input for the analysis of the de-cay Λ(1405) → Σ±π∓, where an unambiguous separation of the Λ(1405) and Σ(1385)0 signals is not possible.
Keywords strangeness · resonances · kaon-nucleon interaction
1 Introduction
Among the baryon resonances listed in the Particle Data Group tables [1] the Λ(1405) exhibits exceptional characteristics. Indeed, effective field theories
[2] describe it as a superposition of a Σπ resonance and a ¯KN bound state contributing to the resonance formation. It is assumed, moreover, that these pole contributions are populated with different strengths depending on the entrance reaction. Thus, it is rather important to access the spectral shape of the Λ(1405) in different entrance channels.
The data discussed here have been collected with the High Acceptance Di-Electron Spectrometer (HADES) [3] at GSI. In the measured p+p reaction (Ekin=3.5 GeV, fixed target) the Λ(1405) and the Σ(1385)0 resonances are produced together with a proton and a K+ meson. The two charged decay channels of the Λ(1405) resonance, Σ±π∓, have been also analyzed for this data set and the results are reported in [4]. There, a separation of Λ(1405) and Σ(1385)0 signals is not possible. Hence, an external reference is needed to determine their relative yields. This reference is delivered by the analysis of the Λ(1405) decay channel Σ0π0. Indeed, the two resonances can be partially disentangled in this decay channel, since the decay of the Σ(1385)0into Σ0π0 is forbidden, and limits for the ratio σ(Σ(1385)0+p+K+)/σ(Λ(1405)+p+K+)can be
estimated.
2 Analysis Procedure
The analysis presented here aims to reconstruct the reaction:
p + p → p + K++ Y , where Y = Λ(1405) and Y =Σ(1385)0 are of inter-est. When detecting the proton and the K+ meson the spectral shape of the resonances can be reconstructed by the missing mass M M(pK+). To further
select the data sample and at least partially disentangle these two resonances, their charged decay products have to be detected as well. The analyzed de-cays are Λ(1405) → Σ0π0→(Λγ)π0 and Σ(1385)0 →Λπ0. The second step in the analysis consists in selecting a Λ hyperon in the final state. The de-cay Λ → pπ− (BR=63.9 %) is considered, where the Λ candidates have been selected by applying the following cuts: (1) distance between the proton and pion track (dp−π− < 18mm), (2) the distance of closest approach of the Λ to
the primary vertex (DCAΛ < 23mm), (3) the constraint (DCAp < DCAπ−)
and (4) a cut on the pπ− invariant mass (1106 < M
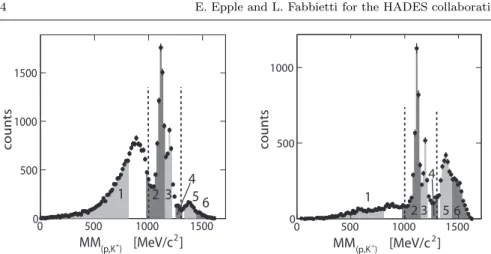
(p,π−) < 1122 M eV /c 2). The obtained missing mass spectrum of a proton and a K+ meson shown in Fig. 1 consists of two different sets of data. The left panel of Fig. 1 shows the ’HADES data set’, where all charged particles were detected within HADES [3]. The right panel of Fig. 1 shows the ’WALL data set’, where the proton from the Λ decay is detected in the Forward Wall1 and the other three particles in HADES. These two data sets can be analyzed independently and provide com-plementary information as they cover different regions of the phase space (a resolution of σ = 4 MeV/c2and 2 MeV/c2for the reconstructed Λ mass is ob-tained for the ’WALL’ and ’HADES data set’, respectively [5]). Both data sets show a similar resolution in the missing mass M M(p,K+)(σ = 24 (18) MeV/c2
1 An external hodoscope placed 7 m downstream of the target with a time resolution of 500 − 700 ns.
] 2 [MeV/c ) + (p,K MM 0 500 1000 1500 counts 0 500 1000 1500 1 2 3 4 5 6 ] 2 [MeV/c ) + (p,K MM 0 500 1000 1500 counts 0 500 1000 4 3 2 1 5 6
Fig. 1 The missing mass M M(p,K+)for the ’HADES data set’ (left) and the ’WALL data set’ (right). The numbered areas show the six bins in the missing mass M M(p,K+,p,π−) distribution that have been simultaneously fitted. The black dashed lines separates the three intervals in which the validation of the misidentification background has been cross-checked independently.
and σ = 21 (15) MeV/c2 at the Λ and Σ0 pole positions, respectively). The possible reactions with a final state p+K++X contributing to the missing mass M M(p,K+) distribution are listed in table 1. Besides several reactions
involving strangeness production, the total measured yield also contains some misidentification background by p and π+ identified as K+ (cf. [6], section IV). It is however possible to model this background precisely by a side-band analysis of the reconstructed K+ mass spectra. An exhaustive description of this data driven side-band method is available in [6]. To determine the exact yield of the misidentification background in the analyzed spectra the side-band data sample has to be compared to the measured sample. In this analysis we choose to compare the spectra by means of the p − π− invariant mass, as il-lustrated in Fig. 1 of [5], where the p − π− invariant mass is displayed under the condition M M(p,K+) > 0 MeV/c2. The side-band data sample was
ad-ditionally compared to two further p − π− invariant mass spectra, applying the following conditions: M M(p,K+) > 1000 MeV/c2 and M M(p,K+) > 1300
MeV/c2. These three intervals are defined between the vertical dashed lines, shown in Fig. 1. In this way, the yield of the side-band background could be cross-checked in one observable, independently for different data sub-samples selected by means of M M(pK+). The precision of the side-band method is
lim-ited by the fact that the p- and π+-misidentification samples are obtained by a side-band selection on the reconstructed kaon mass in two intervals rather distant from the nominal K+mass. Even by doing so, some real kaons might be in the two background samples. This contribution is responsible for the fact that the side-band background underneath the M(p,π−) signal is not flat
but shows a small Λ(1116) signal [5]. The strength of physical signal in the band statistic can be evaluated by filtering simulations through the
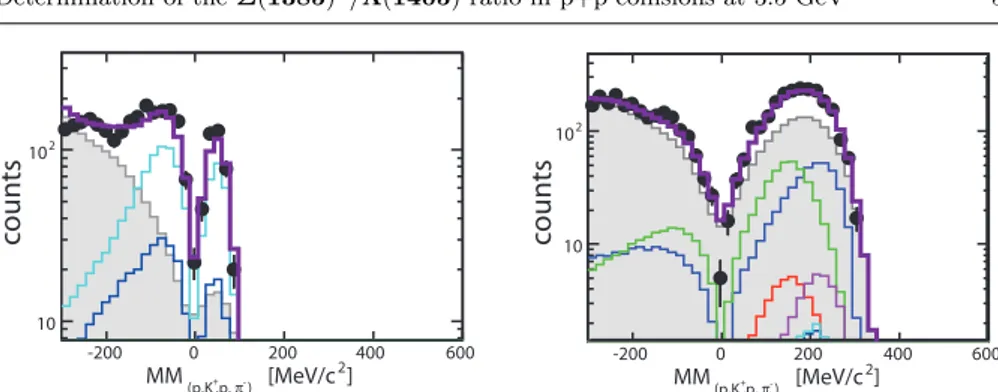
side-] 2 [MeV/c ) -π ,p, + (p,K MM -200 0 200 400 600 10 2 10 ] 2 [MeV/c ) -π ,p, + (p,K MM -200 0 200 400 600 10 2 10 c oun ts c oun ts
Fig. 2 An example of a fit result in two of the 14 fitted bins of the missing mass M M(p,π−,p,K+)for the ’WALL data set’. On the left the third interval displayed in Fig. 1 and on the right the fifth interval is displayed. The experimental points are shown in black, the sum of all fitted contributions is given in purple. The gray area displays the misidentifi-cation background. The colored curves correspond to the different simulated channels listed in table 1.
Table 1 Shown is a typical outcome of the fit. The relative scaling factors of the simulated channels p+p→X have been normalized to the ΛK+p yield.
Number Color-code Final state X Relative scaling factors
1) violet Λ(1405)K+p 0.266 2) light green Σ(1385)0K+p 0.14 3) dark green Λ(1520)K+p 0.257 4) dark blue ΛK+p 1 5) red ΛK+pπ0 0.031 6) cyan Σ0K+p 0.348 7) pink Σ0K+pπ0 0.023 8) beige Σ+K+pπ− 0.008
band analysis. In this way, one can determine the fraction of signal in the side-band that fulfills all selection criteria. In a later step of the analysis this simulated signal is subtracted from the misidentification background. The re-actions given in table 1 were each simulated with the same statistics of events. The final states Λ/Σ0K+pπ−π+ and Σ+K+pπ−π0 have not been included since studies based on simulations showed that their contribution to the mea-sured yield is not significant. Each channel has been simulated to determine the corresponding shape in the M M(pK+)distribution. Their relative yield has
been extracted by fitting the scaled sum of all channels to the experimental distribution. Six intervals have been defined in the missing mass M M(p,K+)
for the two data samples separately, as shown in Fig. 1 by the gray areas. For each of the 12 intervals an experimental distribution in M M(p,π−,p,K+)is
obtained and later fitted with a function composed of the sum of all the simu-lated contributions listed in table 1 each multiplied by a fit parameter and the misidentification background, of which the yield is quantitatively determined by the side-band method. During the fitting procedure the yield of Λ(1520) has been by trend underestimated. Therefore the simulations could not describe the M M(p,K+) spectrum in the mass region around 1520 MeV/c2. An
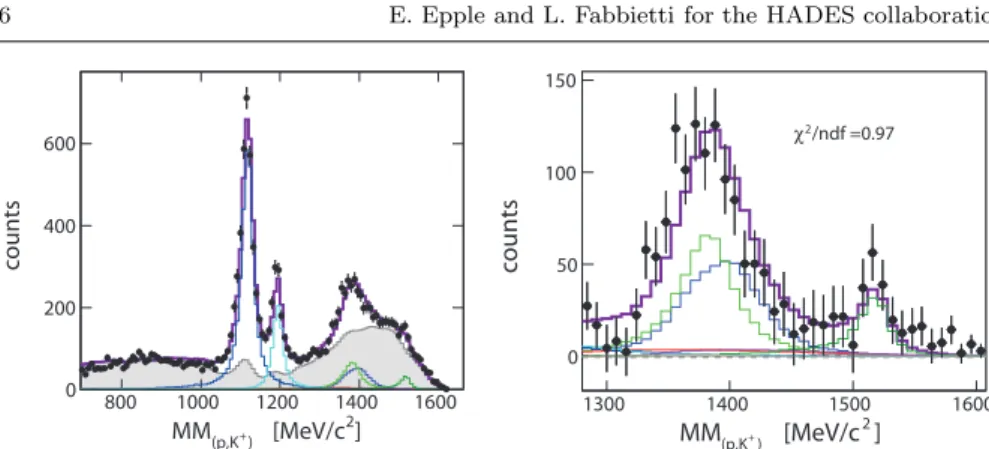
addi-] 2 [MeV/c ) + (p,K MM 800 1000 1200 1400 1600 counts 0 200 400 600 ] 2 [MeV/c ) + (p,K MM 1300 1400 1500 1600 counts 0 50 100 150 /ndf =0.97 2 χ
Fig. 3 Fitted distributions shown together with the experimental distribution of M M(p,K+) (left) and for the resonance mass area (right), after subtracting the misidentification back-ground. The experimental points are black, the sum of all fitted contributions is shown in purple. The gray area is the misidentification background. The colored curves correspond to the different simulated channels listed in table 1.
tional distribution corresponding to the interval of 1450 < M M(p,K+)< 1620
MeV/c2for both data sets has been included in the fit to solve this problem. In total 14 experimental distributions were fitted simultaneously.
In Fig. 2 the experimental distributions of two out of the 14 bins are shown together with a result of the fit. The following constraints have been applied during the fit : σ(ΛK+pπ0) and σ(Σ0K+pπ0) < σ(ΛK+p). A further constraint
has been obtained from the analysis described in [4]. Here, the contribution from the final state Σ+K+pπ−appears as a rather flat distribution under the Λ(1405) resonance signal in the M M(pK+) spectrum. The ratio of the
reso-nance signal to the flat contribution has been determined. It results in the constraint σ(Σ+K+pπ−)< 0.3 · (σ(Λ(1405)K+p)+σ(Σ(1385)0K+p)). In order to
de-scribe both data sets simultaneously with the same simulations it has been necessary to include a non-isotropic angular distribution for the simulation of the channel ΛK+p. The reason for this is that the Λ(1116) is produced with an angular anisotropy in p+p collisions, as discussed in [7]. The simulations were filtered with the Λ angular distribution in the p-p CM system extracted at a beam kinetic energy of 2.4 GeV [7]. The experimental data could have been described much better with this modified simulation. Recent data from the same experiment [6] have shown, that also the Σ(1385)+resonance is pro-duced with an angular anisotropy. Thus in a second step the simulations for the final state Σ(1385)0K+p were weighted with the angular distribution of the Σ(1385)+in the pp CM frame reported in [6] to study the impact on the fit pa-rameters. A final result is shown in Fig. 3, where the M M(p,K+)experimental
distribution is shown together with the contributions of the misidentification background and the simulated channels for the whole range (left panel) and for the range, where the Λ(1405) appears after subtraction of the misidenti-fication background (right panel). The obtained χ2 per degree of freedom of the simultaneous fit to the HADES and WALL data sets amounts to 2.1. This
corresponds to the scaling factors for the different channels listed in table 1. Systematic studies were carried out by varying the track cuts and the invariant mass interval for the Λ(1116) (1), (2) and (4) by ±10 and ± 20 % and varying the yield of the misidentification background by 4 to 6 %. Furthermore, the stability of the fit has been tested by assuming either a flat angular distri-bution for the Σ(1385)0production or the anisotropic one extracted from the Σ(1385)+production. Within these variations we have obtained a distribution of the σΣ(1385)0K+p/σΛ(1405)K+p ratio of 0.76+0.54−0.26 (syst.), where the
system-atic error is the σ value of the distribution obtained by the cut variations. These values can be compared with the result obtained by the ANKE collab-oration at Ekin=2.8 GeV [8], where 0.89 ± 0.46 (stat.)±0.5 (syst.) has been determined as ratio. The extracted value for the ratio of Σ(1385)0/Λ(1405) = 1.1 has been employed in the analysis described in [4].
Acknowledgements The author gratefully acknowledges support from the TUM Grad-uate School. The following funding are acknowledged: LIP Coimbra, Coimbra (Portugal): PTDC/FIS/113339/2009, SIP JUC Cracow, Cracow (Poland): NN202286038, NN202198639, HZ Dresden-Rossendorf, Dresden (Germany): BMBF 06DR9059D, TU Muenchen, Garch-ing (Germany) MLL Muenchen DFG EClust: 153 VH-NG-330, BMBF 06MT9156 TP5 TP6, GSI TMKrue 1012, GSI TMFABI 1012, NPI AS CR, Rez (Czech Republic): MSMT LC07050, GAASCR IAA100480803, USC - S. de Compostela, Santiago de Compostela (Spain): CPAN:CSD2007-00042, Goethe Univ. Frankfurt (Germany): HA216/EMMI, HIC for FAIR (LOEWE), BMBF06FY9100I, GSI F&E01, CNRS/IN2P3 (France).
References
1. K. Nakamura et al. (PDG), J. Phys. G 37, 075021 (2010) 2. T. Hyodo and D. Jido, Prog. Part. Nucl. Phys. 67, 55-98 (2012) 3. G. Agakishiev et al. (HADES Coll.), Eur. Phys. J. A 4, 243-277 (2009) 4. J. Siebenson, AIP Conf. Proc. 1322, 389-393 (2010)
5. E. Epple (HADES Coll.), Int. J. Mod. Phys. A 26, 616-618 (2011)
6. G. Agakishiev (HADES Coll.), Baryonic resonances close to the ¯KN threshold: the case of Σ(1385)+ in pp collisions, submitted to PRC, arXiv:1109.6806
7. M. Abdel-Bary (COSY-TOF Coll.), Eur. Phys. J. A 46, 27-44 (2010) 8. I. Zychor et al. Phys. Lett. B 660, 167-171 (2008)