29
Radiol Bras. 2012 Jan/Fev;45(1):29–34
Display quality control based on luminance measurements
in post-processing units at imaging diagnosis centers
*
Controle de qualidade de monitores de diagnóstico por imagem e iluminância nos espaços de pós-processamento em serviços de imagiologia
Márcia Pinto1, Maria Pedro1, António Santos2, António Saraiva3
Objective: To evaluate the quality of primary and secondary displays of conventional radiography systems based on luminance measurements. The level of ambient lighting within the rooms was also measured. Materials and Methods:
Luminance measurements were performed with an Unfors Xi Light Detector in 23 primary and 22 secondary displays (six of them utilized in emergency departments) at five different institutions, and according to the method described on the American Association of Physicists in Medicine (AAPM) TG18 report. The level of ambient lighting was measured with Delta Ohm HD 9221 lux meter. Results: In general, both the primary and secondary the displays were compliant with the AAPM guidelines. As regards ambient lighting, the primary workstation rooms were slightly above the recommended levels. As far as The Royal College of Radiologists (RCR) recommendations are concerned, the number of compliant displays corresponded to a minority, with no significant difference, though. Conclusion: Although most of the displays could not meet the strict RCR guidelines, in general, the results were satisfactory. The level of agreement between primary and secondary displays should be as high as possible in order to guarantee the image quality. Considering the key role played by diagnostic imaging systems, medical imaging displays must be regularly evaluated to assure that the quality of the imaging system is maintained.
Keywords: Quality control; Luminance; Illuminance.
Objetivo: Avaliar a qualidade dos monitores de diagnóstico e tratamento de imagem digital em radiologia convencio-nal (raios X) com base nos níveis de luminância. Fez-se a medição da iluminância dos postos de trabalho onde esta-vam os monitores. Materiais e Métodos: A medição da luminância foi realizada usando-se um detector Unfors Xi Light em cinco instituições, com 23 monitores primários e 22 secundários, sendo 6 usados em urgência, seguindo o método descrito no relatório TG18 da American Association of Physicists in Medicine (AAPM). O instrumento de me-dida utilizado foi o Delta Ohm HD 9221 luximeter. Resultados: Para as recomendações da AAPM, tanto monitores primários como secundários cumpriram, no geral, os níveis de tolerância. No caso dos níveis de iluminância, nos lo-cais de trabalho dos monitores primários encontravam-se ligeiramente acima do intervalo recomendado. Quanto às recomendações do The Royal College of Radiologists (RCR), os monitores que respeitaram os níveis recomendados estavam em minoria, embora as diferenças não fossem significativas. Conclusão: Em geral, os resultados foram sa-tisfatórios, embora os monitores não fossem adequados para atingir as recomendações exigentes do RCR. Os níveis de referência entre os monitores primários e secundários deveriam aproximar-se, de modo a garantir a qualidade de imagem. Os monitores para visualização e diagnóstico de imagens médicas devem ser regularmente avaliados para manter um sistema com a qualidade exigida, dada a função que desempenham.
Unitermos: Controle da qualidade; Luminância; Iluminância.
Abstract
Resumo
* Study developed at College of Health Technology of Coimbra, Portugal.
1. Licenciate, Radiologist Technicians, College of Health Tech-nology of Coimbra, Portugal.
2. PhD, Full Professor at College of Health Technology of Coimbra, Portugal.
3. Master, Full Professor of Radiology at College of Health Technology of Coimbra, Portugal.
Mailing Address: Dr. António Saraiva. Departamento de Radiologia – Escola Superior de Tecnologia da Saúde de Coimbra (ESTeSC). Rua 5 Outubro, Apartado 7006. 3046-854 Coimbra, Portugal. E-mail: [email protected]
Received July 8, 2011. Accepted after revision January 11, 2012.
Pinto M, Pedro M, Santos A, Saraiva A. Display quality control based on luminance measurements in post-processing units at imaging diagnosis centers. Radiol Bras. 2012 Jan/Fev;45(1):29–34.
tomography and later, with ultrasonogra-phy, digital radiology and magnetic reso-nance imaging. The picture archiving and communication systems (PACS) became a reality only when computers and networks became able to perform file exchange and storage in real time. Following such devel-opment, the displays devices themselves needed to be adapted for visualization of medical images. The early color cathode ray tubes (CRTs) presented defects related INTRODUCTION
The arrival of the technological age, most precisely the digital radiology, has brought about changes in the components of imaging services, from the examination room to treatment and diagnosis.
to luminance, contrast resolution and geo-metric distortion, leading to the develop-ment of high-quality monochrome CRTs with special phosphor coatings which pro-duced high luminance levels(1). With such
changes the displays were able to match image quality and resolution with those obtained with conventional radiology films. In the mid 1990’s, liquid crystal dis-plays (LCDs) were introduced, and also were also adapted for the medical imaging market, with high luminance and resolu-tion(1). Over time, LCDs became preferable
to CRTs, as they lasted longer, had higher luminance, lower weight and generated less heat, among other factors. In order to match the convenience of negatoscopes for the visualization of multiple images, work-stations equipped with sets of two and four displays have been utilized(1).
In spite of the high investment in equip-ment observed at digital radiology services, quality control is undervalued by such ser-vices. The present study was aimed at as-sessing display devices for diagnosis and visualization/treatment by means of the measurement of parameters such as lumi-nance and illumilumi-nance, comparing such measurement results with values recom-mended by internationally recognized as-sociations.
Such parameters, among others, are ex-tremely relevant, since their inadequacy may negatively affect the diagnostic image quality.
The Report 03 of the American Associa-tion of Physicists in Medicine (AAPM) is a comprehensive document about visual-ization systems and their quality control. It describes the different types of display devices utilized in the visualization of medical images and also outlines the dif-ferent standard tests for their evaluation(2).
Certain technical requirements, such as being calibrated according to the DICOM grayscale standard display function (GSDF) and present minimum values for certain photometric parameters, must be met by the displays device in order to al-low the visualization of radiological im-ages with consistency and quality(3).
Radiological images present varied gray levels not always perceptible by the human eye. On account of this fact, there is a DICOM GSDF standard to assure that a
professional is able to observe that a pixel value of 200 presents twice the brightness of a pixel value of 100. For that reason, the displays are calibrated so that the difference between each level and the next is of at least 1 JND (just noticeable difference). The luminance of such gray scales is deter-mined by the LUT (look up table), that is found either on the computer or on the dis-play device itself(4). However, while
DICOM GSDF contributes to a correct perception of the image, it does not play a significant role in other relevant aspects of the image quality on the display screen, such as the illuminance, luminance and luminance ratio(4).
Luminance is the visible amount of light emitted or reflected per second per area unit, per unit of solid angle on a surface(2).
In the present case, it is the brightness or light projected by the display screen, mea-sured in candles per square meter (cd/m2) or nit. Illuminance, or ambient lighting, is the luminous flux perpendicularly incident on a surface per area unit (m2) expressed in lumens per square meter (lm/m2) or lux.
According to the AAPM Report 03, there are two types of medical displays devices. The primary displays are those utilized in the interpretation of medical images, for example, by physicians special-ized in radiology. Secondary displays are those utilized for the visualization of medi-cal images, for example by radiology tech-nicians or other health professionals. The secondary displays in the present study sample are typically connected to worksta-tions that serve the purposes of treatment support and/or image printing. As the per-formance of treatment displays have a di-rect impact on the images presented on other displays, such a performance must meet a minimum acceptable level. Ideally, such minimum levels should be equal to the luminance levels of the primary displays(5).
Normally, the maximum luminance value (Lmax) recommended by the manufac-turer is equivalent to the highest possible value which does not interfere with other performance parameters, such as resolution or display life span. In cases where the manufacturers’ recommendation for such parameters is not available, internationally established recommendations should be followed(6).
The AAPM and The Royal College of Radiologists (RCR) have developed guide-lines establishing Lmax values, luminance ratio, illuminance and dimensions for pri-mary and/or secondary displays.
On the AAPM Report 03, the reference values for primary displays are the follow-ing: from 2 to 10 lux for illuminance; Lmax ≥ 170 cd/m2 and luminance ratio ≥ 250 cd/m2. As regards secondary displays, the values are the following: 50 to 180 lux for illuminance; Lmax≥ 100 cd/m
2 and
lumi-nance ratio ≥ 100 cd/m2.
The reference levels recommended by RCR guidelines for the primary displays are the following: 15 lux for illuminance, Lmax≥ 500 cd/m
2, luminance ratio ≥ 500:1
cd/m2 and display dimension ≥ 20 inches. In the literature, it is also indicated that, in the case of workstations with multiple displays, the maximum Lmax difference among them cannot be > 10%(6).
MATERIALS AND METHODS
The investigation was carried out on 23 primary displays and 22 secondary display devices in five public health institutions in the central Portugal region, following the recommendations described on the AAPM Report 03(5). The present study was focused
on the evaluation of primary and second-ary displays of conventional radiography systems.
The data were collected by means of a Unfors Xi luminance detector, calibrated according to the National Institute of Stan-dards and Technology (NIST), with a cali-bration error < 2%. Such detector is com-prised by an optical tube and a light block-ing rblock-ing that attaches over the light sensor zone, allowing direct contact of such light blocking ring with the screen surface, thus avoiding the need for dark room conditions during measurements. With such equip-ment, it is possible to measure luminance values ranging between 0.05 and 50,000 cd/m2, with a resolution of 0.01 cd/m2.
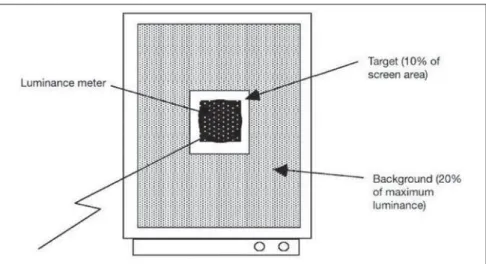
The 12-bit version of TG18-LN test in the DICOM format (Figure 1) is constituted by a set of 18 images with different lumi-nance levels. Each image consists of a cen-tral testing region with a determined pixel value, occupying 10% of the total area, with the remaining area on the image com-prising a uniform background with a lumi-nance level equal to 20% of the maximum luminance value(5). By following the
pro-tocol described on the Report 03, one mea-surement was performed for each one of the 18 images (Figure2), with the pixel value at the central region of each image ranging from 0 to 4.080(5).
In the case of secondary displays, as they were fitted with manual adjustment of screen brightness, at least two measure-ments per 18-image set were performed, corresponding to maximum brightness, minimum brightness or found brightness (since in some cases the found brightness was equal to the maximum brightness or to the minimum brightness). In the case of the primary displays, only six of them were equipped with manual brightness control, while the others had internal self-adjusting brightness controls.
A Delta Ohm HD 9221 lux meter was utilized for illuminance measurements. Such a measurement device, calibrated ac-cording to the NIST, has an automatic scale change feature, allowing the measurement of values between 0 and 200,000 lux, with a resolution of 0.1 for measurements below 200 lux and 1 for measurements above 200 lux. Its stability is 0.15% and standard de-viation is 0 ± 0,06%/°C.
A recording framework was created to allow storage of the following data:
• date of the measurement;
• institution to which the display be-longs;
• display device serial number; • model and make;
• date of manufacture; • measured illuminance level;
• display device classification according to the AAPM Report 03;
• found brightness in the case of second-ary displays.
The recording of luminance measure-ments results was made by means of the Unfors Xi View detector, with direct data transfer through USB port.
The data collection was performed by means of a consistent and systematic method comprising some pre-defined
steps, as follows: assurance of a minimum 30-minute warm-up for testing each display device; cleaning of the display screen sur-face; checking of the brightness window and recording of the brightness results in those devices where this is possible; assem-bling and stabilization of the measurement device by means of a tripod in the area defined for testing; measurements per-formed with the display devices in the standby mode.
From the first to the last measurement, the detector could not be moved, with all measurements being performed in the same location with all the changes in the display devices settings being reversed to found adjustments at the beginning of the mea-surements.
On average, each measurement took 20 to 30 minutes to be completed. Most of the Figure 2. Luminance measurement scheme with the TG18-LN test pattern. Source: American Associa-tion of Physicists in Medicine(7)
.
Figure 1. Examples of images according to the TG18-LN pattern. TG18-LN12-01 pattern (A), TG18-LN12-08 pattern (B) and TG18-LN12-18 pattern (C). Source: American Association of Physicists in Medicine(7).
measurements were performed out of the services’ working hours.
The following parameters were consid-ered in the present investigation:
• Luminance ratio: the levels of maxi-mum, minimum and ambient lighting cor-responded, respectively to 100% white, 100% black and to the ambient light re-flected by the display in the standby mode. Such levels were measured by utilizing the luminance meter. The display luminance ratio was then calculated by means of the equation:
L’max + Lamb / L’min + Lamb
considering the ambient light, in this case, non significant(5).
• Maximum luminance: measurement corresponding to the image 18 of the TG18-LN test (100% white)(5).
• Illuminance: Measurement performed by means of a lux meter, horizontally po-sitioned, at a 15 cm distance from the dis-play in the standby mode.
Applied statistical inference methods
A specialized statistical software, the SPSS version 16, was utilized for data pro-cessing, the SPSS release 16, resorting to the qui-squared (χ2) adherence test, to the Student’s t-test for one sample, and to the Spearman’s Rho (ρs) correlation test, to the R Pearson’s correlation test, to the qui-squared (χ2) test for independence test and to the Student’s t test for independent samples.
For relationship analysis, the following reference values were utilized: p value > 0.05, no relationship; p value ≤ 0.05, sta-tistically significant relationship.
As regards correlation, the reference values were the following: R < 0.2: very poor and non-statistically significant cor-relation; R [0.2–0.39]: poor corcor-relation; R [0.4–0.69]: moderate correlation; R [0.7– 0.89]: strong correlation; R [0.9–1]: very high correlation. Such values were the same for negative correlations(8).
RESULTS
Among the 23 primary displays at the studied hospitals, six were equipped with manual brightness control. The remaining 17 were equipped with a sensor for
self-adjusting luminance level, and for that rea-son, a single measurement was performed for each one of those display devices.
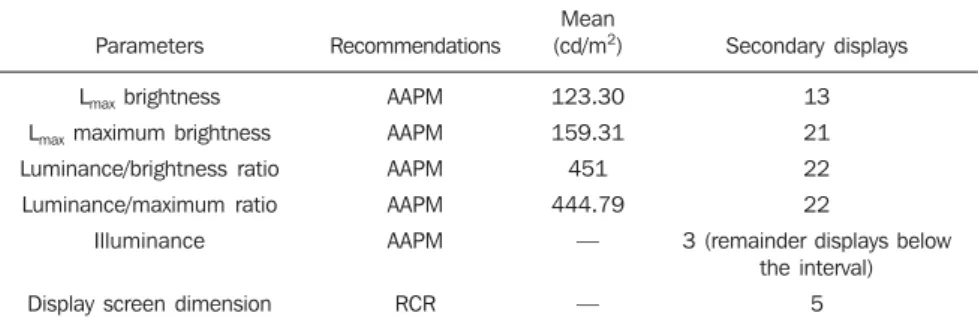
On the secondary displays, as the value for Lmax (Table 1) was compared with the values established by the AAPM Report 03 recommendations, the variation was not significant (α > 0.05), with a mean differ-ence of 23.30 cd/m2, as compared with the standard value of 100 cd/m2, with a stan-dard deviation of 58.48 cd/m2. Measure-ments with values < 100 cd/m2 were ob-tained in nine displays.
On the secondary displays, the Lmax val-ues with maximum brightness were signifi-cantly above (α = 0.001) the reference value of 100 cd/m2, with a standard deviation of 41.94 cd/m2 (Table 1). The mean difference value was 59.31 cd/m2. Only one display did not reach the reference value.
The brightness Lmax values observed on the primary displays presented a significant variation, above the minimum value of 170 cd/m2, with the mean difference value cor-responding to 208.33 cd/m2 (Table 2). Four of the 22 displays were not compliant with the minimum value. As regards the refer-ence value of 500 cd/m2, the values were significantly lower (α = 0.001), and in this case, with a mean difference of 121.66 cd/ m2, with 19 displays not complying with such minimum reference value. The global mean value of brightness Lmax found on the 23 displays was 378.33cd/m2, with a stan-dard deviation of 142.96 cd/m2 (Table 2). For the primary displays equipped with manual brightness control, and Lmax, with maximum brightness as compared with the minimum reference value of 170 cd/m2, the global mean luminance for the six displays
Table 1 Summary of results obtained with secondary displays, indicating the number of displays which complied with the respective reference level or recommended interval, in a total of 22.
Parameters
Lmax brightness
Lmax maximum brightness
Luminance/brightness ratio Luminance/maximum ratio
Illuminance
Display screen dimension
Recommendations
AAPM AAPM AAPM AAPM AAPM
RCR
Mean (cd/m2)
123.30 159.31 451 444.79
—
—
Secondary displays
13 21 22 22
3 (remainder displays below the interval)
5
AAPM, American Association of Physicists in Medicine; RCR, The Royal College of Radiologists.
Table 2 Summary of results obtained with primary displays, indicating the number of displays which complied with the respective reference level or recommended interval, in a total of 23.
Parameters
Lmax brightness
Lmax maximum brightness
Luminance/brightness ratio
Luminance/maximum brightness ratio
Illuminance
Display screen dimension
Luminance variation
Recommendations
AAPM RCR
AAPM RCR
AAPM RCR
AAPM RCR
AAPM RCR
RCR
AAPM
Mean (cd/m2)
378.33
166.68
533.97
455.74
—
—
Primary displays
Self-adjusting
17 4
— —
17 9
— —
Manually adjusted
0 0
2 0
6 0
6 0
2 9
16
Seven workstations
was lower, with non-statistically significant difference (α > 0.05). Four of such displays did not reach the reference value. The mean difference was 3.31 cd/m2 lower than the reference value. In the case of reference value of 500 cd/m2, the found values were significantly lower (α = 0.001), with a mean difference of 333.31 cd/m2. None of the 6 displays complied with the 500 cd/m2 reference value. The global mean value was 166.68 cd/m2 and standard deviation was 24.62 cd/m2 (Table 3).
In the analysis of luminance ratio on the primary displays, the values for brightness luminance ratio were significantly higher than the reference value of 250 cd/m2, with a mean difference of 283.97 cd/m2. Only one display did not reach the reference value. For the reference value of 500 cd/m2, the difference in results was not significant (33.97 cd/m2). Even though 14 of the 23 displays presented luminance ratio < 500 cd/m2. The mean global value was 533.97 cd/m2, with standard deviation of 185.57 cd/m2 (Table 3).
As regards the brightness luminance ratio observed on the secondary displays, the mean global luminance ratio was sig-nificantly above the reference value of 100 cd/m2, with a value of 451 cd/m2. The esti-mated difference was approximately 351 cd/m2, with standard deviation of 217.24 cd/m2. As the secondary displays were evaluated in relation to their own lumi-nance ratio criterion, presented a mean dif-ference that was higher than that of the primary displays with respect to their ref-erence values.
Illuminance levels measured on the pri-mary display workstations were mostly
outside the 2 to 10 lux interval (74%), de-spite the non-statistically significance. Only approximately 9% of the displays were found to be within the recommended interval, and 17% of them were signifi-cantly above such interval, between 50 and 180 lux. In cases where a reference value of 15 lux was considered, the difference was not significant, although approxi-mately 60% of the displays were above such value.
The illuminance levels measured on the secondary display workstations were found to be within the interval or below the maxi-mum recommended levels.
The analysis of the diagonal size of the primary and secondary display screens (in inches) demonstrated that there is an asso-ciation between display type and size. While 70% of the primary displays pre-sented the recommended dimensions, ap-proximately 30% of them did not, a higher rate as compared with the rate of non com-pliant secondary displays (23%).
No statistically significant correlation was observed between the number of years of life of each display and brightness Lmax and maximum brightness values (α > 0.05). However, it could be observed that in 28 of the 45 displays (with adjustable brightness at the maximum) the best brightness was associated with the best maximum bright-ness. Among the 28 displays, 41% revealed such a pattern. In this comparison, as pri-mary and secondary displays were sepa-rated, the tendency towards no association between displays life span and Lmax was maintained.
As the rate of variation in the Lmax on primary displays connected to a single
di-agnosis workstation, most (57.1%) of the workstations with self-adjusting displays presented a luminance difference ≤ 10%, while all three workstations equipped with manually adjustable displays were within this condition.
DISCUSSION
In general, the primary displays were within the recommended parameters. Al-though not significantly, only the values for displays size were low, while the illumi-nance values were above the minimum values or intervals.
It is important to highlight that the brightness Lmax values were not compliant with test requirements with regards to the reference level for luminance ratio of 500 cd/m2 (described on RCR document). Such values were significantly low, particularly in the case of manually adjustable displays, which as separately analyzed, presented greater discrepancy in relation to reference values. Hence, one might consider that the quality of self-adjusting displays would be better. However, the authors of the present study consider the hypothesis that the size of the sample of manually adjustable dis-plays is insufficient, as well as it is not possible to compare different makes and models of display devices in this particu-lar study.
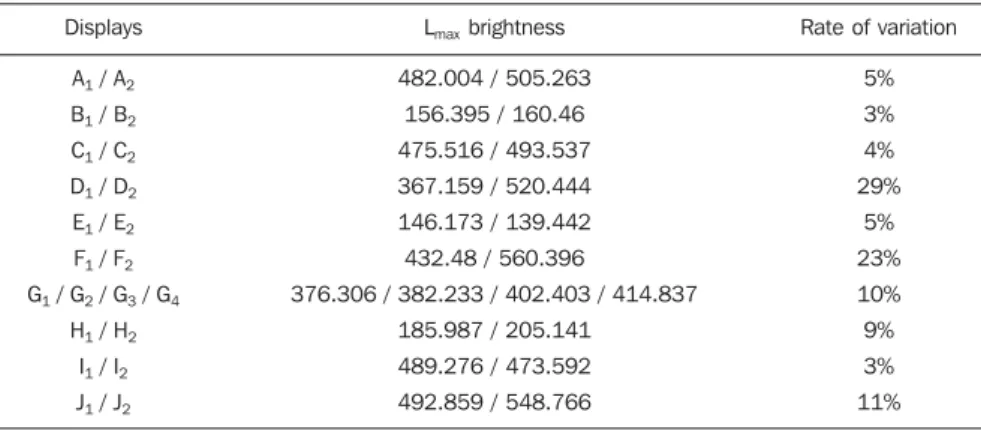
It is important to mention that, in spite of the small size of the sample, the manu-ally adjustable display pairs connected to a single diagnosis workstation, presented Lmax variation < 10% between them, differ-ently from some sets of self-adjusting dis-plays. On three workstations, differences > 10% in Lmax were observed between dis-plays.
For the standard values tested on sec-ondary displays, such as luminance ratio, Lmax and illuminance, the results were in most cases either significantly superior, or were mostly within the established param-eters. However the brightness observed on the display devices was variable, in some of them being as low as 0% or as high as 100%, which is not correct for images vi-sualization and also with respect to the dis-play devices life span.
Regarding the analysis of the associa-tion between Lmax and displays life spam
Table 3 Lmax values on primary displays connected to a single diagnostic workstation (for wokrstation A1/A2,…J1/J2), with respective rates of variation between them.
Displays
A1 / A2
B1 / B2
C1 / C2
D1 / D2
E1 / E2
F1 / F2
G1 / G2 / G3 / G4
H1 / H2
I1 / I2
J1 / J2
Lmax brightness
482.004 / 505.263 156.395 / 160.46 475.516 / 493.537 367.159 / 520.444 146.173 / 139.442 432.48 / 560.396
376.306 / 382.233 / 402.403 / 414.837 185.987 / 205.141
489.276 / 473.592 492.859 / 548.766
Rate of variation
5% 3% 4% 29%
(both for primary and secondary displays), the results demonstrated absence of such a correlation. Such analysis may have been impaired, considering that the studied dis-play devices were relatively new (≤ 5 years). As regards the ambient lighting in the workplaces, the effective and comfortable perception by the professional performing the visual task depends on the light inten-sity distribution(9). Several authors have
demonstrated that the illuminance effect on displays causes degradation of the low con-trast detail detection threshold(4). The
illu-minance causes reflection artifacts and loss in the quality of the display screen(6).
The effect of Lmax on the perceived im-age quality and its variation along time rep-resent important factors as the global per-formance of the display is evaluated. The luminance ratio is associated with the de-crease in the JND index, or the number of small luminance increments on the im-age(10). In order to attain primary
(diagnos-tic) and secondary (clinical) displays image agreement, the radiology technician should frequently check with the radiologist that the images are being transmitted with ap-propriate quality(11).
CONCLUSION
Some factors must be taken into con-sideration in the acquisition and installa-tion of equipment for medical image visu-alization. Along the present study one ob-serves that, as reported in the literature, the LCD is a good option for softcopy view-ing and processview-ing of medical images. Ambient lighting and ergonomic factors
must be taken into consideration in the installation of such devices, additionally to the implementation of displays quality control protocols.
According to the AAPM Report 03, im-aging diagnosis displays should undergo yearly inspections by an engineering expert and also monthly inspections by a quality control technician in order to detect abnor-malities and non-compliance with specific parametric values. The quality control pe-riodicity may be lower in those systems which automatically evaluate and stabilize the minimum and maximum luminance.
The imaging diagnosis display is the last link in the chain of medical imaging. With the variability of technologies and physi-cal degradation as the equipment ages, such display devices must be carefully evaluated in order to demonstrate an appropriate and stable performance along its life span. Therefore, the displays utilized for softcopy viewing and processing of medical images must be regularly verified in order to prop-erly maintain the required quality levels for the function they perform.
In the present study, the displays dem-onstrated a satisfactory performance, and the authors conclude that the adoption of an appropriate quality control plan will have a significant impact on the service provided by the health professional. The agreement between primary (diagnostic) and secondary (clinical) displays is invalu-able, as it allows the radiology technician who adjusts a radiological image to appro-priate diagnostic levels to do it effectively in order to assure a consistent image repro-duction on both types of displays.
The conclusions from the present study should be understood as the result from a case study to be validated by further stud-ies in order to allow their dissemination.
REFERENCES
1. Hirschorn DS. Image displays. In: Dreyer KJ, Hirschorn DS, Thrall JH, et al., editors. PACS – A guide to the digital revolution. 2nd ed. New York, NY: Springer; 2006. p. 347–62. 2. Aldrich JE, Rutledge JD. Assessment of PACS
display systems. J Digit Imaging. 2005;18:287– 95.
3. The Royal College of Radiologists. Picture archiving and communication systems (PACS) and quality assurance. [cited 2008 Apr 7]. Avail-able from: http://www.rcr.ac.uk/docs/radiology/ pdf/IT_guidance_QAApr08.pdf
4. Thompson DP, Koller CJ, Eatough JP. Practical assessment of the display performance of radiol-ogy workstations. Br J Radiol. 2007;80:256–60. 5. American Association of Physicists in Medicine. AAPM On-Line Report No. 03. Assessment of display performance for medical imaging sys-tems. [cited 2009 Mar 2]. Available from: http:// deckard.mc.duke.edu/~samei/tg18_files/tg18.pdf 6. Samei E, Badano A, Chakraborty D, et al. Assess-ment of display performance for medical imag-ing systems: executive summary of AAPM TG18 report. Med Phys. 2005;32:1205–25. 7. American Association of Physicists in Medicine
(AAPM) Task Group 18. [cited 2009 Sep 14]. Available from: http://www.duke.edu/~samei/ tg18.html
8. Pestana MH, Gageiro JN. Análise de dados para ciências sociais. A complementaridade do SPSS. 5ª ed. Lisboa, Portugal: Edições Silabo; 2008. 9. International Organization for Standardization.
ISO 8995:2002. Lighting of indoor work places. 2nd ed. Vienna, Austria; 2002.
10. Fifadara DH, Averbukh A, Channin DS, et al. Ef-fect of viewing angle on luminance and contrast for a five-million pixel monochrome display and a nine-million-pixel color liquid crystal display. J Digit Imaging. 2004;17:264–70.