ISSN 0102-695X
DOI: 10.1590/S0102-695X2012005000111 Received 10 Abr 2012
Accepted 8 Aug 2012 Available online 20 Sep 2012
l avonoids in a crude extract of
Dimorphandra
gardneriana
Leonardo P. Landim,
*George S. Feitoza, José G. M. da Costa
Programa de Pós-graduaçăo em Bioprospecção Molecular, Departamento de Química Biológica, Laboratório de Pesquisa em Produtos Naturais, Universidade Regional do Cariri, Brazil.
Abstract: A method for separation and quantification of three flavonoids by reverse-phase high performance liquid chromatography (HPLC) was developed and validated. Flavonoids present in a crude methanolic extract of the inner bark of
Dimorphandra gardneriana Tul., Fabaceae, were analyzed. Rutin, isoquercitrin and quercetin were used as calibration standards. The analysis was performed using a
Thermo Scientific Hypersil C18 column (250 x 4.0 mm i.d., 5 μm particle size),
as stationary phase, with a flow rate of 0.8 mL/min and detection at a wavelength of 356 nm. The proposed method was validated by resolution RE No. 899/2003 of the National Health Surveillance Agency. In this study, an excellent linearity was obtained with r higher than 0.99. Besides, the chromatographic peaks showed good resolution. With other validation data, including precision, specificity, accuracy and robustness, this method demonstrated good reliability and sensitivity, and can be conveniently used for the quantification of rutin, isoquercitrin and quercetin in crude methanolic extract of D. gardneriana pods. Furthermore, there are the advantages of easy sample preparation and short time between each injection.
Keywords:
Dimorphandra gardneriana HPLC
isoquercitrin quercetin rutin validation
Introduction
Dimorphandra gardneriana Tul., Fabaceae, known as “fava-d’anta” and “faveiro” is a Brazilian native leguminous tree, naturally found in the states of Maranhão, Piauí, Ceará, Pernambuco, Bahia, Pará, Goiás, Mato Grosso and Minas Gerais. The seed pod of “fava-d’anta” is one of the sources for the extraction of rutin on an industrial scale. Rutin belongs to an important class of
l avonoids, vital in their ability to increase the strength
of the capillaries and to regulate their permeability (Montano et al., 2007).
Rutin may be used in the treatment and prevention of small varicose veins. This substance is also used in mesotherapy or intradermotherapy to stimulate circulation in treatments against cellulite. It has been used for preparing patients with jaundice for surgery (Silva et al., 2007).
Quercetin is another substance extracted from D.
gardneriana and of great interest in the pharmaceutical industry. It is a natural polyphenolic antioxidant, present in vegetables, fruits and juices. Chemically, quercetin is an aglycone of rutin and other glycosides. It is a powerful antioxidant and free radical scavenger (Filho et al., 2001).
Another substance that may be found in D. gardneriana is isoquercitrin. It has been shown to play protective roles against lipid peroxidation and oxidative stress (Silva et al., 2008).
However, one of the impediments in the acceptance of herbal products worldwide is the lack of
standard quality control proi les (Shinde et al., 2009).
Chemical and chromatographic techniques may be used
to aid in the identii cation of an herbal material or extract.
Chromatographic techniques such as HPLC, TLC, GC and capillary electrophoresis and spectroscopic methods such
as IR, NMR and UV may also be used for i ngerprinting
(Patra et al., 2010).
In order to control the quality of herbal drugs in a better way, we must develop new techniques and terms to the maximum extent. The development and validation
of an efi cient analytical method is an integral part of
the quality control of the source material, to guarantee the safety and effectiveness of the resulting compound (Hefnawy et al., 2006).
Thus, considering the pharmacological potential of D. gardneriana and the lack of specii cations for the quality control of this plant raw material, which is a pre-requisite for the production and registration of
phytomedicines (Anvisa, 2010), the objective of the present study was to develop and validate a method for the separation and quantitative analysis of rutin (1), quercetin (2) and isoquercitrin (3) by HPLC obtained from a methanolic extract of the inner bark of pods of D.
gardneriana. This will provide the scientiic basis for the
quality control of extracts prepared from the inner bark of
this plant. The choice of these three lavonoids was based
on other studies, which reported the presence of these compounds in other species of Dimorphandra (Sousa et al., 1991; Ferreira et al., 2001; Lucci & Mazzafera, 2009). The method was validated according to regulation RE 899/2003 of the National Health Surveillance Agency, Brazil (Anvisa, 2003). The following validation
characteristics were assessed: speciicity, linearity, limit of detection and quantiication, accuracy, precision and
robustness.
Materials and Methods
Plant material
Pods of Dimorphandra gardneriana Tul., Fabaceae, were collected between June and July of 2010 in the city of Crato, State of Ceará, Brazil (Line E, Floresta Nacional do Araripe). The plant material was
identiied by Prof. Dr. Maria Arlene Pessoa da Silva from
the Department of Biological Sciences of Universidade Regional do Cariri. Exsiccates (number 18639) of the species were deposited in the Herbarium Caririense Dárdano de Andrade Lima in the same institution.
Preparation of the extract
The plant material was submitted to a drying process at room temperature. The bark and seeds were then removed. The inner bark (1 kg) was separated and triturated. The powder was weighed and extracted with 2 L methanol, at room temperature, for 72 h. Afterwards,
the liquid was iltered and concentrated using a rotary
evaporator under reduced pressure to obtain 18 g of crude extract.
Chemicals and reagents
All reagents and solvents were analytical and HPLC grades (Tedia, USA), except phosphoric acid (Vetec, Brazil) and sodium dihydrogen phosphate (Caledon, Canada). Ultra-pure water obtained using a Milli-Q Gradient® apparatus (Millipore, USA) with
conductivity of 0.60 µS/cm was used in all experiments. Rutin, quercetin and isoquercitrin (Sigma, USA) of the highest grade (purity>98.0%) were used as the external standards.
Instrumentation and chromatographic conditions
The analyses were carried out using an HPLC system (Shimadzu, USA) consisting of a solvent delivery pump (Model LC-10 ADvp), a variable wavelength UV/ VIS detector (Model SPD 10 AVP), a manual injection valve (Rheodyne®, USA) with a 20 μL loop, and degasser
(DGU 14A). Data collection and analyses were performed using CLASS-VPTM System Software. A gradient elution
was performed on a Thermo Scientiic Hypersil C18
column (250 x 4.0 mm i.d., 5 μm particle size) (Thermo Scientiic, USA). The mobile phase consisted of two
different solutions, solution A and solution B. Both solutions consisted of tetrahydrofuran (THF) and sodium dihydrogen phosphate buffer (15.6 g/L) adjusted to pH 3.0 with phosphoric acid, where the proportion of THF and buffer was 5:95 for solution A and 40:60 for solution
B. All solutions were degassed and iltered through a 0.45 μm pore size ilter (Millipore, USA). Separations were
effected by a gradient elution program as follows: from 0 to 10 min, solution B followed a linear change from 50% to 100%; from 10 to 15 min, B was isocratic at 100%; from 15 to 16 min, B linearly changed from 100% to 50% and from 16 to 20 min, B was isocratic at 50%. The
mobile phase low rate was 1 mL/min and the injection volume was 20 μL. UV detection was performed at 356
nm.
Using these chromatographic conditions, it
was possible to conirm the retention time of rutin,
O HO
OH O OR
OH O
O
HO OH
OH O
OH HO
H3C HO OH
1R=a
2R=H
3R=b
a
O
HO OH
OH OH
quercetin and isoquercitrin by injection of each standard separately.
Sample preparation
In the present study, 100 mg of crude extract were dissolved in 100 mL methanol. This sample was submitted to sonication to speed dissolution of the particles. Next,
2 mL were transferred to a suitable volumetric lask
and diluted to 100 mL with mobile phase (solution B). A solution was obtained with a known concentration of 0.02 mg/mL.
Preparation of standard solution
Accurately weighed appropriate amounts of the reference compounds (rutin RUT; quercetin QUE; isoquercitrin ISO) were mixed and dissolved in methanol
in a 200-mL volumetric lask, to obtain a stock solution.
The concentration of the three compounds in this solution was 1000 µg/mL (RUT), 166.7 µg/mL (ISO) and 13.3 µg/mL (QUE). Besides, external standards were
established at ive data points covering the concentration
range of each compound according to the level estimated in the plant sample. Working solutions were prepared by stepwise dilution of the stock solution with solution B of mobile phase.
Method validation
In the validation of the analytical method used
for the quantiication of rutin, quercetin and isoquercitrin
in the methanolic extract of D. gardneriana, the following
parameters were determined: speciicity, linearity,
sensitivity, accuracy, precision and robustness.
Speciicity
Speciicity is the ability of a method to
discriminate between the study analyte(s) and other
components in the sample. Speciicity of the HPLC
method is demonstrated by the separation of the analytes from other potential components such as impurities, degradants, or excipients (Dong, 2006). In this study, the
speciicity was demonstrated by running a procedural
blank, where 2 mL of methanol were transferred to a
suitable volumetric lask and diluted to 100 mL with
mobile phase (solution B). In addition, the resolution
between the peaks of the main lavonoids that could
be found in methanolic extracts of D. gardneriana was determined by analysis of chromatograms of the standard solution and the sample solution. This resolution was calculated by Shimadzu CLASS-VP® software version
6.12 SP2.
Linearity
The linearity between peak area and concentration was analyzed using three calibration curves obtained with
standard solutions at ive different concentrations of each
standard RUT, QUE and ISO. The concentrations of the three compounds in the solution that was considered 100% was 15 µg/mL (RUT), 2.5 µg/mL (ISO) and 0.2 µg/mL (QUE). The other concentration levels used to construct calibration curves were 80, 90, 110 and 120 % of the concentration mentioned above (Anvisa, 2003).The data for peak area versus drug concentration were treated by linear regression analysis.
Sensitivity
The limit of detection (LOD) and the limit
of quantiication (LOQ) were determined from the calibration curves of the RUT, QUE and ISO standards.
LOD was calculated according to the expression DPx3/ IC, where DP is the standard deviation of the response and IC is the slope of the calibration curve. LOQ was established by using the expression DP x10/IC (Anvisa, 2003).
Accuracy
The accuracy was evaluated by means of recovery assays carried out by adding known amounts of the RUT and ISO standard to the sample, at three different levels (5%, 10% and 15%) of the initial concentration of the sample. For evaluation of recovery of quercetin standard
was added to the sample whose inal concentration were
0.180, 0.200 e 0.220 µg/mL of this compound. Each solution was injected in triplicate. Average recoveries were calibrated by the formula recovery (%) = {(amount found - original amount)/amount spiked} x 100.
Precision
standard deviations (% RSD) of the concentrations of each compound, RUT, QUE and ISO.
Robustness
Three sample solutions were prepared and analyzed under the conditions established and by changing the wavelength parameter from 356 nm to 358 nm, by using columns from different suppliers and by changing the pH of the mobile phase from 3.0 to 3.1 (Anvisa, 2003).
Statistical analysis
The data were submitted to statistical analysis using GraphPadPrism5® and Excel® software.
Results and Discussion
The HPLC method carried out in this study was aimed at developing a chromatographic system, capable
of eluting and resolving lavonoid compounds in a crude
methanolic extract of Dimorphandra gardneriana Tul., Fabaceae. In the development of the HPLC method for determination of rutin (1), quercetin (2) and isoquercitrin (3) in a methanolic extract of D. gardneriana, several solvent systems (methanol-water, acetonitrile-water, tetrahydrofuran-buffer) and separation columns Thermo
Scientiic Hypurity C8 column (250 x 4.6 mm i.d., 5 μm
particle size), Thermo Scientiic Hypersil C18 column
(250 x 4.0 mm i.d., 5 μm particle size, Phenomenex
Hyperclone BDS C18 (100 x 4.6 mm i.d., 5 μm particle size), Restek Pinnacle II C8 (250 x 4.6 mm i.d., 5 μm particle size) were evaluated and compared. The Thermo
Scientiic Hypersil C18 column provided better separation
of the plant extract than with other speciications or
brands of columns.
The choice of detection wavelength was determined by performing a screening with 10 ppm of rutin, major compound, in methanol in a spectrophotometer UV/ VIS. The UV spectra were recorded from 220 to 360 nm and exhibited maximum wavelengths at 254 nm and 356 nm. It was carried out an analysis on HPLC with the two wavelengths and which provided better response even for the others compounds (quercetin and isoquercitrin) was at a wavelength of 356 nm.
The optimization of the chromatographic conditions led to a good resolution of adjacent peaks
of the lavonoids in this study when compared to other methods previously described for the quantiication of
these compounds in crude plant materials (Chou et al., 2009; Batista et al., 2010).
The results for quantiication of the lavonoids in the sample were 14.506 μg/mL of rutin and 2.220 μg/mL
of isoquercitrin , which means, 72.53 and 11.10% of each
compound contained in the crude extract (20 μg/mL),
respectively. Quercetin was not found in concentrations levels possible to be measured. It is important to note that
this is the irst report of quantiication of lavonoids in
crude extracts of D. gardneriana.
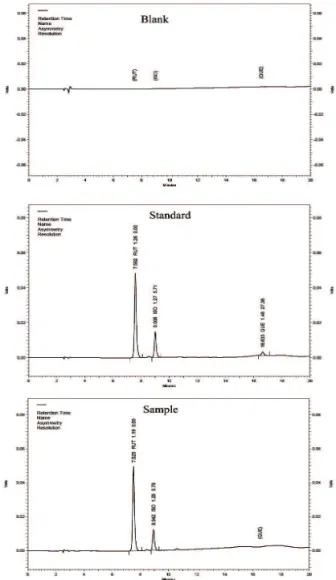
The speciicity of the method was evaluated
by analysis of the blank, standard and sample solution chromatograms (Figure 1). Good separation between the peaks of RUT, QUE and ISO was achieved, with the retention times, 7.5 min for rutin, 9 min for isoquercitrin and 16.5 min for quercetin. Furthermore, the chromatographic peaks showed good resolution (around 5.7 between RUT and ISO and approximately 27 between RUT and QUE). In relation to assimetry, the peaks showed values between 1.19 and 1.29 for RUT and ISO and 1.48 for asymetry of the peak of QUE.
Figure 1. Chromatograms of the blank, standard and sample
solution performed on a Thermo Scientiic Hypersil C18 column
(250 x 4.0 mm i.d., 5 μm particle size) at 356 nm.
Linearity was evaluated by the correlation
coeficient r, and all values for the three compounds
80 to 120%) were linear. Besides, according to Anvisa
(2003), the minimum acceptable correlation coeficient
is 0.990.
As shown in Table 1, the LOD values were 0.09 µg/mL, 0.02 µg/mL and 0.02 µg/mL for the compounds RUT, ISO and QUE, respectively, while the LOQ values were 0.29 µg/mL, 0.07 µg/mL and 0.05 µg/mL.
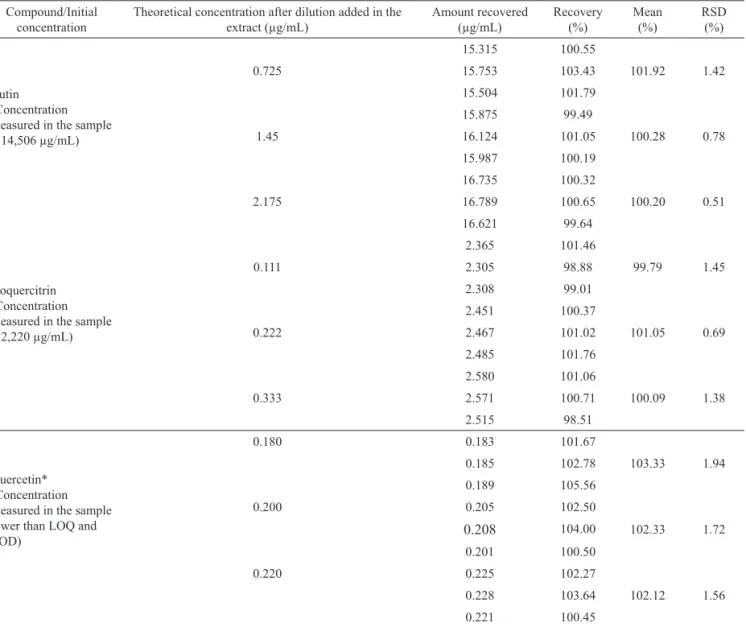
The recovery of the compounds RUT, QUE and ISO was determined by spiking the crude extract with known amounts of RUT, QUE and ISO standards.
Recovery of each substance was obtained from the calculated amount found and original amount. The results are presented in Table 2 and conform with the recommendations of Anvisa (Anvisa, 2003).
The data of the precision are shown in Table 3.
The results display a coeficient of variation less than that
recommended by RE 899 (Anvisa, 2003) whose limit is
5%. Also, there were no signiicant differences between
assay results, indicating that the precision of the proposed method was satisfactory.
Table 1. Calibration curve parameters, limit of detection (LOD), limit of quantiication (LOQ) for rutin, isoquecitrin and quercetin.
Compound Calibration curve equation Correlation coeficient (r) Linear range (µg/mL) LOD(µg/mL) LOQ(µg/mL)
rutin y = 32844.31x + 178861.53 0.9987 12-18 0.09 0.29
isoquercitrin y = 58813.51x + 52111.13 0.9983 2-3 0.02 0.07
quercetin y = 128566.83x + 25130.40 0.9982 0.16-0.24 0.02 0.05
Table 2. Results of accuracy determination by analyzing of the rutin, quercetin and isoquercitrin of known concentrations. Compound/Initial
concentration
Theoretical concentration after dilution added in the extract (µg/mL)
Amount recovered (µg/mL)
Recovery (%)
Mean (%)
RSD (%)
Rutin (Concentration measured in the sample = 14,506 µg/mL)
0.725
15.315 100.55
101.92 1.42 15.753 103.43
15.504 101.79
1.45
15.875 99.49
100.28 0.78 16.124 101.05
15.987 100.19
2.175
16.735 100.32
100.20 0.51 16.789 100.65
16.621 99.64
Isoquercitrin (Concentration measured in the sample = 2,220 µg/mL)
0.111
2.365 101.46
99.79 1.45
2.305 98.88
2.308 99.01
0.222
2.451 100.37
101.05 0.69
2.467 101.02
2.485 101.76
0.333
2.580 101.06
100.09 1.38
2.571 100.71
2.515 98.51
Quercetin* (Concentration measured in the sample lower than LOQ and LOD)
0.180 0.183 101.67
103.33 1.94
0.185 102.78
0.189 105.56
0.200 0.205 102.50
102.33 1.72
0.208 104.00
0.201 100.50
0.220 0.225 102.27
102.12 1.56
0.228 103.64
0.221 100.45
*Since the concentration of quercetin measured was lower than LOQ and LOD to calculate the recovery its initial concentration was considered as
Robustness was evaluated to ensure that the HPLC method is insensitive to small changes in the experimental conditions. In this study, the wavelength, column supplier and pH of the mobile phase were changed.
None of the modiications caused any signiicant change
in the resolution or response of the RUT, QUE and ISO peaks.
All results were displayed according to the Guide for Validation of Analytical and Bioanalytical Methods RE 899 (Anvisa, 2003).
The quantitative method developed here was successfully applied in the simultaneous analysis of three different compounds in a crude methanolic extract of D.
gardneriana. Taking into account the results obtained in this study, the proposed method can be conveniently used for the analysis of rutin, isoquercitrin and quercetin in crude methanolic extracts of D. gardneriana pods.
The proposed method demonstrated high
speciicity at 356 nm detection for the pod extract of D. gardneriana showing reliability in the quantiication of
RUT, ISO and QUE. Furthermore, the method has the following advantages: rapid extraction, easy sample preparation and short time between injections. In
summary, the method above can be considered speciic,
exact, precise, linear, robust and easy to perform.
Acknowledgment
The authors would like to acknowledge inancial
support from Brazilian research agencies CAPES, CNPq, CNPQ-INCT for Excitotoxicity and Neuroprotection.
References
Anvisa 2003. Resolução-RE no 899: Guia para validação de
métodos analíticos e bioanalíticos. Diário Oicial da
União. http://www.in.gov.br/imprensa/visualiza/index. jsp?jornal=1&pagina =56&data=02/06/2003, accessed in Jul 2011.
Anvisa 2010. Resolução-RDC no 14: Dispõe sobre o registro
de medicamentos itoterápicos. Diário Oicial da União.
http://www.in.gov.br/visualiza/index.jsp?data=05/0 4/2010&jornal=1&pagina= 85&totalArquivos=160, accessed in Nov 2011.
Batista ANL, Colombo R, Pascoli IC, Teles HL, Silva GH,
Bonim GCC, Burgos RCR, Cavalheiro AJ, Bolzani
VS, Silva DHS, Reimberg MCH 2011. Development and validation of a HPLC method for standardization of herbal and commercial extracts of Myrcia unilora. Rev
Bras Farmacogn 21: 402-406.
Chou G, Xu SJ, Liu D, Koh GY, Zhang J, Liu Z 2009.
Quantitative and ingerprint analyses of chinese sweet
tea plant (Rubus suavissimus S. Lee). J Agric Food
Chem 57: 1076-1083.
Dong MW 2006. Regulatory aspects of HPLC analysis: HPLC system and method validation. In Dong MW (org.)
Modern HPLC for practicing scientists. John Wiley & Sons, p. 230.
Ferreira RA, Botelho AS, Davide AC, Malavasi MM 2001. Morfologia de frutos, sementes, plântulas e plantas jovens de Dimorphandra mollis Benth. - faveira (Leguminoseae- Caesalpinioideae). Rev Bras Bot 24: 303-309.
Filho WD, Silva EL, Boveris, A 2001. Flavonóides, antioxidantes Table 3. Results of the repeatability, intermediate precision and reproducibility tests.
Compound Repeatability RSD (%)
Mean (µg/mL)±standard deviation (n=6)
rutin 15.062±0.083 0.551
isoquercitrin 2.491±0.007 0.294
quercetin 0.201±0.003 1.457
Compound Intermediate precision RSD (%)
Mean (µg/mL)±standard deviation (n=12)
rutin 15.076±0.103 0.692
isoquercitrin 2.494±0.013 0.473
quercetin 0.200±0.002 1.170
Compound Laboratory Reproducibility RSD (%)
Mean (µg/mL)±standard deviation (n=6)
rutin Farmace 15.065±0.101 0.668
UFC 15.213±0.121 0.621
isoquercitrin Farmace 2.494±0.020 0.798
UFC 2.594±0.044 1.699
quercetin Farmace 0.201±0.003 1.587
de plantas medicinais e alimentos: importância e perspectivas terapêuticas. In: Yunes RA, Calixto JB
Plantas Medicinais sob a ótica da química medicinal moderna. São Paulo: Universitária, p.317-334.
Hefnawy MM, Sultan MA, Al-Shehri MM 2006. Direct enantiomeric resolution of betaxolol with application to analysis of pharmaceutical products. Anal Chem
Insights 1: 13-20.
Lucci N, Mazzafera P 2009. Rutin synthase in fava d’anta:
Puriication and inluence of stressors. Can J Plant Sci 89: 895-902.
Montano HG, Silva GS, Rocha RC, Jimenez, NZA, Pereira RC, Brioso PST 2007. Phytoplasma in “fava d'anta” tree (Dimorphandra gardneriana) in Brazil. Bull Insectology
60: 147-148.
Patra KC, Pareta SK, Harwansh RK, Kumar KJ 2010. Traditional approaches towards standardization of herbal medicines-A review. J Pharm Sci Technol 2: 372-379.
Shinde VM, Dhalwal K, Potdar M, Mahadik KR 2009. Application of quality control principles to herbal drugs. Int J Phytomed 1: 4-8.
Silva SR 2007. Ecologia de População e Aspectos Etnobotânicos
de Dimorphandra gardneriana Tullasne
(Leguminosae-Mimosaceae) na Chapada do Araripe, Ceará-CE.
Brasília, 105p. Tese de Doutorado. Programa de Pós-graduação em Ecologia, Universidade de Brasilía. Silva BA, Malva O, Dias AC 2008. St. John's Wort (Hypericum
perforatum) extracts and isolated phenolic compounds are effective antioxidants in several in vitro models of oxidative stress. Food Chem 110: 611-619.
Sousa MP, Matos MEO, Matos FJA, Machado MIL, Cravetro AA 1991. Constituintes químicos ativos de plantas
medicinais brasileiras. Fortaleza: Universidade Federal do Ceará.
*Correspondence
Leonardo Pinheiro Landim
Departamento de Química Biológica, Laboratório de Pesquisa em Produtos Naturais, Universidade Regional do Cariri Av. Cel Antonio Luiz, 1161, 63.000-000 Crato-CE, Brazil [email protected]