Short Report
Printed in Brazil - ©2014 Sociedade Brasileira de Química0103 - 5053 $6.00+0.00S
*e-mail: [email protected]
UV-Vis Spectrometric Detection of Biodiesel/Diesel Blend Adulterations with
Soybean Oil
David D. S. Fernandes,a Adriano A. Gomes,a Marcelo M. de Fontes,b Gean B. da Costa,b
Valber E. de Almeida,c Mario C. U. de Araújo,a Roberto K. H. Galvãod and Germano Véras*,c
aLaboratório de Automação e Instrumentação em Química Analítica/Quimiometria (LAQA),
Departamento de Química, Universidade Federal da Paraíba, Caixa Postal 5093, 58051-970 João Pessoa-PB, Brazil
bPrograma de Pós-Graduação em Ciências Agrárias and cDepartamento de Química, CCT,
Universidade Estadual da Paraíba, 58429-500 Campina Grande-PB, Brazil
dDivisão de Engenharia Eletrônica, Instituto Tecnológico de Aeronáutica,
12228-900 São José dos Campos-SP, Brazil
Um método para detecção de adulterações de misturas de biodiesel/diesel (B5) com óleo de soja empregando espectrometria UV-Vis é proposto. O estudo envolve 90 amostras compreendendo misturas B5 com e sem a adição de óleo de soja (0,5 a 2,5% v/v). Uma discriminação apropriada foi obtida utilizando classificadores SIMCA (modelagem independente e flexível por analogia de classe), KNN (K-vizinhos mais próximos), PLS-DA (análise discriminante por mínimos quadrados parciais) e SPA-LDA (análise discriminante linear com algoritmo de projeções sucessivas).
A method for detecting adulterations of biodiesel/diesel blends (B5) with soybean oil using UV-Vis spectrometry is proposed. The study involves 90 samples comprising B5 blends with and without the addition of soybean oil (0.5 to 2.5% v/v). Suitable discrimination was achieved by using SIMCA (soft independent modeling of class analogy), KNN (K-nearest neighbors), PLS-DA (partial least squares discriminant analysis) and SPA-LDA (linear discriminant analysis with spectral variables selected by the successive projections algorithm) classifiers.
Keywords: biodiesel, adulteration, UV-Vis spectrometry, multivariate classification
Introduction
Since 2010, Brazilian regulations state that diesel fuel must be blended with 5% biodiesel prior to commercial distribution. This blend, termed B5, may have a variation of up to ± 0.5% (v/v) in biodiesel content, as established by the Brazilian national fuel authority (Agência Nacional de Petróleo, Gás natural e Biocombustível-ANP).1 Within
this scenario, concerns may be raised with regard to adulterations of B5 blends with raw vegetable oil,2-11 which
could be added by fuel retailers to increase profits. Such adulterations cause increase of engine wear12 and constitute
a crime against the popular economy.
The analytical method recommended by ANP for determination of biodiesel in diesel is based on the European
standard EN 14078.13 This method employs a single
wavelength in the mid-infrared region, namely 5730 nm (1745 cm-1), which corresponds to the peak of stretching
band of carbonyl.13 However, since this band is also found in
vegetable oils, the reference method is unable to discriminate B5 blends from mixtures of diesel, biodiesel and vegetable oil. Such a discrimination cannot be carried out on the basis of refractive index, density or viscosity, either. In fact, diesel, biodiesel and vegetable oil all have values ranging from 0.82 to 0.92 kg m-3 for density14-16 at 20 °C and from
1.4 to 1.5 for refractive index.16 A better alternative might
lie in the use of viscosity, which exhibits distinct values for vegetable oil, as compared to diesel and biodiesel. Viscosity values for soybean oil,17 for example, range from 58.5 to
62.2 mm2 s-1, which is substantially larger compared to diesel
(2.0-4.5 mm2 s-1)14 and biodiesel (3.0-6.0 mm2 s-1).15 However,
with up to 2.5% v/v of vegetable oil are not enough to change the viscosity of B5 blends in a significant manner. It is worth noting that an adulteration with 2.5% v/v of vegetable oil is not negligible, as it corresponds to 50% of the biodiesel content in commercial B5 blends.
In this context, much research effort has been devoted to the development of spectrometric methods for quality control of diesel/biodiesel blends with respect to adulterations with vegetable oil,2-11 as summarized in
Table 1. As can be seen, the literature has been mostly concerned with the use of near/mid infrared spectrometry and spectrofluorimetry, together with chemometrics tools for multivariate classification or calibration. Within this scope, it would be interesting to investigate the possibility of detecting such adulterations by using UV-Vis spectrometry, which is a simpler and less expensive technique.18 Indeed,
recent papers19,20 have demonstrated the feasibility of using
UV-Vis spectrometry for classification of biodiesel samples with respect to the base oil employed in their production,19
as well as for the determination of biodiesel in biodiesel/ diesel blends.20 However, the use of UV-Vis spectrometry
for detection of vegetable oil adulterations in biodiesel/ diesel blends has not been reported in the literature.
The present paper proposes the use of UV-Vis spectrometry for detection of soybean oil in biodiesel/diesel blends. Soybean oil is the cheapest and most common vegetable oil found in the Brazilian market and thus constitutes the prime candidate for use as an adulterant. The proposed method is based on the discrimination of UV-Vis spectra of adulterated and non-adulterated blends by using multivariate classification techniques. More specifically, four techniques are compared in this investigation, namely SIMCA (soft independent modeling of class analogy), KNN (K-nearest neighbors), PLS-DA (partial least squares
discriminant analysis) and SPA-LDA (linear discriminant analysis with spectral variables selected by the successive projections algorithm).
Experimental
Samples
The present work involved a total of 90 samples, comprising 31 biodiesel/diesel blends (B5), and 59 samples of B5 blends adulterated with soybean oil (OB5) in the range of 0.5 to 2.5% (v/v). This range corresponds to 10-50% of the biodiesel content in commercial B5 blends. The diesel samples were provided by Petrobras (Cabedelo, Paraíba, Brazil). Soybean oils from different brands and lot were acquired in local supermarkets for use in the production of biodiesel and adulteration of the B5 blends.
The biodiesel employed in the blends was prepared by using the soybean oil feedstock and transesterification reaction via methanol route as described elsewhere.20
UV-Vis spectra acquisition
The spectra of the samples were acquired in the range of 430-850 nm with resolution of 1 nm by using a Perkin Elmer Lambda 750 spectrophotometer with optical path of 1 cm. Each spectrum was recorded in triplicate and all subsequent calculations were carried out by using the average spectrum of each triplicate.
Data analysis and software
The deviations of baseline of the spectra were removed by using an offset correction procedure, which consisted
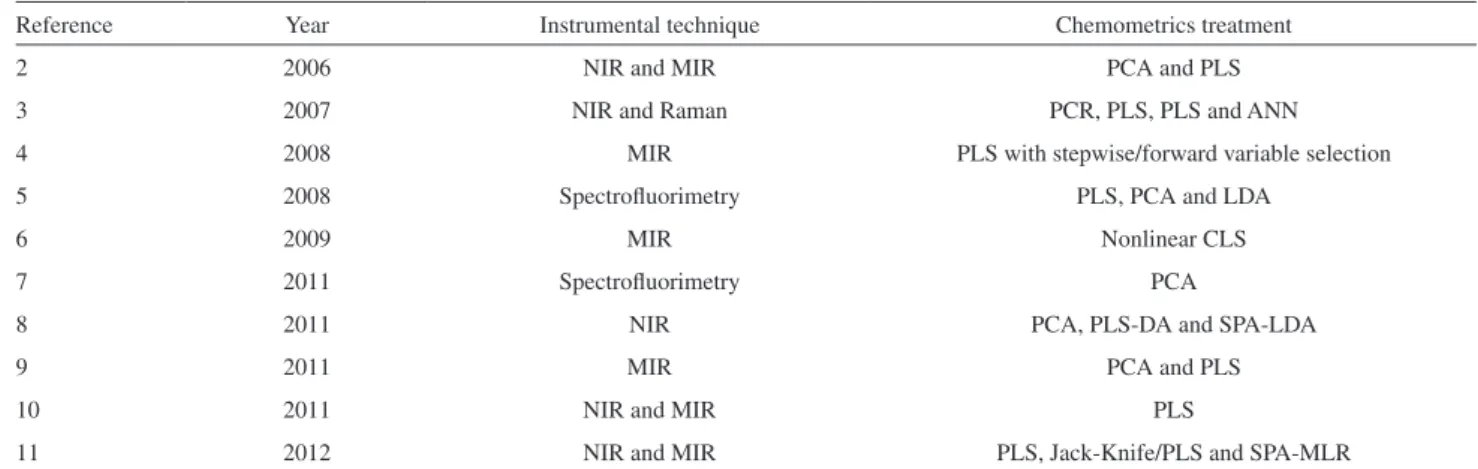
Table 1. Methods proposed in the literature for detection of vegetable oil adulterations in diesel/biodiesel blends
Reference Year Instrumental technique Chemometrics treatment
2 2006 NIR and MIR PCA and PLS
3 2007 NIR and Raman PCR, PLS, PLS and ANN
4 2008 MIR PLS with stepwise/forward variable selection
5 2008 Spectrofluorimetry PLS, PCA and LDA
6 2009 MIR Nonlinear CLS
7 2011 Spectrofluorimetry PCA
8 2011 NIR PCA, PLS-DA and SPA-LDA
9 2011 MIR PCA and PLS
10 2011 NIR and MIR PLS
11 2012 NIR and MIR PLS, Jack-Knife/PLS and SPA-MLR
of shifting each spectrum in order to move its lowest point to zero. An exploratory analysis was then carried out by using Principal Component Analysis (PCA). The Kennard-Stone algorithm21 was subsequently employed
to divide the spectra into training, validation and test sets for SIMCA, KNN, PLS-DA and SPA-LDA modelling, as shown in Table 2. SIMCA and KNN are standard classification techniques, which are described in detail in textbooks.22 PLS-DA is an extension of conventional PLS
modelling in which the desired model output is expressed in terms of class indices (0 or 1 for two-class problems, for example).23,24 SPA-LDA is a recently proposed
technique which employs SPA to select a suitable subset of variables for LDA classification.25 A detailed review
of the use of SPA-LDA in analytical applications can be found elsewhere.26
The training samples were used to build the classification models. The validation samples were employed to select the number of principal components in SIMCA, the number K of neighbors in KNN, the number of factors in PLS-DA and the spectral variables in SPA-LDA. Finally, the test samples were used as an external set to assess the classification performance of the resulting models.
Baseline offset correction, PCA, SIMCA and PLS-DA were carried out in The Unscrambler 9.7. Sample set partitioning (Kennard-Stone algorithm), KNN and SPA-LDA modelling were implemented in Matlab 2010b.
In the discussion of the classification results, the terms negative and positive will refer to non-adulterated (B5) and adulterated (OB5) samples, respectively. Therefore, a false negative will indicate an OB5 sample classified as B5,
whereas a false positive will indicate a B5 sample classified as OB5. The classification accuracy will be calculated as the number of correct classifications divided by the total number of samples in the set under consideration (training, validation or test). The sensitivity rate was calculated as the number of correct positive decisions divided by the number of positive cases. The specificity rate was calculated as the number of correct negative decisions divided by the number of negative cases.27,28
Results and discussion
UV-Vis spectra
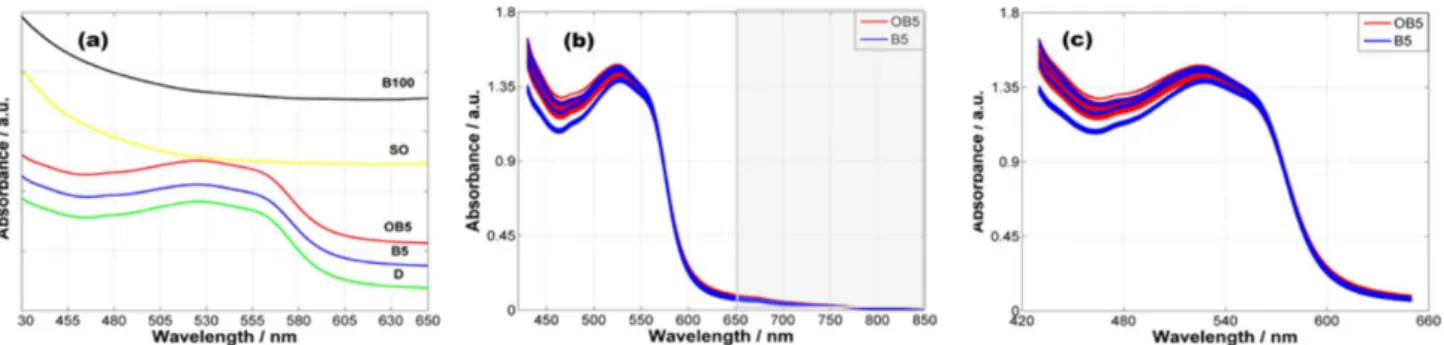
Figure 1a presents typical UV-Vis spectra of diesel (D), biodiesel (B100), soybean oil (SO), B5 biodiesel/diesel blend and B5 blend adulterated with 2.5% (v/v) of soybean oil (OB5). Due to the chemical similarity of biodiesel with respect to the soybean oil used as feedstock, the B100 and SO samples have similar spectral profiles, Moreover, since diesel is the majoritary component in B5 and OB5, the spectra of D, B5 and OB5 are also very similar, with a strong absorption band around 525 nm. This band can be ascribed to the presence of a dye marker, which is added to diesel fuel for identification and protection of source and destination.29
Figure 1b presents the UV-Vis spectra of the 90 samples (B5 and OB5) employed in the classification study. As can be seen, the spectra of the B5 samples form two clusters, which are most likely associated to differences in the composition of the diesel samples employed in the blends. Since the absorbance is very small at larger wavelengths (shaded region in Figure 1b), the study was restricted to range of 430-650 nm, as shown in Figure 1c.
Principal component analysis
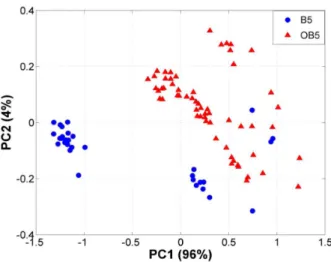
Figure 2 presents the PC2 × PC1 score plot obtained from the UV-Vis spectra of the 90 samples under
Table 2. Division of the samples into training, validation and test sets
Classes Training Validation Test
B5 15 8 8
OB5 27 16 16
Total 42 24 24
consideration. The percentage of explained variance is indicated at each axis. As can be seen, the use of PCA reveals some degree of separation between the B5 and OB5 samples, which was not apparent in Figure 1c. However, further chemometrics processing is still necessary to reduce the overlapping between the two classes. For this purpose, the SIMCA, KNN, PLS-DA and SPA-LDA classification techniques were employed, as reported below.
SIMCA classification
A SIMCA model was built for each class under consideration (B5 and OB5). Two principal components in each class model were sufficient to explain almost 100% of the data variance. Figure 3a presents the resulting plot of discrimination power of the spectral variables. As can be seen, the most important variables to discriminate
adulterated (OB5) from non-adulterated (B5) samples range from approximately 520 nm to 560 nm. This region corresponds to the main absorption band of the UV-Vis spectra, as discussed above. Figures 3b and 3c present the boundaries of the B5 and OB5 class models at the default significance level (5%) of the software package. As can be seen, the classification resulted in three false positives (B5 samples located outside the boundaries of the B5 model in Figure 3b) and no false negatives (no OB5 samples located outside the boundaries of the OB5 model in Figure 3c). The absence of false negatives indicates that the proposed method has suitable sensitivity to detect the presence of adulterations. It is also worth noting that the three false positives corresponded to samples used in the training set. Therefore, all samples in the validation and test sets were correctly classified.
KNN classification
The number K of neighbors employed in the KNN classifier was selected on the basis of the number of classification errors in the validation set, as shown in Figure 4. The optimum choice was K = 1, for which no validation errors were obtained. As a result, all samples in both the training and test sets were also correctly classified, i.e. no false positives or false negatives were obtained.
PLS-DA classification
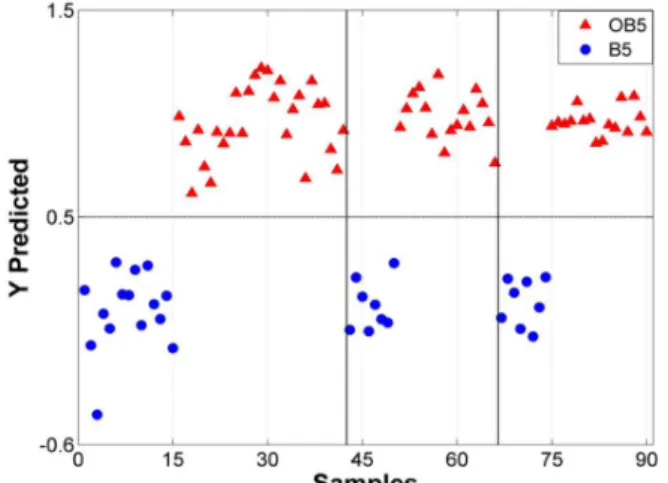
The PLS-DA model was built by assigning y-values 0 and 1 to samples in the B5 and OB5 classes, respectively. In the classification stage, a threshold value of 0.5 was adopted to discriminate the two classes. As shown in
Figure 2. PC2 × PC1 score plot for the overall data set.
Figure 5, all samples in the training, validation and test sets were correctly classified, i.e. no false positives or false negatives were obtained.
SPA-LDA classification
In SPA-LDA, the optimal number of spectral variables is determined on the basis of a cost function related to the risk of incorrect classification in the test set.25,26 As
shown in Figure 6a, the minimum of the cost is achieved by using three variables. These variables correspond to the wavelengths 439, 533 and 609 nm, as indicated in Figure 6b.
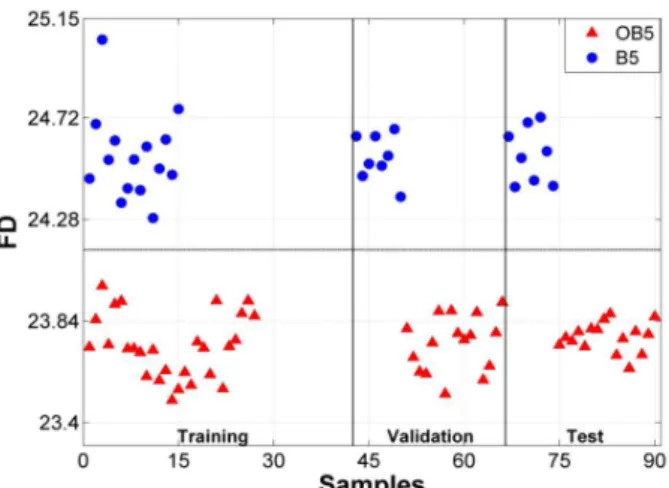
Figure 7 shows a plot of the Fisher discriminant scores resulting from the SPA-LDA model for the samples in the training, validation and test sets. As can be seen, all samples were correctly classified, which indicates that the discriminatory information conveyed by the full spectrum in the range 430-650 nm was preserved in the three selected wavelengths.
In brief, the classification results obtained in this investigation can be summarized as follows. The KNN, PLS-DA and SPA-LDA models correctly classified all samples in the training, validation and test sets, which corresponds to accuracy, sensitivity and specificity rates of 100%. The SIMCA model also provided accuracy, sensitivity and specificity rates of 100% for the validation and test sets. The three false positives observed in Figure 3b resulted in a classification accuracy of 93% in the training set, with a specificity rate of 80%. However, the sensitivity rate was 100% as no false negatives were obtained.
Conclusion
This paper proposed the use of UV-Vis spectrometry as a simpler alternative for detection of vegetable oil adulterations in biodiesel/diesel blends. More specifically, soybean oil adulterations were investigated because this is the cheapest and most common vegetable oil found in
Figure 4. Number of errors in the validation set as a function of the number K of neighbors employed in the KNN classifier.
Figure 5. PLS-DA classification results.
Figure 7. Fisher discriminant (FD) scores resulting from the SPA-LDA model with three wavelengths. The classification boundary is indicated by a horizontal line.
Brazilian market and thus constitutes the prime candidate for use as an adulterant.
The performance of the SIMCA, KNN, PLS-DA and SPA-LDA models was evaluated by using a test set comprising samples that were not used in the model-building procedures. In this test set, all the adulterated samples were correctly discriminated from the non-adulterated ones. It is worth noting that the adulteration levels employed in this investigation (0.5-2.5% v/v) are not negligible, as they correspond to 10-50% of the biodiesel content in commercial blends. However, even at the largest adulteration level (2.5% v/v) the physico-chemical parameters of the samples (viscosity, density, refractive index) did not display significant changes. Therefore, the proposed UV-Vis spectrometric method can be considered a useful complement to the methods usually employed by the regulatory agents.
Future works could be concerned with the development of a low-cost led-based photometer to monitor the three wavelengths selected by SPA-LDA in field applications. The possibility of building quantification models to determine the level of adulteration could also be investigated.
Acknowledgements
This work was supported by CNPq (grant 576416/2008-8, research fellowships and scholarships), Capes (scholarships) and Fapesp (grant 2011/17610-0).
Supplementary Informations
Supplementary Information is available free of charge at http://jbcs.sbq.org.br, as PDF file.
References
1. Agência Nacional de Petróleo, Gás natural e Biocombustível (ANP); Resolution No. 42, 16.12.2009 - DOU 14.1.2010. 2. Pimentel, M. F.; Ribeiro, G. M. G. S.; Cruz, R. S.; Stragevitch, L.;
Pacheco Filho, J. G. A.; Teixeira, L. S. G.; Microchem. J. 2006, 82, 201.
3. Oliveira, F. C. C.; Brandão, C. R. R.; Ramalho, H. F.; Costa, L. A. F.; Suarez, P. A. Z.; Rubim, J. C.; Anal. Chim. Acta 2007,
587, 194.
4. Soares, I. P.; Rezende, T. F.; Silva, R. C.; Castro, E. V. R.; Fortes, I. C. P.; Energy Fuels 2008, 22, 2079.
5. Corgozinho, C. N. C.; Pasa, V. M. D.; Brabeira , P. J. S.; Talanta
2008, 76, 479.
6. Mahamuni, N. N.; Adewuyi, Y. G.; Energy Fuels2009, 23, 3773.
7. Meira, M.; Quintella, C. M.; Ferrer, T. M.; Silva, H. R. G.; Guimarães, A. K.; Santos, M. A.; Costa Neto, P. R.; Pepe, I. M.;
Quim. Nova 2011, 34, 621.
8. Pontesa, M. J. C.; Pereira, C. F.; Pimentel, M. F.; Vasconcelos, F. V. C.; Silva, A. G. B.; Talanta 2011, 85, 2159.
9. Soares, I. P.; Rezende, T. F.; Pereira, R. C. C.; Santos, C. G.; Fortes, I. C. P.; J. Braz. Chem. Soc. 2011, 7, 1229.
10. Gaydou, V.; Kister, J.; Dupuy, N.; Chemom. Intell. Lab. Syst. 2011, 106, 190.
11. Vasconcelos, F. V. C.; Souza Jr., P. F. B.; Pimentel, M. F.; Pontes, M. J. C.; Pereira, C. F.; Anal. Chim. Acta 2012, 716, 101. 12. Monyem, A.; Van Gerpen, H.; Biomass Bioenerg. 2001,4, 317. 13. EN 14078: Liquid Petroleum Products - Determination of
Fatty Acid Methyl Ester (FAME) Content in Middle Distillates
- Infrared Spectrometry Method, European Committee for
Standardization, Brussels, 2009.
14. Agência Nacional de Petróleo, Gás natural e Biocombustível (ANP); Resolution No. 65, 9.12.2011 - DOU 12.12.2011. 15. Agência Nacional de Petróleo, Gás natural e Biocombustível
(ANP); Resolution No. 14, 11.5.2012 - DOU 18. 5.2012. 16. Codex Alimentarius Commission; Fats, Oils and Related
Products; Food and Agriculture Organization of the United
Nations/World Health Organization (FAO/WHO): Rome, 2011. 17. Hammond, E. G.; Johnson, L. A.; Su, C.; Wang, T.; White, P. J;
Soybean Oil, 5th ed.; John Wiley & Sons: New York, 2005.
18. Pereira, F. P.; Mora, I. C.; Romero, V.; Lavilla, I.; Bendicho, C.;
TrAC, Trends Anal. Chem. 2011, 30, 1637.
19. Véras, G.; Brito, A. L. B.; Silva, A. C.; Silva, P.; Costa, G. B.; Félix, L. C. N.; Fernandes, D. D. S.; Fontes, M. M.; Quim. Nova
2012, 35, 315.
20. Fernandes, D. D. S.; Gomes, A. A.; Costa, G. B.; Silva, G. W. B.; Véras, G.; Talanta 2011, 87, 30.
21. Kennard, R. W.; Stone, L. A.; Technometrics 1969, 11, 137. 22. Beebe, K. R.; Pell, R. J.; Seasholtz, M. B.; Chemometrics, a
23. Barker, M.; Rayens, W.; J. Chemom. 2003, 17, 166.
24. Almeida, M. R.; Correa, D. N.; Rocha, W. F. C.; Scafi, F. J. O.; Poppi, R. J.; Microchem. J. 2013, 109, 170.
25. Pontes, M. J. C.; Galvão, R. K. H.; Araújo, M. C. U.; Moreira, P. N. T.; Pessoa Neto, O. D.; José, G. E.; Saldanha, T. C. B.;
Chemom. Intell. Lab. Syst. 2005, 78, 11.
26. Soares, S. F. C.; Gomes, A. A.; Galvão Filho, A. R; Araújo, M. C. U.; Galvão, R. K. H.; TrAC, Trends Anal. Chem. 2013,
42, 84.
27. Massart, D. L.; Vandeginste, B. G. M.; Buydens, S. J.; Lewi, P. J.; Smeyers-Verbeke, J; Handbook of Chemometrics and Qualimetrics, Part A.; Elsevier: Amsterdam, 1998.
28. Lavine, B. K. In Comprehensive Chemometrics, vol. 3; Walczak, B.; Tauler, R.; Brown, S., eds.; Elsevier: Oxford, 2009. 29. Trindade, M. A. G.; Stradiotto, N. R.; Zanoni, M. V. B.; Quim.
Nova 2011, 34, 1683.
Submitted: May 24, 2013
Published online: November 1, 2013