w ww.e l s e v i e r . c o m / l o c a t e / b j p
Original
Article
Validated
high
performance
thin
layer
chromatography
method
for
the
quantification
of
bioactive
marker
compounds
in
Draksharishta,
an
ayurvedic
polyherbal
formulation
Divya
Pillai,
Nancy
Pandita
∗DepartmentofChemistry,SunandanDivatiaSchoolofScience,ShriVileParleKelavaniMandalNarseeMonjeeInstituteofManagementStudies,VileParle(West),Mumbai,India
a
r
t
i
c
l
e
i
n
f
o
Articlehistory:
Received14December2015 Accepted23March2016 Availableonline16June2016
Keywords:
Bioactivemarkercompounds Draksharishta
HPTLC
Methodvalidation
a
b
s
t
r
a
c
t
DraksharishtaisanayurvedicpolyherbalformulationwithDraksha(VitisviniferaL.,Vitaceae)aschief ingredientprescribed for digestive impairment, respiratory disorders and weakness. Theseherbal medicinescontainingbiologicallyactivecompoundsplayasignificantrole.Thereforeitisnecessary tocarryoutthechemicalstandardizationofbioactivemarkercompoundspresentinthepolyherbal ayurvedicformulationlikeDraksharishta.Theaimofthepresentworkwastodevelopandvalidatea HPTLCmethodfordeterminationofgallicacid,catechinandresveratrolincommerciallyavailable mar-ketedandin-housepreparedformulationsofDraksharishta.Thisisthefirstreportofquantificationof bioactivemarkercompoundresveratrolusingHPTLCinDraksharishta.Themethodemployedsilicagel precoatedthinlayerchromatographyplateswithF254asthestationaryphase.Therespectivemobile phaseswereusedtodeveloptheplateswhichseparatedbandsaccordingtothemarkercompound. CamagscannerVwasusedfordensitometricscanning.Further,themethodwasvalidatedaccording toInternationalConferenceofHarmonization(ICH)guidelines.TheRfvaluesofthethreemarker
com-poundsweremeasured.Correlationcoefficientswerecalculatedfromthestandardgraphoflinearity. Accuracy,precisionandrecoverywereallwithintherequiredlimits.ThedevelopedHPTLCmethodsfor bioactivemarkercompoundspresentinin-houseandmarketedformulationswerefoundtobesimple, accurate,preciseandrobust.
©2016SociedadeBrasileiradeFarmacognosia.PublishedbyElsevierEditoraLtda.Thisisanopen accessarticleundertheCCBY-NC-NDlicense(http://creativecommons.org/licenses/by-nc-nd/4.0/).
Introduction
Inthemodernpharmacologyanddrugdevelopmentthesingle chemicalentitywhichispresentisresponsibleforthemain ther-apeuticactivityofthedrugwhereasthepreparationsofAyurvedic formulationsare based ontwo principles: useof a single herb or useof more than one herb, which is known as polyherbal formulation.Inpolyherbalformulationsthecombiningeffectof differentmedicinalherbshelptoenhancethepotencyofthe formu-lationtermedas“polypharmacyorpolyherbalism”(Kumaretal., 2008;Parasuramanetal.,2014).Amarkerisachemicalcompound whichmayormaynotbetherapeuticallyactivewhilebiomarkers aretherapeuticallyactivecompoundspresentinmedicinalherbs (Bhutani,2000).Theseayurvedicpolyherbalformulationsisabig taskinvolvingqualitycontrolconsistencythatwillensurethe ther-apeuticactivityofthefinishedherbalproductsasclaimedbythe
∗ Correspondingauthor.
E-mail:[email protected](N.Pandita).
standardAyurvedicbooksandmanufactures.However,mostofthe conclusionsdrawnintheayurvedictextsarebasedontheancient knowledgeandclinicalobservations;theylackthemodern obser-vationsbyanalyticalmethodsduringpreparationofadrug(Garg andBhutani,2008).Hencethereisaneedforthedevelopmentof areliableprotocolforqualityassessmentoftheherbal/polyherbal productsbyusingmodernscientificanalyticaltools.
ThefruitsofVitisviniferaL.Vitaceae,arecommonlyknownas Draksha(raisins)intheIndiansub-continentandareusedin tradi-tionalayurvedicmedicinetotreatrespiratorydisorders,digestive disorders and generalweakness. Draksharishta is an ayurvedic polyherbalalcoholic formulationincludedintheAyurvedic For-mulary of Indiain which dried fruitsof V. vinifera is thechief ingredient.Draksharishtacontains5–10%ofself-generatedalcohol withthechemicalconstituentsandpropertiesofV.viniferawidely studiedandreported(APII,2000;TiwariandPatel,2012).V.vinifera
containslargeamountofphenoliccompoundssuchasresveratrol, catechins,epicatechin,quercetin,gallicacid,procyanidinsofwhich resveratrolis themajorconstituent (Baydaretal.,2004;Galgut etal.,2011).Thesecompoundshavebeenshowntohavevarious
http://dx.doi.org/10.1016/j.bjp.2016.03.015
pharmacological activities like antiviral, anti-inflammatory, antimicrobialandantioxidant,whichshowfavourableeffectson humanhealthsuchasloweringlowdensitylipoproteins,reduction ofheartdisease,cancer,digestiveandrespiratorydisorders and improvingtheimmunesystem(Frankeletal.,1993;Mayeretal., 1997;Teissedreetal.,1996).AHPTLCmethodhasbeendeveloped and reported for the quantitative determination of gallic acid andcatechinindraksharishta (Tiwarietal.,2013).The hyphen-ated techniques likeHigh Performance LiquidChromatography (HPLC), Liquid Chromatography–Mass Spectrometry (LC–MS), Gas Chromatography–Mass Spectrometry (GC–MS), and Capil-laryElectrophoresis(CE)havebeenusedforthedeterminationof resveratrol(Galgutetal.,2011).ThisisfirstreportofHPTLCmethod developmentanditsvalidationforthepresenceofresveratrolin Draksharishta.
In recent years, the reporting of various active ingredients (i.e. marker profiling) have shown to be a useful method for standardizationand quality controlof various herbalmaterials, especially when there is a lack of authentic standards for the identification of all active components present in these com-plexnaturalproducts(Liangaetal.,2004;Chenetal.,2006).For rawmaterials/herbalproducts,Thin-LayerChromatography(TLC) andHigh-performanceThin-LayerChromatography(HPTLC) has becomeanefficientanalytical toolfor theiranalysis.HPTLChas beenwidelyused forthe identityand qualityof thebotanicals because of its versatility, reliability, high-throughput and cost effectiveness(Diet al.,2003; Larsen etal., 2004).Furthermore, simultaneousanalysisofseveralcomponentsinapolyherbal for-mulation or herbal extracts becomes possible (Patravale et al., 2001;AbourashedandMossa,2004).
AccordingtotheICHguidelines(ICH,1996,2005)inourpresent studythevalidation parameters developed wereaccuracy, pre-cision, specificity and robustness for gallic acid, catechin and resveratrolinthethreebatchesofin-houseformulationsandtwo marketedformulationsofDraksharishta.
Experimental
Standardsandchemicals
Theanalyticalgradesoforganicsolventswereprocuredfrom MerckspecialitiesPvtLtd.(Mumbai).Gallicacid(≥99.5%purity) waspurchasedfromLobaChemie,catechin(>95%purity)was pur-chasedfromNaturalRemediesandresveratrol(≥99%purity)was purchasedfromSigma–Aldrich.
Plantmaterialsandformulations
TheherbsusedasingredientsinthepreparationDraksharishta wereprocuredfromAyurvedicPharmacyfromthelocalmarket (Mumbai).Itwasdepositedandauthenticatedunderthe supervi-sionofDr.A.S.UpadhyeatAgharkarResearchInstitute,Pune.The respectivevouchernumbersweregivenforeachherbasshown inTable1.Materialswerestoredinairtightcontainers.Thetwo marketedformulationofDraksharishtawerepurchasedfromthe AyurvedicPharmacy(Mumbai).
PreparationofDraksharishta
Thethree batchesof in-houseformulations ofDraksharishta werepreparedbythemethodasgiven inAyurvedic Formulary ofIndia,Part-I.Identificationofalltheindividualplantmaterial wasdoneasperAyurvedicPharmacopoeiaofIndia.Accordingto themethod given in thestandard book, thein-house formula-tionwaspreparedatlabscalelevel.Afterpropercrushing,48.9g driedfruitsofV.viniferawasplacedinbrassvesselandallowed
Table1
Authenticationof10herbspresentintheformulationDraksharishta.
Herbs Code Partused VoucherNo.
Vitisvinifera VV Fruit F-202
Cinnamomumzeylanicum CZ Stembark S/B-140
Callicarpamycrophylla CM Flower I/F-040
Woodfordiafructicosa WF Flower I/F-041
Pipernigrum PN Fruit F-200
Piperlongum PL Fruit F-203
Embeliaribes ER Fruit F-209
Mesuaferrea MF Stamens I/F-042
Cinnamomumtamala CT Leaves L-071
Elettariacardamomum EC Seed F-201
tosoakovernightin1000mlofwater.Thismaterialwasboiled untilthewaterwasreducedtoonefourth250ml(decoction)of theoriginal.Heatingwasstoppedatthispointanddecoctionwas filteredthroughmuslinclothinacleanvessel.Thiswasfollowed by adding 200gof jaggery and stirred properly until homoge-neoussolutionwasobtainedfollowingafinalfiltration.Then,to thisfiltrate8gofWoodfordiafructicosa(Dhatakiflowers)and1gof coarselypowderedprakshepadravyasincludingCinnamomum zey-leynicum(stembark),Eletteriacardamomum(seeds),Cinnamomum tamala (leaves), Mesua ferrea (stamens), Callicarpa macrophylla (flowers),Pipernigrum(fruits),Piperlongum(fruits),Embeliaribes (fruits) was added, stirred well and filtered again and this fil-teredfluidwasplacedforfermentation.Thefermentedpreparation wasthenfilteredwithmuslinclothandkeptincleanbottlesand labelled properly. Sampleswere prepared fromthese three in-housebatchesandthetwomarketedformulationsofdraksharishta forHPTLCanalysis.
Preparationoftestsample
Thethree in-houseandtwo marketedformulationsof 50ml each were dried on a water bath until the alcohol was com-pletelyremoved.Then50mlofwaterwasaddedtotheresidue leftbehind.Itwasthensubjectedtosuccessivesolventextraction, firstwithhexane(150ml)followed bychloroform(150ml)and ethylacetate(150ml).ForHPTLCanalysis,ethylacetatefraction ofthein-houseandtwomarketedformulationswasevaporated todrynessandreconstitutedwithmethanolasgiveninAyurvedic FormularyofIndia,Part-I.Theconcentrationsofthreein-houseand twomarketedformulationsobtainedwere86.5,92.5,90.5,100.5, 74.5mg/mlrespectively.Asampleof10mg/mlconcentrationwas preparedforallthein-housebatchesandmarketedformulations. 2.0lofeachformulationwereappliedonTLCplatesforHPTLC analysis.
Preparationofstocksolutionandworkingstandardsolutionof gallicacid,catechinandresveratrol
Acommonstocksolution(1mg/ml)ofgallicacid,catechinand resveratrolwaspreparedbydissolving10mgofeachinmethanol and making the volume of solution up to 10ml. The working standardsolutionof100g/mlwaspreparedforeachbydiluting 10timesthestocksolutionwithmethanol.Thealiquots(2–7ml of gallic acid),(3–8mlof catechin), (0.5–1ml resveratrol) were transferredto10mlvolumetricflasksanddilutedtovolumewith methanolandappliedonTLCplates.
HPTLCinstrumentation
TLCplateswithadimensionof20cm×10cmprecoatedwith 0.20mmlayersofsilicagel60F254(Merck,Darmstadt,Germany)
widebandsand11.3mmwasthedistancekeptbetweenthetwo bandsby useof sample applicator CamagLinomat V equipped withasyringeof100lcapacity.Aconstantapplicationrateof 150nLs−1wasused.CamagScannerVcontrolledbywinCATS
Pla-narChromatographymanagersoftwareversion1.4.6wasusedasa densitometricscanner.Theslitdimensionswere6×0.45mmand thescanningspeed20mm/s.Theradiationsourceusedwasa deu-teriumlampatawavelengthof254nmforgallicacidand280nm forcatechinand306nmforresveratrol.
Chromatographiccondition
The mobile phase selected was a mixture of toluene, ethyl acetateandformicacid(6:4:0.8,v/v)forgallicacid,toluene,ethyl acetateandformicacid(5:4:1,v/v)forcatechinandchloroform, ethylacetateandformicacid(5:4:1,v/v)forresveratrol.Plate devel-opmentwasdone in a Camag20cm×10cm glass twin-trough chamber. Before insertion of the plate,the chamber was satu-ratedwithmobilephase vapourfor5minatroomtemperature (25±2◦C),withthesolventfront(development distance)being
7cm.AftertheTLCplatesweredevelopedanddriedbyusingan airdryer,densitometryscanningwasperformedatawavelength of =254nmforgallicacid, =280nmforcatechinand =306nm forresveratrol.
Calibrationcurvesofgallicacid,catechinandresveratrol andtheiranalysisinformulations
Todeterminethelinearity,calibrationcurveswereplotted.A 10lofeachconcentrationrange(20–70g/ml)wasappliedon TLCplatestogetfinalconcentration200–700ng/spotforgallicacid, (30–80g/ml) 300–800ng/spot for catechin and (5–10g/ml) 50–100ng/spot for resveratrol. The densitometry scanning was performed for each standard and the presence of gallic acid, catechinandresveratrolpresentinthein-houseandmarketed for-mulationswerequantifiedbymeansofcalibrationplot.
Methodvalidation
Precision
Sixreplicatesofsameconcentrationofgallicacid(300ng/spot), catechin(300ng/spot)andresveratrol(60ng/spot)wereusedfor thedeterminationofinstrumentalprecisionandtherepeatability ofthemethodwasestimatedbycarryingoutintra-dayand inter-dayprecisionatthreedifferentconcentrationlevels200,400and 700ng/spotforgallicacid,300,500and800ng/spotforcatechin and50,70and100ng/spotforresveratrol.
Limitsofdetectionandquantification
Inordertoestimatethelimitofdetection(LOD)andlimitof quantification(LOQ),blankmethanolwasspottedsixtimesina similarwaytothatofthecalibrationcurveandthesignal-to-noise ratiowasdetermined.Thecalculationwasbasedonthestandard deviation(SD)oftheresponseandtheslope(S)ofthecalibration curve.TheLODwasconsideredas3:1(SD/S)andLOQas10:1(SD/S).
Accuracyandrecoverystudies
The accuracy of themethod was determined by calculating therecovery of gallic acid, catechin and resveratrolin mixture bystandard additionmethod.Tomeasure theaccuracy,known amountofstandardsolutionsofgallicacid,catechinand resver-atrolwerespikedto80,100and120%ofapre-quantifiedsample
solutionandthentheirresponse(peakarea)wasmeasuredand percentagerecoverywascalculated.Eachresponsewastakenas theaverageofthreedeterminations.
Robustness
Thecompositionofmobilephasewaschangedslightlyandthe effectsontheresultswereexamined.Toluene,ethylacetateand formic acid(6.5:4.5:0.8, v/v) forgallic acidwhiletoluene, ethyl acetateandformicacid(5.5:4.5:1,v/v)forcatechinandchloroform, ethylacetateandformicacid(5.5:4.5:1,v/v)forresveratrolwere selectedandthechromatogramsandrun.Theamountofmobile phase,temperatureanddurationofsaturationwerevariedatrange of+5%.TimefromspottingofallthethreestandardsonTLCplate tothedevelopmentoftheplateandthetimefromdevelopmentof platetoscanningwasvariedas10,20and30min.Robustnessof themethodwascheckedfollowingthesamethreedifferent con-centrationlevelsasmentionedinprecision.
Specificity
Thespecificityofthemethodwasascertainedbyanalysing ref-erencestandard,testsample,diluentandmobilephase.Thespotof theeachstandardinthesamplewasconfirmedbytheRfvaluesof
theseparatedbandswiththoseofthestandards.Thepeakpurityof gallicacid,catechinandresveratrolweremeasuredbycomparing thespectraatthreedifferentlevelsi.e.peakstart,peakapexand peakendofthespot.
Resultsanddiscussion
Optimizationofmobilephase
Asmobilephaseplaysaveryimportantroleinthe chromato-graphic method,the first step for development of a successful methodistooptimizethesolventsystemforgoodextraction effi-ciency.Methodthatgivesdenseandcompactspotswithsignificant valuesfordeterminationofgallicacid,catechinandresveratrolin formulationswasdeveloped.Tooptimizethemobilephase, differ-entratiosofToluene:ethylacetate:formicacidwasstudied.Use oftoluene,ethylacetateandformicacid(6:4:0.8,v/v)(Vadivelu andSaraswathy,2013)resultedinsharp,welldefinedgallicacid peaksofRf0.32±0.02whilesolventsystemtoluene,ethylacetate
andformicacid(5:4:1,v/v)(Dhalwaletal.,2008)resultedinsharp catechinpeaksofRf0.44±0.02andchloroform,ethylacetate,and
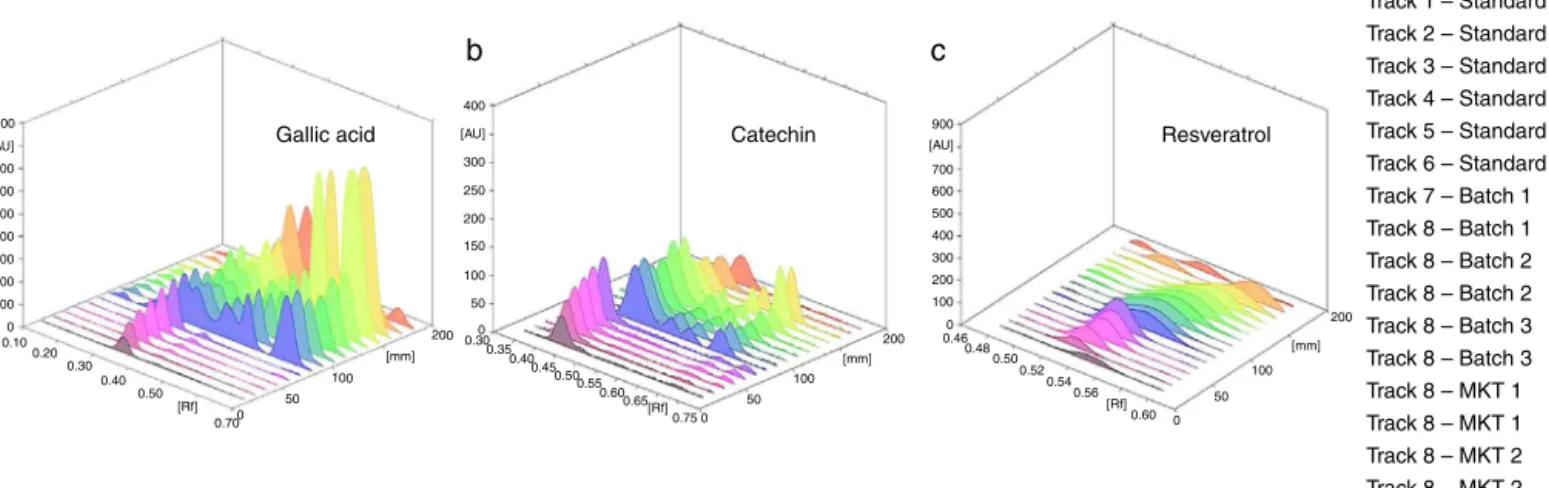
formicacid(5:4:1,v/v)(RolfsandKindl,1984)resultedinsharp, welldefinedresveratrolpeaksofRf0.58±0.02.Beforetheplate development, the chamber was pre-saturated withthe mobile phasefor5minatroomtemperature.ThethreedimensionalHPTLC overlayofgallicacid,catechinandresveratrolareshowninFig.1.
Calibrationcurvesofgallicacid,catechinandresveratrol andtheiranalysisinformulations
0 0.10 0.20 0.30 0.40 0.50 [Rf] 0.70
(a) Chromatogram of gallic acid Rf–0.32 (200–700 ng/spot); (b) Chromatogram of catechin Rf–0.44 (200–700 ng/spot); (c) Chromatogram of resveratrol Rf–.58 (50–100 ng/spot)
0 50 100 200 [mm] 100 200 300 400 500 600 700 900 400 900 700 600 500 400 300 200 100 0 0.46 0.48 0.50 0.52 0.54 0.56 0.60 0 50 100 [mm] 200 [Rf] 300 250 200 150 100 50 0 0.30 0.35 0.40 0.45 0.50 0.55 0.60 0.65 0.75 0 50 100 200 [mm] [Rf] [AU] [AU]
a
Gallic acid Catechin Resveratrol
Track 1 – Standard Track 2 – Standard Track 3 – Standard Track 4 – Standard Track 5 – Standard Track 6 – Standard Track 7 – Batch 1 Track 8 – Batch 1 Track 8 – Batch 2 Track 8 – Batch 2 Track 8 – Batch 3 Track 8 – Batch 3 Track 8 – MKT 1 Track 8 – MKT 1 Track 8 – MKT 2 Track 8 – MKT 2
b
c
[AU]
Fig.1. 3DoverlayofHPTLCchromatogramsofgallicacid,catechin,resveratrol,in-houseandmarketedformulations.
Table2
Methodvalidationparametersforthequantificationofgallicacid,catechinand resveratrol.
Methodproperty Gallicacid Catechin Resveratrol
Rf 0.32 0.44 0.58
Instrumentalprecision(RSD[%]n=6) 3.0 3.1 3.2 Intraassayprecision(RSD[%]n=6) 2.7 2.5 3.1 Intermediateprecision(RSD[%]n=6) 3.5 2.5 3.2 Correlationcoefficient,r 0.999 0.995 0.993 Calibrationrange[ng] 300–700 300–800 60–100
LOD 300 300 60
LOQ 900 900 180
Specificity Specific Specific Specific
Robustness Robust Robust Robust
demonstratingitssuitabilityforanalysisandalsoindicated adher-enceofthemethodtoBeer’slaw.Gallicacidwasfoundtobe1.767, 1.841,1.911,1.361,and1.595% whilecatechinwasfoundtobe 3.241,3.142,3.222,0.080,and0.049%,andresveratrolwasfoundto be0.541,0.537,0.538,0.086,and0.116%inin-houseformulation 1,23,andmarketed1and2formulations,respectively.
Precision
In order to control scanner parameters, that is, repeatabil-ity of measurement of peak area, instrumental precision was checkedbyrepeatedscanning(n=6)ofthesamespotofgallicacid
Table3
Intraandinter-dayprecisionofHPTLC(n=6).
Amount(ng/spot) Intra-dayprecision Inter-dayprecision
Meanarea SD %RSD Meanarea SD %RSD
Gallicacid
300 2294.2 1.16 0.051 2174.2 0.45 0.021
500 3598.5 1.03 0.028 3526.6 1.53 0.043
700 4267.7 1.32 0.031 4193.3 2.06 0.049
Catechin
300 1272.9 1.44 0.113 1228.5 1.33 0.108
500 2020.1 1.21 0.059 1983.2 1.12 0.056
800 2849.7 1.09 0.038 2786.4 1.48 0.053
Resveratrol
60 545.2 0.66 0.121 522.5 0.48 0.092
80 1397.9 1.10 0.078 1296.5 0.77 0.059
100 1960.6 1.25 0.063 1925.7 1.50 0.077
(300ng/spot),catechin(500ng/spot)andresveratrol(80ng/spot) andwereexpressedas%RSDandwasfoundtobelessthan3% asshowninTable2,ensuringrepeatabilityofdevelopedmethod aswellasproperfunctioningoftheHPTLCsystem.Theintra-day referstotheuseofanalyticalprocedurewithinalaboratoryovera shortperiodoftimeandinter-dayprecisioninvolvesestimationof variationsinanalysiswhenamethodisusedwithinalaboratoryon differentdays.TheresultsareshowninTable3.Themethodwas
6000
Gallic acid @ 254nm Y=462.3+6.256 x r=0.9991
Catechin @ 280nm Y=402.5+3.04 x r=0.9953
Resveratrol @ 306nm Y= –1454+34.43 x r=0.9926 4500 2500 2000 1500 1000 500 0 4000 3500 3000 2500 2000 1500 1000 500 0
0.00 200.00 400.00
Standard concentration (ng)
600.00 800.00 1000.00 1200 0.00 20.00 40.00 60.00 80.00 100.00 5000 4000 3000 2000 1000 Standard A UC 0
0.00100.00200.00300.00400.00500.00600.00700.00
a
b
c
Table4
Recoverystudyofgallicacid,catechinandresveratrol.
Compound Amountpresentinsample(g) Amountadded(g) Amountfound(g) Recovery(%) Averagerecovery(%)
Gallicacid 0.153 0.32 0.421 89.00
0.153 0.40 0.489 88.43 87.50
0.153 0.48 0.538 85.10
Batch2 Catechin 0.841 0.40 1.285 103.6
0.841 0.50 1.456 108.6 105.70
0.841 0.60 1.511 104.9
Resveratrol 0.047 0.08 0.111 87.26
0.047 0.10 0.126 85.80 87.00
0.047 0.12 0.146 87.90
Gallicacid 0.196 0.32 0.471 91.30
0.196 0.40 0.535 89.91 89.74
0.196 0.48 0.594 88.01
Mkf-1 Catechin 0.338 0.4 0.752 102.02
0.338 0.5 0.880 105.05 103.86
0.338 0.6 0.980 104.52
Resveratrol 0.029 0.08 0.087 80.38
0.029 0.10 0.111 86.17 85.33
0.029 0.12 0.133 89.44
foundtobeprecisebasedontheresultsobtainedintheintra-day andinter-dayprecisionevaluationstudy.
Limitofdetectionandquantification
Detectionandquantitationlimitswithsignal-to-noiseratiosof 3:1and10:1wereconsidered.Undertheexperimentalconditions employed,limitofdetectionisthelowestamountofanalytethat couldbedetectedwasfoundtobe300ng/spotforgallicacidand catechinand60ng/spotforresveratrolandlimitofquantification, thelowestamountofanalytethatcouldbequantifiedwasfound 900ng/spotforgallicacidandcatechinand180ng/spotfor resver-atrolasshowninTable1whichindicatestheadequatesensitivity ofthemethod.
Accuracyandrecoverystudies
Accuracyofananalyticalmethodistheclosenessoftestresults totruevalueanalyte (Patel etal., 2011).It was determinedby theapplicationof analytical proceduretorecoverystudies.The pre-analyzedin-housesampleofDraksharishtaanditsmarketed formulationwerespikedwith80,100and120%ofgallicacid, cat-echinandresveratrolstandardand themixtureswereanalyzed again,intriplicate,bytheproposedmethod,tochecktherecovery ofdifferentamountsofthesemarkercompounds.Average recov-eryforgallicacid,catechinandresveratrolwasfoundtobe87.50, 105.70and87%,respectivelyforin-housesampleand89.74,103.86 and85.33%,respectively,forthemarketedformulationof Drakshar-ishtaasdepictedinTable4.Thisshowstheaccuracyofthemethod inadesiredrange.
Robustness
Thestandarddeviationsofpeakareaswerecalculatedforeach parameterand%RSDwasfoundtobelessthan3%.Thelowvalues of%RSDobtainedafterintroducingsmalldeliberatechangesinthe developedHPTLCmethod,indicatedtherobustnessofthemethod. ThedevelopedHPTLCmethodremainedtobeunaffectedbythe smallbut deliberatevariationsin theexperimentalparameters, indicatingsuitabilityandreliabilityofthedevelopedmethod dur-ingnormaluse,therebyindicatingtherobustnessofthemethod.
Specificity
Specificity is the ability of an analytical method to assess unequivocally the analyte in the presence of sample matrix
analyte(Pateletal.,2011).Thepeakpuritywascalculatedasper regression(r2).Thevaluesforgallicacidwasr2
(start,middle)=0.9980 andr2
(middle,end)=0.9973,for catechinr2(start,middle)=0.9969and
r2
(middle,end)=0.9973andforresveratrolr2(start,middle)=0.9985and
r2
(middle,end)=0.9990. Chromatographic specificity was investi-gatedbycomparingtheRfvalueofstandardsandsamplesandit
wasfoundtobeidentical.Noimpuritiesordegradationproducts werefoundalongwiththepeaksofstandarddrugsolutions,hence makingthemethodspecific.
Conclusions
The identification and quantification of active ingredients in polyherbal ayurvedic formulations like asavas and arishtas canbeevaluatedbyuseofvalidatedanalyticalmethods.Anew HPTLC method has been developed for the identification and quantificationofgallicacid,catechinandresveratrolinin-house preparedandmarketedformulationsofdraksharishta.Lowcost, fasterspeed,andsatisfactoryprecisionandaccuracyarethemain featuresofthismethod.Themethodwassuccessfullyvalidatedas perICHguidelinesandstatisticalanalysisprovesthatthemethod issensitive, specific,repeatableandrobust.Thismethodcanbe conveniently employed for routine quality control analysis of all the three marker compounds for marketed formulations in Ayurvedic/Herbalindustry.
Author’scontribution
DP (PhD student) contributed in collecting plant sample, formulations, preparation of formulations, performing the lab-oratory work, i.e. chromatographic analysis and drafted the paper.NPdesignedthestudyandsupervisedtheoverallproject work.Authorshavereadthefinalmanuscriptand approvedthe submission.
Conflictsofinterest
Theauthorsdeclarenoconflictsofinterest.
Acknowledgements
References
Abourashed,E.A.,Mossa,J.S.,2004.HPTLCdeterminationofcaffeineinstimulant herbalproductsandpowerdrinks.J.Pharm.Biomed.Anal.36,617–620. API-I,2000.ControllerofPublication.GovernmentofIndia,MinistryofHealthand
FamilyWelfare,DepartmentofIndianSystemsofMedicineandHomeopathy, pp.15–16.
Baydar,N.G.,Ozkan,G.,Sagdic,O.,2004.Totalphenoliccontentsandantibacterial activitiesofgrape(VitisviniferaL.)extracts.FoodControl.15,335–339. Bhutani,K.K.,2000.FingerprintingofAyurvedicdrugs.East.Pharm.43,21–26. Chen,S.B.,Liu,H.P.,Tian,R.T.,Yang,D.J.,Chen,S.L.,Xu,H.X.,Chan,A.S.,Xie,P.S.,2006.
High-performancethin-layerchromatographicfingerprintsofisoflavonoidsfor distinguishingbetweenRadixPuerariaeLobateandRadixPuerariaeThomsonii.J. Chromatogr.A1121,114–119.
Dhalwal,K.,Shinde,V.M.,Biradar,Y.S.,Mahadik,K.R.,2008.Simultaneous quantifi-cationofbergenin,catechin,andgallicacidfromBergeniaciliataandBergenia ligulatabyusingthin-layerchromatography.J.FoodCompos.Anal.21,496–500. Di,X.,Chan,K.K.C.,Leung,H.W.,Huie,C.W.,2003.Fingerprintprofilingofacid hydrolyzatesofpolysaccharidesextractedfromthefruitingbodiesandsporesof Lingzhibyhighperformancethin-layerchromatography.J.Chromatogr.A1018, 85–95.
Frankel,E.N.,Kanner,J.,German,J.B.,Parks,E.,Kinsella,J.E.,1993.Inhibitionof oxi-dationofhumanlow-densitylipoproteinbyphenolicsubstancesinredwine. Lancet341,454–457.
Galgut,J.M.,Peter,J.,Ali,S.A.,2011.EstimationofresveratrolinArachishypogaea fruitskinextractsbyHigh-PerformanceThin-LayerChromatography.Biosci. Biotechnol.Res.Commun.4,33–36.
Garg,S.,Bhutani,K.K.,2008.Chromatographicanalysisofkutajarishta–anayurvedic polyherbalformulation.Phytochem.Anal.19,323–328.
ICH,1996.Q2B.Validationofanalyticalprocedure:methodology.In:International ConferenceonHarmonization,Geneva.
ICH,2005.Q2A.Validationofanalyticalprocedures:textandmethodology.In: Inter-nationalConferenceonHarmonization,Geneva.
Kumar,V.,Mukherjee,K.,Kumar,S.,Mal,M.,Mukherjee,P.K.,2008.Validationof HPTLCmethodfortheanalysisoftaraxerolinClitoriaternatea.Phytochem.Anal. 19,244–250.
Larsen,T.,Axelsen,J.,Ravn,H.W.J.,2004.Simplifiedandrapidmethodforextraction ofergosterolfromnaturalsamplesanddetectionwithquantitativeand semi-quantitativemethodsusingthin-layerchromatography.J.Chromatogr.A1026, 301–304.
Lianga,Y.Z.,Xieb,P.,Chanc,K.,2004.Qualitycontrolofherbalmedicines.J. Chro-matogr.B812,53–70.
Mayer,A.S.,Yi,O.S.,Person,D.A.,Waterhouse,D.L.,Frankel,E.N.,1997.Inhibitionof humanlow-densitylipoproteinoxidationinrelationtocompositionofphenolic antioxidantsingrapes(Vitisvinifera).J.Agric.FoodChem.45,1638–1643. Parasuraman,S.,Thing,G.S.,Dhanaraj,S.A.,2014.Polyherbalformulation:concept
ofayurveda.Pharmacogn.Rev.8,73–80.
Patel,R.B.,Patel,M.R.,Bhatt,K.K.,Patel,B.G.,2011.Developmentandvalidationof HPTLCmethodforestimationofcarbamazepineinformulationsandit’sinvitro releasestudy.Chromatogr.Res.Int.,http://dx.doi.org/10.4061/2011/684369. Patravale,V.B.,D’Souza,S.,Narkar,Y.,2001.HPTLCdeterminationofnimesulidefrom
pharmaceuticaldosageforms.J.Pharm.Biomed.Anal.25,685–688.
Rolfs,C.H.,Kindl,H.,1984.Stilbenesynthaseandchalconesynthase:two differ-entconstitutiveenzymesinculturedcellsofPiceaexcelsa.PlantPhysiol.75, 489–492.
Teissedre,P.L.,Frankel,E.N.,Waterhouse,A.L.,Peleg,H.,German,G.B.,1996. Inhibi-tionofinvitrohumanLDLoxidationbyphenolicantioxidantsfromgrapesand wines.J.Sci.FoodAgric.70,55–61.
Tiwari,P.,Sen,D.J.,Patel,R.K.,2013.DevelopmentandvalidationofHPTLCmethod forquantificationofgallicacidandcatechinfromDraksharishta.AsianJ.Res. Chem.6,248–253.
Tiwari,P., Patel,R.K.,2012.Validation ofHPTLCmethodforquantificationof quercetinandrutinindraksharishta.AsianJ.Pharm.Sci.Res.1,7–18. Vadivelu,L.,Saraswathy,A.,2013.Quantificationofpharmacologicallyactive