Article
Printed in Brazil - ©2016 Sociedade Brasileira de Química0103 - 5053 $6.00+0.00
*e-mail: [email protected]
Development, Optimization and Validation of an HPLC-PDA Method for
Quantification of Taxifolin in the Bark Extract of
Pinus pinaster
Priscila A. de Almeida,a Carla A. P. Bhering,a Michele C. Alves,a Marcone A. L. de Oliveira,b Nádia R. B. Raposo,a Anderson O. Ferreirac and Marcos A. F. Brandão*,a
aNúcleo de Pesquisa e Inovação em Ciências da Saúde (NUPICS) and
bGrupo de Química Analítica e Quimiometria (GQAQ), Universidade Federal de Juiz de Fora, 36036-900 Juiz de Fora-MG, Brazil
cLaboratório de Controle de Qualidade, Ortofarma, 36120-000 Matias Barbosa-MG, Brazil
The aqueous extract of the bark of Pinus pinaster has a high concentration of polyphenols
represented by a mixture of procyanidins, besides taxifolin, phenolic acids, cinnamic acids and their glycosides. Its quality control is specified in the United States Pharmacopeia, and the assay test is performed by determination of the total procyanidins content. However, determining the individual polyphenol content may represent an additional quality parameter for this extract. In this sense, the present study aimed to develop and optimize a method of high performance liquid chromatography with photodiode array detection (HPLC-PDA) for quantification of taxifolin in
the bark extract of P. pinaster, using a 33 Box-Behnken factorial design. The proposed method was
validated for specificity, linearity, limits of detection and quantification, precision, accuracy and robustness and it has shown that taxifolin may be used as a chemical marker for quality control of the bark extract of P. pinaster.
Keywords: analytical validation,high performance liquid chromatography, Pinus pinaster,
quality control, taxifolin
Introduction
Over the last decades, polyphenols have had an increasing interest on understanding vital functions of biological systems because they are important antioxidants of human diet.1 Due to the health significance of these
compounds, some analytical methods have been developed for their separation, identification and quantification in natural products.2-4 Polyphenols have a wide variability of
chemical structures, which differ in polarity and size, from simple phenolic compounds to oligomers. Additionally, they are found at low concentration levels in natural products.5 Therefore, sample pre-treatment is normally
required before instrumental analysis.6 Liquid-liquid
extraction (LLE) and solid phase extraction (SPE) are the sample pre-treatment techniques most frequently used. Among analytical techniques, high performance liquid chromatography (HPLC) and capillary electrophoresis (CE) are the main methods.7,8
P. pinaster Aiton, a pine commonly known as french
maritime pine and originally occurring in the Mediterranean region,9 has been investigated with regard to its chemical
constituents and biological effects.10 The aqueous extract
of the bark of P. pinaster has a high concentration of
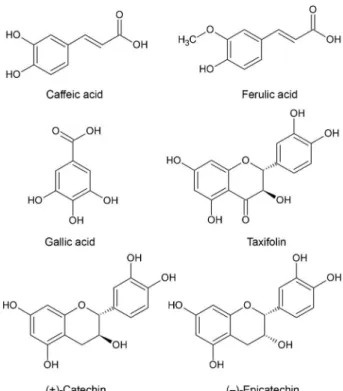
polyphenols represented by a mixture of procyanidins (comprising catechin and epicatechin subunits with varying chain lengths), besides phenolic acids (gallic, ferulic, caffeic and p-hydroxybenzoic acids), cinnamic acids and their
glycosides forms, and taxifolin (Figure 1).11,12 It is widely
used as a nutritional supplement and provides numerous health benefits due to its antioxidant, anti-inflammatory, and immuno-modulatory effects.13-15
The quality control for the bark extract of P. pinaster
is specified in the United States Pharmacopeia (USP) monograph in the chapter of dietary supplements.16
a method of spectrophotometry is described which provides an estimation of the total procyanidins content (65-75%) and it does not give quantitative measurement of individual polyphenol content. In this regard, taxifolin, a flavanonol also known as dihydroquercetin,17 can be a chemical marker
for quality control of the bark extract of P. pinaster, because
it is present in quantitatively detectable amount in the the extract when compared with other individual polyphenol contents.18 Furthermore, it is widely found in barks of
the species within the genus Pinus, so it is an important
flavanonol for this group.19,20
Within this context, the aim of this work was to develop, optimize and validate a method of HPLC with photodiode array detection (PDA) for quantification of taxifolin in the bark extract of P. pinaster. The method optimization was
investigated by a multivariate approach, taking into account a 33 Box-Behnken factorial design.
Experimental
Reagents, standards and sample
Acetonitrile (Panreac, Spain) and ethyl acetate (Merck, USA) were HPLC grade, and formic acid was analytical grade (Neon, Brazil). Ultrapure water obtained in an AquaMax-Ultra 370 Series (Young Lin, Korea) (18.2 MΩ cm resistivity at 25 °C and < 10 ppb total organic carbon) was used throughout analysis. The standards of gallic acid (purity: 102.38%), catechin (purity: 99.00%)
and taxifolin (purity: 87.40%) were purchased from Sigma (USA), and ferulic acid (purity: 102.00%) was from Henrifarma (Brazil). The pine bark extract (PBE) was obtained from USP (USA). The mobile phase was filtered through a 0.45 µm filter membrane (Sartorius, Germany) and degassed by an ultrasonic apparatus (Cristófoli, Brazil) for 30 min before use.
Sample preparation
The sample was prepared by LLE with ethyl acetate. The PBE (20 mg) was accurately weighed and transferred to a beaker in which 10 mL water/methanol (2:1, v/v) were added. The mixture was left in ultrasonic bath for 5 min. Then, the content of the beaker was poured into a separatory funnel of 100 mL and extracted with ethyl acetate (15 mL) by manual shaking for 1 min. After a 4 min rest period, the organic phase was separated from the aqueous phase. To the remaining aqueous phase, another portion of ethyl acetate was added (10 mL) and the procedure was repeated twice, making up three extractions. The combined organic phases were treated with 4 Å molecular sieves (3 g), and filtered to a round bottom flask through quantitative filter paper. The filtrate was concentrated to 1/15 of the initial volume by rotary evaporation under vacuum, transferred quantitatively to a 5 mL volumetric flask and made up to 5 mL with ethyl acetate. An aliquot of 3 mL was transferred to a 10 mL test tube and evaporated to dryness in a water bath at 50 °C. The residue was reconstituted in 2.6 mL acetonitrile, filtered in a 0.45 µm filter membrane and transferred to HPLC vials. Then, 20 µL were injected into the HPLC-PDA system.
Instrumentation
The HPLC analyses were performed using a qualified and calibrated Young Lin (Korea) chromatography system composed of: quaternary pump (YL 9110), photodiode array detector (YL 9160), automatic injector (YL 9150), column compartment (YL 9130) and software controller (Clarity). The HPLC-PDA method used was modeled in conformity with the method described in the USP monograph, according to the conditions available in our laboratory. Chromatographic separation was achieved using octadecylsilane (C18, 250 × 4.6 mm, 5 µm particle size) column (Agilent, Brazil) maintained at 40 °C and connected with a C18 pre-column (4.0 × 3.0 mm, 5 µm particle size) (Phenomenex, USA). The wavelength for UV detection was 288 nm. The initial HPLC gradient profile (mobile phase composition and flow rate) is shown in Table 1.
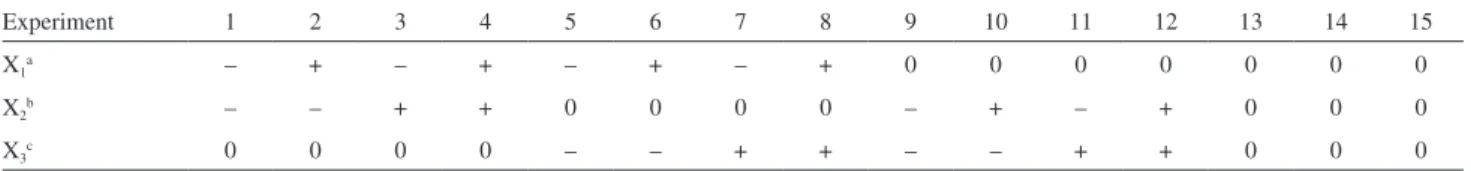
To optimize the chromatographic conditions, a 33 Box-Behnken factorial design triplicated at the central
point (15 runs) was performed for the screening of significant conditions that affected the separation of taxifolin.21 The
factors chosen for evaluation and their respective levels in the experimental design are summarized in Table 2.
Identification of the compounds
Solutions of gallic and ferulic acids, catechin and taxifolin were prepared in acetonitrile at 50 µg mL–1. PBE
samples (n = 3) were chromatographed and those peaks corresponding to commercially available standards were identified by UV spectra and spiking procedure.
Analytical validation
After method development and optimization, the validation tests were performed according to the International Conference on Harmonisation22 (ICH) and the
Brazilian National Institute of Metrology, Standardization and Industrial Quality23 (Inmetro) guidelines, comprising
the following parameters:
Specificity
The specificity of the method was determined through the comparison of standard, sample and blank chromatograms.
Linearity
The test was conducted from the plotting of three standard curves, each one constructed from five concentrations corresponding to 40, 45, 50, 55 and 60 µg mL–1 of taxifolin. The linear regression equation and
the determination coefficient (R2) were determined by least
squares method. After regression implementation, the data for each concentration level were statistically evaluated taking into account homoscedasticity (Cochran’s test), residues’ normality (Shapiro-Wilk’s test) and lack-of-fit into the model through an a priori test hypothesis (analysis
of variance (ANOVA)).
ANOVA test consists of comparing the deviations of the means between the calibration line (the residual standard deviation, syx) and the y values from their means (sy) by using
equation 1, where mi is the number of measurements, p is the
calibration point and m is the product between p and mi.24
(1)
The test is carried out by comparison between Fcalculated
and Fcritical; f1 = p – 2; f2 = m – p (Fcritical). If Fcalculated≥ Fcritical,
the linear model cannot be applied.
The taxifolin quantification was performed using the calibration curve from linearity of the standard.
Limits of detection and quantification
The limit of detection (LOD) and the limit of quantification (LOQ) were determined from three standard calibration curves and were calculated as shown in equations 2 and 3, respectively:
(2)
(3)
Table 1. Initial HPLC gradient profile (mobile phase composition and flow rate)
time / min
0 15 20 25 35 40 50
Solution Aa / % 94 88 88 88 80 94 94
Solution Bb / % 6 12 12 12 20 6 6
Mobile phase flow rate / (mL min–1) 1.0 1.2 1.2 1.0 1.0 1.0 1.0
a0.1% formic acid in ultrapure water; b0.1% formic acid in acetonitrile.
Table 2. Factors and levels utilized in the experimental design for chromatographic condition optimization
Experiment 1 2 3 4 5 6 7 8 9 10 11 12 13 14 15
X1a – + – + – + – + 0 0 0 0 0 0 0
X2b – – + + 0 0 0 0 – + – + 0 0 0
X3c 0 0 0 0 – – + + – – + + 0 0 0
aTemperature of the column oven [(–): 35 °C, (0): 40 °C, (+): 45 °C]; bmobile phase flow rate [(–): maintained at 1.0 mL min–1, (0): increased until
where a is the regression slope and S is the standard deviation of the y intercept.
Precision
The repeatability (intra-day precision) was determined by analyzing six replicates consecutively by a single analyst in a single day. The intermediate precision (inter-day precision) was evaluated in the same way, but with two analysts and two days. An injection precision of less than 5% relative standard deviation (RSD) was considered appropriate.
Accuracy
Accuracy represents the level of compliance between individual results obtained and a reference value.22 In this
current work, the accuracy of the method was established by recovery tests at three concentration levels (40, 50 and 60 µg mL–1) performed in triplicate. For this, aliquots of
174, 217 and 260 µL of the taxifolin standard solution (concentration = 1000 µg mL–1) were added before
extraction.
The results were expressed as percentage of recovery (R%), and equation 4, where Aa is the analyte area, AS is
the standard area and Aa+S is the analyte area with standard
addition, was used.25
R% = Aa+S – Aa / AS (4)
Robustness
The robustness parameter was evaluated by intentional minor modifications in the chromatographic conditions in the proposed method.26 Thus, a complete experimental
design with eight experiments (23) and triplicate in the
central point was conducted, in a total of 11 experiments performed in random order.27 The factors and their levels
were: (X1) temperature of the column oven [(–): 38 °C,
(0): 40 °C and (+): 42 °C]; (X2) mobile phase flow rate
[(–): maintained at 1.0 mL min–1, (0) increased until
1.2 mL min–1 and (+) increased until 1.4 mL min–1]; and
(X3) increase in the percentage of acetonitrile in mobile
phase [(–): until 18%, (0): until 20% and (+) until 22%]. To evaluate the significance of deliberate variations in each chosen factor, their effects were calculated. From the results of each experiment, the coefficients for determining the statistical model of prediction were calculated according to equation 5:
b = (XtX)–1 Xty (5)
where b is the matrix of model coefficients and X and y are the X matrix and y vector, respectively. To write the
equation of the fitted model, the standard errors of the coefficients were calculated using equation 6:
(6)
where ε(b) is the matrix whose main diagonal represents the standard errors of the model estimators (bi) and σ2
is the population variance of the experiments, which can be estimated as s2 using the center point replicates, from
equation 7:
(7)
Effects were calculated in matrix by the product Xty,
where y is a column vector containing the average results of the assay.
To estimate the standard error of an effect, the square root of the value obtained in equation 8 was used, and the standard error of the mean was estimated using the square root of the value obtained in equation 9:
(8)
(9)
With the estimated standard errors, it was possible to achieve confidence intervals for the values of effects, using Student’s t-distribution with 95% confidence, according to
equation 10:
(10)
where η is the true value of an effect (population value), represents the value obtained from the tests performed on the experiment, tv is the value from the Student’s
distribution, and Seffect is the standard error of an effect.
Results and Discussion
Optimization of the HPLC-PDA method
The selection of chemical markers is determinant for the quality control of herbal medicines,28 thus, in order to
in this elution order. However, low signal intensity was obtained for these substances in our laboratory by UV detection, and the chromatographic profile showed low signal-to-noise ratio for these peaks. Therefore, it was evidenced which sample pre-treatment would be required. As taxifolin showed the most intensive signal, it was defined as chemical marker for method development, thus, the sample preparation was performed in order to ensure the best conditions for its extraction. After liquid-liquid extraction, the concentration found for taxifolin was 1.10 ± 0.11% at 95% confidence interval.
Although taxifolin can be determined in natural products by several analytical techniques, HPLC-UV was established as the most convenient method for qualitative and quantitative analysis of phenolic compounds.29
Despite this, the complexity of PBE has sustained the development of HPLC methods with mass spectrometry (MS) detection such as the method proposed by Chen et al.18
for HPLC fingerprints analysis using the most prominent peak (taxifolin) as the reference peak. The MS detection, however, is expensive and requires more trained analysts, so a method for taxifolin determination was developed using UV detection, the most widespread detection in quality control laboratories.
PBE is a natural source of phenolic compounds. Thus, reverse chromatography with C18-stationary phases combined with binary elution systems containing an aqueous acidified solvent and an organic modifier solvent (methanol and acetonitrile, mainly) are used almost exclusively.7,29 In this study, acetonitrile was chosen because
taxifolin and ferulic acid were not separated using methanol in the preliminary investigations, besides the latter provided higher pressure values than acetonitrile. Additionally, it was necessary to acidify both solvents (aqueous and organic) with formic acid to minimize peak tailing.
Within this context, the mobile phase was initially established as two solvent systems: (i) 0.1% formic acid in
ultrapure water (A) and (ii) 0.1% formic acid in acetonitrile
(B). The initial HPLC gradient profile (mobile phase composition and flow rate) was established after screening tests. A gradient of mobile phase flow rate in the first 20 min was also realized in order to reduce analysis time. In this regard, a 33 Box-Behnken factorial design was performed
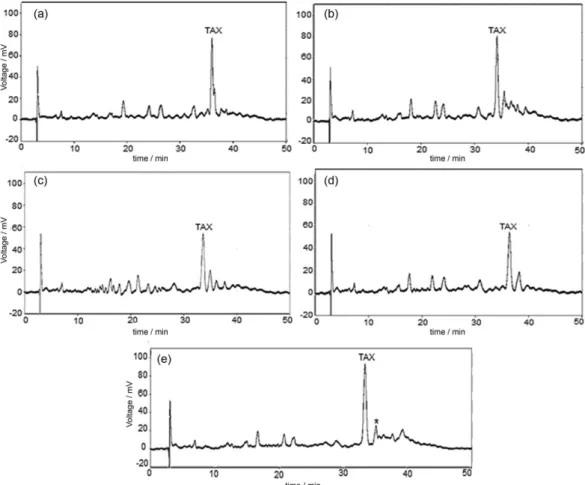
to optimize chromatographic conditions. Figure 2 shows the representative chromatograms obtained from factorial design.
The taxifolin response (Y) took into account the resolution of the critical pair and the baseline disturbances, common to the gradient elutions. Therefore, Y was defined as the ratio between the resolution (R) of the critical pair (value obtained between the taxifolin peak and the peak
indicated by an asterisk in Figure 2) and a constant (K; defined as 2 for the presence of baseline disturbances and 1 for the absence of baseline disturbances), according to equation 11:
Y = R / K (11)
where R was calculated using retention time (tR) and peak
width at baseline (twb) as following (equation 12):
R = [2(tR2 – tR1)] / (twb1 + twb2) (12)
Additionally, statistical analysis tools were used in order to identify significant effects. An independent factor has significant effect on a given response when it has a p-value
smaller than 0.05, considering a 95% confidence level. The results obtained for each run are listed in Table 3.
It was found that the temperature of the column oven (X1), and the increase of acetonitrile percentage in mobile
phase (X3) directly influence the taxifolin response since
they have p-values smaller than 0.05, and also all the
two-factor interactions with the exception of the interaction X2 × X2. The increase of the mobile phase flow rate in the
first 20 min did not affect taxifolin response (p-value higher
than 0.05), but it allowed the best analysis time obtained in this study (50 min). The conditions of the central point (experiments 13, 14 and 15) showed the highest response for taxifolin (Table 3) and very stable baseline. Therefore, these conditions were selected as optimal and they were used in the validation study.
Analytical validation
Using the optimized conditions, validation studies were performed. The specificity results are shown in Figure 3. As one can observe, the matrix did not interfere with the analysis of the compound of interest. Thus, it is possible to quantify taxifolin without interference, which was confirmed by UV spectra obtained for the taxifolin peak between 200 and 400 nm (Figure 4).
For linearity, calibration plots (x = µg mL–1, y = mV) of
taxifolin measured by the proposed method were constructed (n = 3 for each concentration). The least squares method obtained a determination coefficient greater than 0.99 (R2 = 0.9965), which indicates the existence of a significant
linear relationship between two variables. The regression model diagnosis was satisfactory with no lack-of-fit because the value of Fcalculated is lower than Fcritical in the 95%
confidence interval (Fcalculated = 0.65 < Fcritical(0.05) = 3.71).
interval. The normality in the residues (Shapiro-Wilk’s test) and homoscedasticity (Cochran’s test) were applied in order to verify if this model fits. Indeed, Shapiro-Wilk’s W value (Wcalculated = 0.91) was higher than the critical value
(Wcritical(0.05) = 0.88) and Cochran’s C value (Ccalculated = 0.58)
was lower than the critical value (Ccritical(0.05) = 0.68), which
indicates no violation of the assumptions, thus the ANOVA is considered valid. Therefore, the method is indeed linear, over its respective range.
The values obtained for LOD and LOQ were 6.52 and 21.70 µg mL–1, respectively. These values showed adequate
sensitivity for the analytical assay.
For precision, the RSD found were 3.46, 3.62 and 3.48% from intra-day, first day (n = 12); intra-day, second day (n = 12); and inter-days (n = 24), respectively. All RSD were within specification limits recommended (≤ 5%). For accuracy, the average recovery percentage of the standard added was calculated, and the value found was 98.23% (RSD = 1.36%), which indicates that this method has an acceptable accuracy and suitability to quantify taxifolin without interferences.
Figure 2. Representative chromatograms obtained from 33 Box-Behnken factorial design. (a) Trials 1, 6, 7, and 11 with similar chromatographic profiles;
(b) trials 2 and 9 with similar chromatographic profiles; (c) trials 3, 4, 10, and 12 with similar chromatographic profiles; (d) trials 5 and 8 with similar chromatographic profiles; (e) central point: trials 13, 14 and 15. Chromatographic conditions: C18 column (250 × 4.6 mm, 5 µm particle size), volume of injection of 20 µL, UV detection at 288 nm, and temperature of the column oven, mobile phase composition and flow rate according to conditions described by Box-Behnken factorial design. TAX: taxifolin; *: interference peak.
Table 3. 33 Box-Behnken design results for the method optimization
Experiment
Taxifolin response
(Y)
Factor Coefficient Error p-Value
1 0.00 mean 2.24 0.07 0.01b
2 2.10 X1 0.32 0.04 0.02b
3 0.82 X2 0.17 0.04 0.06
4 1.71 X3 –0.31 0.04 0.02b
5 1.79 X1 × X1 –0.79 0.07 0.01b
6 0.00 X2 × X2 –0.29 0.07 0.05
7 0.00 X3 × X3 –0.68 0.07 0.01b
8 1.32 X1 × X2 –0.30 0.06 0.04b
9 2.08 X1 × X3 0.78 0.06 0.01b
10 1.50 X2 × X3 0.53 0.06 0.01b
11 0.00 – – – –
12 1.54 – – – –
13 2.12a – – – –
14 2.38a – – – –
15 2.24a – – – –
aThe best results for taxifolin response; bstatistically significant effects
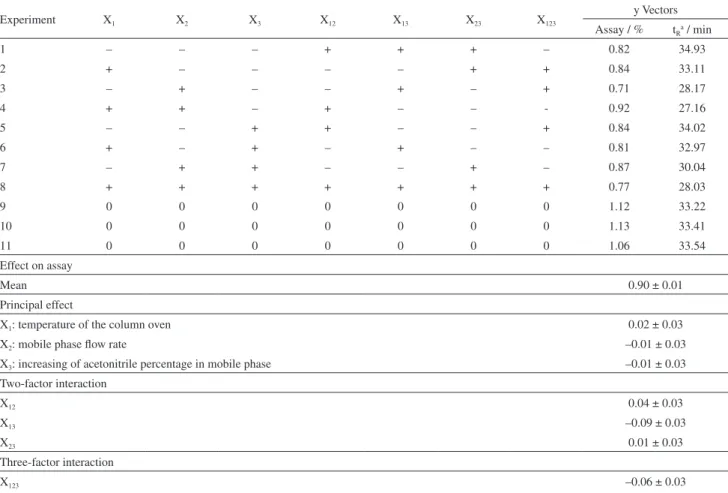
For robustness analysis, a 23 complete experimental
design with triplicate in the central point was realized. The calculated values for main effects and interactions in a 95% level of confidence are shown in Table 4. From the analysis of the results, it is possible to see that small
variations in these chromatographic parameters did not show significant changes in the overall assay values. Therefore, it is possible to conclude that the method is robust for the parameters analyzed within the intervals investigated.
Figure 3. Chromatographic profiles obtained in the specificity test. (a) Taxifolin standard; (b) sample; and (c) blank. Chromatographic conditions: C18
column (250 × 4.6 mm, 5 µm particle size) at 40 ºC, volume of injection of 20 µL, UV detection at 288 nm, and mobile phase composition and HPLC gradient profile according to Table 1. TAX: taxifolin.
Conclusions
Under the conditions described, the method for quantitative determination of taxifolin in the bark extract of
P. pinaster is in accordance with the validation parameters
required by the ICH and INMETRO guidelines. The method of HPLC-UV is available in quality control laboratories, and it is adequate for taxifolin quantification without matrix interferences. Therefore, the quantification of taxifolin may be an additional quality parameter for this extract in association with the spectrophotometric determination of the total procyanidins content. However, for this purpose, future investigations are necessary in order to establish limits for taxifolin content.
Acknowledgments
This work was supported by CAPES, CNPq, FAPEMIG and PROPESQ/UFJF. The authors would also like to thank Sharlene Loures for her help throughout the work.
References
1. Varoni, E. M.; Lodi, G.; Sardella, A.; Carrassi, A.; Iriti, M.;
Curr. Med. Chem.2012, 19, 1706.
2. Guillarme, D.; Casetta, C.; Bicchi, C.; Veuthey, J.-L.;
J. Chromatogr. A2010, 1217, 6882.
3. Hashim, S. N. N. S.; Schwarz, L. J.; Boysen, R. I.; Yang, Y.; Danylec, B.; Hearn, M. T. W.; J. Chromatogr. A2013, 1313, 284. 4. Moreno, M.; Arribas, A. S.; Bermejo, E.; Zapardiel, A.;
Chicharro, M.; Electrophoresis2011, 32, 877.
5. Motilva, M.-J.; Serra, A.; Macià, A.; J. Chromatogr. A2013, 1292, 66.
6. Rodríguez-Medina, I. C.; Segura-Carretero, A.; Fernández-Gutiérrez, A.; J. Chromatogr. A2009, 1216, 4736.
7. Liu, P.; Curr. Anal. Chem. 2013, 9, 424.
8. Nicolaou, I. N.; Kapnissi-Christodoulou, C. P.; Electrophoresis 2010, 31, 3895.
9. Pausas, J. G.; Blade, C.; Valdecantos, A.; Seva, J. P.; Fuentes, D.; Alloza, J. A.; Vilagrosa, A.; Bautista, S.; Cortina, J.; Vallejo, R.;
Plant Ecol. 2004, 171, 209.
Table 4. Factors, levels, and contrast coefficients matrix for the experimental design conducted to study robustness and the respective calculated effects
Experiment X1 X2 X3 X12 X13 X23 X123
y Vectors Assay / % tRa / min
1 – – – + + + – 0.82 34.93
2 + – – – – + + 0.84 33.11
3 – + – – + – + 0.71 28.17
4 + + – + – – - 0.92 27.16
5 – – + + – – + 0.84 34.02
6 + – + – + – – 0.81 32.97
7 – + + – – + – 0.87 30.04
8 + + + + + + + 0.77 28.03
9 0 0 0 0 0 0 0 1.12 33.22
10 0 0 0 0 0 0 0 1.13 33.41
11 0 0 0 0 0 0 0 1.06 33.54
Effect on assay
Mean 0.90 ± 0.01
Principal effect
X1: temperature of the column oven 0.02 ± 0.03
X2: mobile phase flow rate –0.01 ± 0.03
X3: increasing of acetonitrile percentage in mobile phase –0.01 ± 0.03
Two-factor interaction
X12 0.04 ± 0.03
X13 –0.09 ± 0.03
X23 0.01 ± 0.03
Three-factor interaction
X123 –0.06 ± 0.03
tv × Seffect / % 0.13
aRetention time. All experiments provided good factor capacity of the chromatographic column (≥ 1.0), symmetry of the analytical peak (≤ 2.0) and column
10. Maimoona, A.; Naeem, I.; Saddiqe, Z.; Jameel, K.;
J. Ethnopharmacol.2011, 133, 261.
11. D’Andrea, G.; Fitoterapia2010, 81, 724.
12. Virgili, F.; Pagana, G.; Bourne, L.; Rimbach, G.; Natella, F.; Rice-Evans, C.; Packer, L.; Free Radical Biol. Med.2000, 28, 1249.
13. Choi, Y. H.; Yan, G. H.; Phytother. Res.2009, 23, 1691. 14. Peng, Y. J.; Lee, C. H.; Wang, C. C.; Salter, D. M.; Lee, H. S.
Free Radical Biol. Med.2012, 52, 765.
15. Taner, G.; Aydin, S.; Bacahn, M.; Sarigol, Z.; Sahin, T.; Basaran, A. A.; Basaran, N.; Phytother. Res.2014, 28, 1692.
16. The United States Pharmacopeia (USP), 38th ed.; United Book Press: Baltimore, 2015.
17. Ma, C.; Yang, L.; Wang, W.; Yang, F.; Zhao, C.; Zu, Y.; Int. J. Mol. Sci.2012, 13, 8789.
18. Chen, P.; Song, F.; Lin, L.-Z.; J. AOAC Int. 2009, 92, 624.
19. Weidmann, A. E.; Eur. J. Pharmacol.2012, 684, 19.
20. Zu, S.; Yang, L.; Huang, J.; Ma, C.; Wang, W.; Zhao, C.; Zu, Y.;
Int. J. Mol. Sci.2012, 13, 8869.
21. Dutra, L. S.; Leite, M. N.; Brandão, M. A. F.; Almeida, P. A.; Vaz, F. A. S.; Oliveira, M. A. L.; Phytochem. Anal. 2013, 24, 513.
22. International Conference on Harmonization of Technical Requirements for Registration of Pharmaceuticals for Human Use (ICH): Guideline on Validation of Analytical Procedure Methodology Q2B(R1); ICH: London, 1995.
23. Instituto Nacional de Metrologia, Normalização e Qualidade Industrial (Inmetro). Orientações sobre Validação de Métodos de Ensaios Químicos,DOQ-CGCRE-008; Inmetro: Rio de Janeiro, 2003.
24. Danzer, K.; Currie, L. A.; Pure Appl. Chem. 1998, 70, 993. 25. Faria, A. F.; Souza, M. V. N.; Oliveira, M. A. L.; J. Braz. Chem.
Soc.2008, 19, 389.
26. Ribani, M.; Bottoli, C. B. G.; Collins, C. H.; Jardim, I. C. S. F.; Melo, L. F. C.; Quim. Nova2004, 27, 771.
27. Barros Neto, B.; Scarminio, I. S.; Bruns, R. E.; Como Fazer Experimentos: Pesquisa e Desenvolvimento na Ciência e na
Indústria, 4a ed.; Bookman: Porto Alegre, 2010.
28. Li, S.; Han, Q.; Qiao, C.; Song, J.; Cheng, C. L.; Xu, H.; Chin. Med.2008, 3, 1.
29. Regos, I.; Treutter, D.; J. Chromatogr. A2010, 1217, 6169.
Submitted: September 30, 2015