Introduction
Home advantage (HA) is a term coined to describe the consistent
inding that home teams win over 50% of the games played under a balanced home and away schedule in sport competi -tions1,2,3,4,5. This is a well-documented concept in a wide range
of team sports5,6,7 and, in football (soccer), it has been veriied
since the inaugural season of the England League in 18885,8,9,10.
The HA occurrence has been justiied by previous authors due to extrinsic and intrinsic factors. The extrinsic factors are game location11, weather12, crowd effects13,14,15, travel length3,13,15,16,17,
and referee bias14,15,17,18,19, whereas the intrinsic factors are irst
goal scored20, team quality11, coaches´ decisions21, familiarity22,23, technical factors24, speciic tactics11,24, injury time17, behaviour
of the players25, ball type23, and territoriality26.
Recently, examining 169,752 games of 157 national domestic football leagues throughout the world for six seasons between 2006 and 2012, Pollard and Gomez27, found HA varying from
86.82% (Nigéria) to 48.20% (Papua New Guinea). Similar results were reported in Europe, where HA of football leagues varies from 78.95% (Bosnia) to 48.87% (Andorra), whereas in South America HA varies from 74.16% (Bolivia) to 52.10% (Uruguay)9. The
HA of National Teams that played the 1998 World Cup (France) was also higher than 60% from 1987 to 199823. HA beyond 60% has been also reported during the group stage of the UEFA Champions League (UCL) and Copa Libertadores da América (CLA)28. However, the indings cited above considered only the
single-leg HA that ideally regard a balanced playing schedule in which each team plays each other team the same number of games at home and away. Therefore, there a lack of data about the second-leg HA concept which is relevant in all two-stage knockout competitions and occurs when, on average, teams are more likely to pass a two-matches knockout stage when playing the second-leg at home, i.e., even though both teams have an HA since they play one match at home, the advantage is greater for the team that plays the second match at home29.
To the best of our knowledge, only four studies have in
-vestigated the second-leg HA. However, they were based on European tournaments and present conlicting conclusions because second-leg HA varied from 61.8% (with second-leg HA) to 47.8% (no second-leg HA)20,29,30,31. These differences
may be explained due to the different mathematical models used to access second-leg HA. For example, Eugster, Gertheiss,
Kaiser30, using the naive analysis, found a probability of win
-ning in favour of the team having the return match at home (56%). However, using reined statistical data analysis – which considered the team coeficient proposed by the UEFA – the authors suggested no evidence for the second-leg HA30. Lidor,
Bar‐Eli, Arnon, Bar‐Eli31, using multiple χ2 analyses, also sug
-gested that teams which play the second game at home have a substantially higher chance of advancing to the next round than teams playing the irst game at home. On the other hand, using a regression model and discriminant analysis, García-Rubio, Gómez, Lago-Peñas, Ibáñez20 found no effect on the success Original Article (short paper)
Second-leg home advantage in the
Copa
Libertadores da América
(2005-2015)
Cesar Cavinato Cal Abad
Centro Universitário SENAC, Santo Amaro, SP, Brazil
Bruno Portella Terra
Maurício Donizete de Toledo Ananias Rafael Alves da Silva
Centro Universitário Anhanguera, Osasco, SP, Brazil
Marcio Alves Diniz
Universidade Federal de São Carlos, São Carlos, SP, Brazil
Abstract — Aims: To investigate the home advantage (HA) in the Copa Libertadores da América (CLA) from 2005 to
2015. Methods: A naive analysis was applied considering how many times a team that played the second leg at home
qualiied for the next round. To verify differences between home, away and draw results, the Chi-square (χ2) and the Full
Bayesian Signiicance Test were applied. For the binomial variables (“Home” or “Away”), the probability of second-leg knockout occurrence was calculated. Results: The probability of second-leg HA varied from 27.27% to 63.64%
suggesting luctuations of second-leg HA during competitive phases (round of 16, quarterinals, semi-inals and inal matches) and decision forms (full time, goals away rule or penalty-shoots). Conclusion: The results counteract the
common belief that there is a large advantage to playing the second match of a two-leg tie at home during all competition phases. Penalty-shots seemed to affect positively the second-leg HA. Despite the causes of second leg HA in CLA need to be better investigated, soccer coaches could to use these results to think better strategies to win your knockout matches.
of the team that played this match at home. Conlicting results were also found between García-Rubio, Gómez, Lago-Peñas, Ibáñez20 and Allen and Jones32, because whilst García-Rubio, Gómez, Lago-Peñas, Ibáñez20 found no effect on the success
of the team that played this match at home, Allen and Jones32 reported greater HA in low-ability teams (teams with lower table league positions) than in high-ability teams. In spite of the model proposed by Eugster, Gertheiss, Kaiser30 allow to
comprehend better the HA phenomena, this model cannot be applied in South America because the South American Football Confederation (CONMEBOL) has not a teams´ ranking to be included in the model. Therefore, simpliied analysis may help to comprehend the second-leg HA concept in South America which has been poorly explored in the literature.
The present study aimed to investigate the strength of the second-leg HA in the CLA, and to verify if the goals away rule and penalty shoot-outs affect the second-leg HA in the CLA. Our prior hypothesis was that second-leg HA occurs in the CLA, but would be reduced in advanced stages of the competition, because it was empirically expected that better teams would go forward in the competition and suffer lower than already eliminated teams from factors that affect HA (e.g. round of 16, quarterinal, semi-inal and inal matches). Finally, a variation on second-leg HA according to the goals away rule or penalty shoot-outs was also expected.
Methods
The present study has a descriptive and qualitative design. It was conducted in accordance to the ethical principles and the ethical approval was obtained from the local ethical committee (Centro Universitário Anhanguera/nº 1281/15).
Data set
Data were taken from the websites: soccerway.com, www. bolanaarea.com, www.conmebol.com, and www.ifa.com. The visual revision and assessment were performed blinded by two experienced and independent observers. The procedures were in accordance with previous reports29,30.
The database consists of CLA knockout matches played from 2005 to 2015, since before 2005 the goal away rule was not applied. To avoid bias of interpretations in the second-leg
HA phenomena, only the knockout matches were analysed. The second-leg HA was deined when the home team scored more goals than its opponent score and won the tie. Thus, the match was classiied as “HOME”. If the away team scored more goals than the home team, the result was “AWAY”. When the two-legged match ended tied, the result was “DRAW”. For draws, the away goal rule was considered. If, even considering the goals scored away the draw persisted, penalty shoot-outs were accounted. Thus, if the team who played the second match at home won during full-time, by goals away or by penalty shoot-outs, the result was classiied as “HOME”. If not, the result was considered as “AWAY”. Despite FIFA ranking, quality of
opponent, and several other factors that affect HA, they were not accounted in the present study due to the absence of precise information about these points by CONMEBOL that have not provide a ranking to qualify the teams. Therefore, the sugges
-tion of Eugster, Gertheiss, Kaiser30 that it is necessary to add the
pre-strengths of the teams as covariate could not to be applied.
Statistical analysis
Firstly, a naive analysis was conducted counting the number of times that the qualiied teams in each stage played the sec
-ond leg at home. Thereafter, the Chi-square (χ2) test was used
and, under the hypothesis of no HA, the expected number of matches won, drawn or lost by the home team would be equal. The statistical analyses were performed using SPSS software (version 17.0; SPSS, Inc., Chicago, IL) adopting signiicant level of 5%. Secondly, to provide a reliable alternative that avoids these pitfalls, we also reported the Full Bayesian Signiicance Test (FBST) E-value. This test gives evidence in favour of the
hypothesis – of uniformity, like the χ2 test – given the observed
data, and its results are not lawed if the sample size is small (for details see Pereira and Stern33). The FBST was performed using a simple program in R language (R Development Core Team, 2009 – http://www.ime.usp.br/~cpereira/programs/association.r).
Results
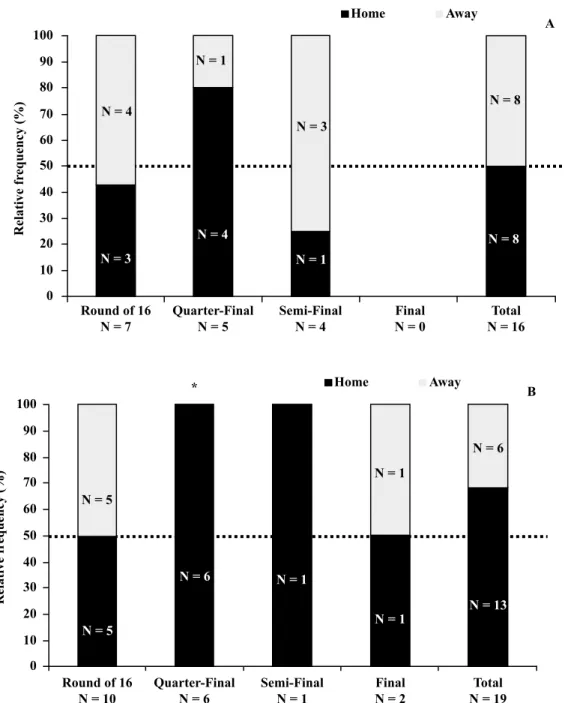
Overall, 326 ties were accounted. Figure 1 demonstrates the second HA results with the aggregate score. Table 1 (inal row) displays χ2-values, P-values and E-values of each stage, showing
that the no HA hypothesis can be rejected in all stages, except for the quarterinals.
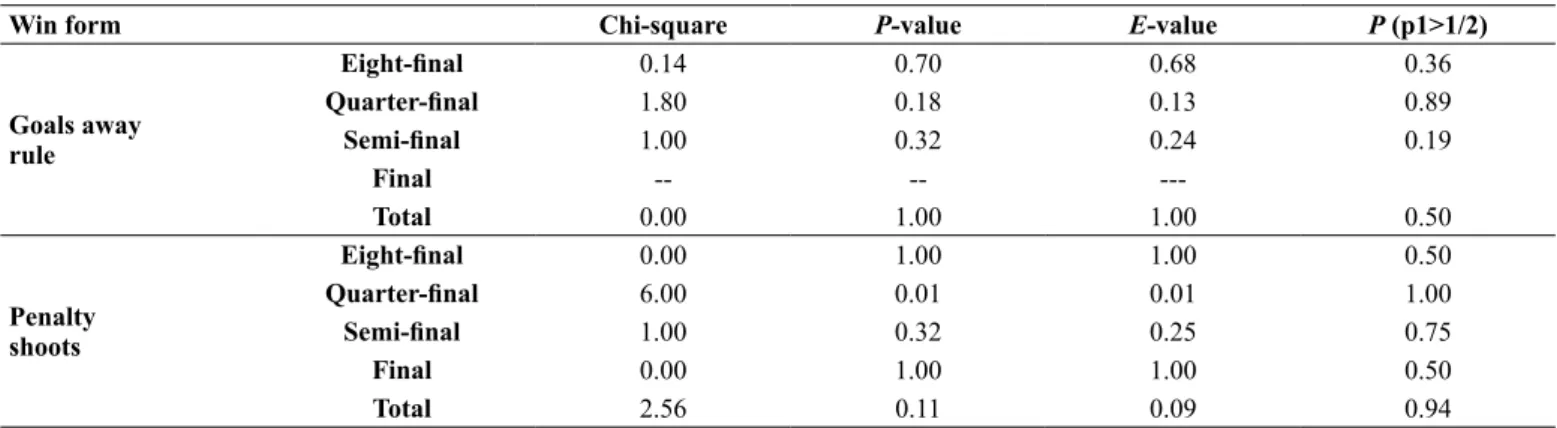
Figure 2 displays the number of times the qualifying team (black) or visiting team (grey) were at home when the tie was decided by the goals away rule (Panel A) or by penalty shoot-outs (Panel B). Table 2 shows the results of the χ2 test and the FBST
testing the homogeneity hypothesis, i.e., the probabilities that the home qualifying or the visiting team qualifying were equal and therefore, one-half. The inal column reports the posterior probability that p1 (probability that the home team qualiies) is larger than one. The prior distribution used for p1 was the uniform (beta (1,1)).
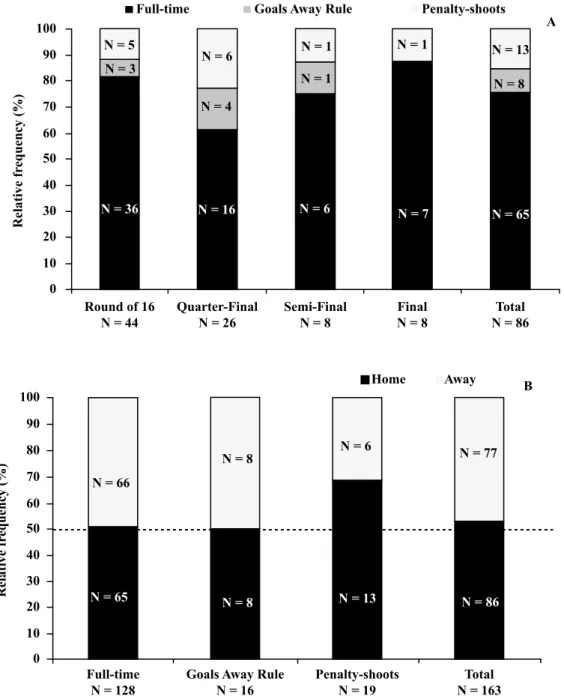
Figure 3 shows, for each stage, how the teams that played the second match at home qualiied (Panel A), and the number of times the home teams (black) and visiting teams (grey) in the second-leg qualiied. When the ties were decided after full-time dispute, the goals away rule and penalty shoot-outs were taking into account. Table 3 displays the χ2test P-value and the
FBST E-value concerning the uniformity hypothesis, p1=p2,
the second-leg. Even though this probability is considerably
larger than 0.5 for some stages, such as the quarterinals and inals, overall the numbers demonstrate a slight advantage for teams playing at home in the second-leg (0.527).
Table 1. Chi-square and Full Bayesian Signiicance Tests (P- and E-value, respectively) for comparison between the occurrences of home, draw or away results in the aggregate result (second-leg home advantage concept).
Chi-square P-value E-value
Aggregate Score
Eight-inal 7.28 0.03 0.02
Quarter-inal 1.41 0.50 0.46
Semi-inal 2.82 0.24 0.23
Final 4.55 0.10 0.08
Total 10.36 0.01 0.00
Round of 16 N = 86
Quarter-Final N = 44
Semi-Final N = 22
Final N = 11
Total N = 163 60
50
40 80 90 100
20
10
0 70
30
Relative fr
equency (%)
*
*
N = 36
N = 33
N = 17 N = 11
N = 17
N = 16
N = 6
N = 11
N = 5 N = 2
N = 2
N = 7
N = 65
N = 63 N = 35
Figure 1. Home (black box), draw (dark grey box) and away (light grey box) results in the second-leg home advantage concept concerning the aggregate inal result.
Table 2. Chi-square statistic (P-value), Full Bayesian Signiicance Tests (E-value), probability occurrence (p1<1/2) for the comparison between second-leg home advantage occurring due to the goals away rule or by penalty shoot-out decisions during each competitive phase.
Win form Chi-square P-value E-value P (p1>1/2)
Goals away rule
Eight-inal 0.14 0.70 0.68 0.36
Quarter-inal 1.80 0.18 0.13 0.89
Semi-inal 1.00 0.32 0.24 0.19
Final -- --
---Total 0.00 1.00 1.00 0.50
Penalty shoots
Eight-inal 0.00 1.00 1.00 0.50
Quarter-inal 6.00 0.01 0.01 1.00
Semi-inal 1.00 0.32 0.25 0.75
Final 0.00 1.00 1.00 0.50
Round of 16 N = 7
Quarter-Final N = 5
Semi-Final N = 4
Final N = 0
Total N = 16 100
90 80 70 60 50 40 30
0 10 20
Relative fr
equency (%)
Home Away
Home Away
A
B
Round of 16 N = 10
Quarter-Final N = 6
Semi-Final N = 1
Final N = 2
Total N = 19 100
90 80 70 60 50 40 30
0 10 20
Relative fr
equency (%)
N = 3
N = 4
N = 1
N = 4
N = 1
N = 3
N = 8
N = 8
N = 6
N = 13
N = 1
N = 1 N = 1
N = 6
N = 5
N = 5
*
Figure 2. The relative distribution of second-leg home advantage deined by the goals away rule (Panel A) or by penalty shoot-out decisions (Panel B) during each competitive phase.
Table 3. Chi-square statistic (P-value), Full Bayesian Signiicance Tests (E-value), probability occurrence (p1<1/2) and predictive value for comparisons between second-leg home advantages occurring according to all win forms (full-time, goals away rule and penalty-shoots) during the round of 16, quarterinal, semi-inal and inal, and all matches deined as binomial “HOME” or “AWAY” results according to all win forms (full-time, goals away, and penalties).
Chi-square P-value E-value P (p1>1/2) Predictive
Eight-inal 0.05 0.83 0.83 0.58 0.51
Quarter-inal 1.45 0.23 0.22 0.88 0.59
Semi-inal 1.64 0.21 0.18 0.11 0.37
Final 2.23 0.13 0.11 0.93 0.70
Total 0.50 0.48 0.48 0.76 0.53
Full-time 0.03 0.86 0.86 0.57
-Goals away 0.00 1.00 1.00 0.50
-Penalties 2.58 0.11 0.09 0.94
-Discussion
The present study investigated the second leg HA concept of the most important football tournament in South America, the Copa Libertadores da América, from 2005 to 2015. The inluence on the second-leg HA of the goals away rule and penalty shoot-outs was also investigated. Furthermore, the probability that teams that play the second match at home in a two-leg knockout match (second-leg HA) win the tie when disputing round of 16, quarterinals, semi-inals and inal phases was assessed by both naïve analysis (χ2) and the full Bayesian signiicance test (FBST).
The main indings were that: i) HA occurred in second-leg HA concept (52.76%) when direct wins, goals away rule and penalty
shoot-outs were considered together; ii) second-leg HA varied in accordance to the competition phase with semi-inals show
-ing the lowest second-leg HA (36.36%), and the inal phase the highest second-leg HA (72.73%); iii) the penalty-shots seemed to affect positively the second-leg HA.
The second-leg HA found in the present study was in ac
-cordance to other authors who investigated the second-leg HA in European tournaments. Page and Page29, for example,
investigated the second-leg HA effect in European Football Cup competitions (N=6084 two-leg knock-out rounds) and reported the probability of winning at the end of two legs for the second-leg home team of 54.98%29. In another study, Eugster,
Gertheiss, Kaiser30 found 56% of the probability of winning
30 40 50 60
0 10 20 100 90 80 70
Relative fr
equency (%)
30 40 50 60
0 10 20 100 90 80 70
Relative fr
equency (%)
Round of 16 N = 44
Full-time N = 128
Goals Away Rule N = 16
Penalty-shoots N = 19
Total N = 163 Quarter-Final
N = 26
Semi-Final N = 8
Final N = 8
Total N = 86
A
B Full-time Goals Away Rule Penalty-shoots
Home Away
N = 36
N = 3 N = 5
N = 6
N = 4
N = 16 N = 6
N = 1
N = 1 N = 1
N = 7 N = 65
N = 77
N = 86 N = 13
N = 6 N = 8
N = 8 N = 65
N = 66
N = 8 N = 13
Figure 3. Second-leg home advantage occurring through all win forms (full-time, goals away rule and penalty shoot-outs) during the round of 16, quarterinal, semi-inal, inal and total (Panel A), and the second-leg home advantage of all matches deined as binomial “HOME” or “AWAY”
in favour of the team having the return match at home in the UEFA Champions League. Despite the similarity found among the studies, it is important to note that comparisons between them require some caution because the calculations used to assess second-leg HA may inluence the HA interpretations. For instance, Lidor, Bar‐Eli, Arnon, Bar‐Eli31 used a multiple Chi-square analyses suggesting that teams which play the second game at home had a substantially higher chance of advancing to the next round than the teams playing the irst
game at home31. On the other hand, using a regression model and a discriminant analysis, García-Rubio, Gómez, Lago-Peñas, Ibáñez20 found no effect in the success of the team that plays this match at home20. Similarly, although the naive analysis
performed by Eugster, Gertheiss, Kaiser30 allows to ind a
probability of winning in favour of the team having the return match at home of 56%, by a reined statistical data analysis the authors suggested no evidence for the second-leg HA oc
-currence in the UEFA Champions League30. The authors argue
that the differences in frequencies of winning between teams irst playing away and those which are irst playing at home may be explained by their performances on the group stage and by the teams’ general strength. They also suggested that the draw is not completely random and a higher percentage of victories for the second-leg home team over the two legs could be a result of differences in teams’ ability. This could occur because in the round of 16 the effect of having the return match at home cannot be separated from the teams’ performances on the group stage. In fact, by the UEFA regulations, group winners automatically play runners-up and have the return match at home. Thus, since a group winner tends to be a stronger team than a second-place inisher, it can be assumed that it is more likely that a group winner reaches the next round. So, even if there was no effect of having the second-leg at home/away, counting only the number of ties where the team succeeds which is playing the return match at home would produce results in favour of those teams. It is important to emphasize that the reined statistical model used by Eugster, Gertheiss,
Kaiser30 was not possible to be applied in the present study
because, in opposite to the team coeficient proposed by the UEFA, the CLA does not have this team coeficient. Therefore, the reined statistics cannot be used in the present study. The CONMEBOL could create a South American ranking and future studies would compare the second-leg HA by reined statistical analysis between UEFA and CLA.
In opposite to our hypothesis that second-leg HA would to be reduced in advanced stages of the competition due to better teams go forward in the competition and suffer lower than worse eliminated teams from factors that affect HA, the results of CLA did not sustain this thought. Although the argue of Eugster, Gertheiss, Kaiser30 that “since a group winner tends to be a
stronger team than a second-place inisher it can be assumed that it is more likely that a group winner reaches the next round”, it seems incorrect for the CLA because observational data indicates that since 2005 - when CONMEBOL established the rule that the best team of the group phase would play the second game in your home – from the 11 teams that inish the group phase in irst, 4 (36.36%) were eliminated in the round of 16, 2 (18.18%)
in quarter-inals, 3 (27.27%) in semi-inals, only 2 (18.18%) going ahead until the inal phase, and only one (9.09%) won the CLA. Furthermore, from the 11 champions, 6 (54.55%) were the 8 worst teams during the group phases [Santos-BR 9º (2011); Estudiantes-ARG 10º (2009), Boca Juniors-ARG 11º (2007), LDU Quito-EQU 11º (2008), San Lorenzo 15º (2014), River Plate 16º (2015)] whereas the other 5 champions (46,45%) were the 8 better equips during the group phases [Atlético Mineiro 1st (2013), Internacional 2nd (2006), Corinthians 2nd (2012), São Paulo 5th (2005), and Internacional 6th (2010)]. Although it was expected that the HA should reduce during each advanced phase of the competition, this behavior seems to occur only in UEFA Champions League but not in CLA. Probably, differences in cultural aspects, people education, distance travel, territorial
-ity, and crowd effect can justify these variances in HA between Europe and South America.
The higher second-leg HA found in penalty-shot than full-time or goals away rule decisions in the present study was curious because it is well established that team history (previous win or lose)35; uniform colour36; fatigue overcoming
after the match37; players selection38; temporal preparation for
the penalty kick39; pre-penalty kick gaze 36; body language40;
nonverbal behaviour of the player41; run-up direction38; skill of the player42; anticipatory taker and goalkeeper movements43, public appraisal39, and emotional contagion40 may affect the
penalty shoot-out performance. Therefore, it was expected that these aforementioned aspects could impair penalty shoot-out performance for both home and away teams. However, our results suggest that home teams seem to have additional advantage to decide the inal decision by penalty shoot-out in their home, whereas away teams showed lower success than
home teams.
Despite the originality of the present study to investigate the second-leg HA in CLA, this area remains open to several investigations and has become an interesting research topic for soccer science, especially in South America.
Conclusion
Summarizing, overall second-leg HA found in the present study showed a light evidence for second-leg HA with semi-inals bringing the lower second-leg HA, whereas the inal phase brings the highest. Penalty shots seemed to affect positively the second-leg HA in comparison to wins occurred during full-time or by goals away rule. Our results contradict the common belief that there is a higher advantage to play the second match of a two-leg tie at home in all competition phases. Opposite to this belief, our results suggest that a good performance in the group phases is not always related to success in the competi
-tion, nor does it mean an easier route to the inal. In practical terms, soccer coaches and managers need to think of strategies to maintain soccer players´ concentration, motivation and at
References
1. Carron AV, Loughhead TM, Bray SR. The home advantage in sport competitions: Courneya and Carron’s (1992) conceptual framework a decade later. J Sports Sci, 2005; 23(4): 395-407. 2. Courneya K, Carron A. The Home Advantage in Sport
Competitions: A Literature Review. J Sport Ex Psychol, 1992; 14(1):13-27.
3. Courneya KS, Carron AV. Effects of travel and length of home stand/road trip on the home advantage. J Sport Ex Psychol, 1991; 13(1):42-9.
4. Nevill AM, Holder RL. Home advantage in sport: an overview of studies on the advantage of playing at home. Sport Med, 1999; 28(4):221-36.
5. Pollard R, Pollard G. Long-term trends in home advantage in professional team sports in North America and England (1876-2003). J Sports Sci, 2005; 23(4):337-50.
6. Gomez MA, Pollard R, Luis-Pascual JC. Comparison of the home advantage in nine different professional team sports in Spain. Percept Mot Skills, 2011; 113(1):150-6.
7. Goumas C. Modelling home advantage in sport: A new approach. Int J Perf Anal Sport, 2013; 13(2):428-39.
8. Nevill AM, Newell SM, Gale S. Factors associated with home advantage in English and Scottish soccer matches. J Sports Sci, 1996; 14(2):181-6.
9. Pollard R. Worldwide regional variations in home advantage in association football. J Sports Sci, 2006; 24(3):231-40.
10. Pollard R, Gómez MA. Home advantage in football in South-West Europe: Long-term trends, regional variation, and team differ -ences. Eur J Sport Sci, 2009; 9(6):341-52.
11. Lago-Penas C, Lago-Ballesteros J. Game location and team qual -ity effects on performance proiles in professional soccer. J Sports Sci Med, 2011; 10(3):465-71.
12. Brocherie F, Girard O, Farooq A, Millet GP. Inluence of weather, rank, and home advantage on football outcomes in the gulf region. Med Sci Sports Exerc, 2015; 47(2): 401-10.
13. Goumas C. Home advantage in Australian soccer. J Sci Med Sport, 2014; 17(1):119-23.
14. Johnston R. On referee bias, crowd size, and home advantage in the English soccer Premiership. J Sports Sci, 2008; 26(6):563-68. 15. Unkelbach C, Memmert D. Crowd noise as a cue in referee deci -sions contributes to the home advantage. J Sport Exerc Psychol, 2010; 32(4):483-98.
16. Pollard R, Silva CD, Medeiros NC. Home advantage in football in Brazil: differences between teams and the effects of distance traveled. Braz J Soccer Sci, 2008; 1(1):3-10.
17. Riedl D, Strauss B, Heuer A, Rubner O. Finale furioso: referee-biased injury times and their effects on home advantage in football. J Sports Sci, 2015; 33(4):327-36.
18. Boyko RH, Boyko AR, Boyko, MG. Referee bias contributes to home advantage in English Premiership football. J Sports Sci, 2007; 25(11): 1185-94.
19. Gomez MA, Pollard R. Calculating the home advantage in soccer leagues. J Hum Kinet, 2014; 40(1):5-6.
20. García-Rubio J, Gómez MA, Lago-Peñas, Ibáñez SJ. Effect of match venue, scoring irst and quality of opposition on match
outcome in the UEFA Champions League. Int J Perf Anal Sport, 2015(2); 15:527-39.
21. Staufenbiel K, Lobinger B, Strauss B. Home advantage in soc -cer - A matter of expectations, goal setting and tactical decisions of coaches? J Sports Sci, 2015; 33(18):1932-41.
22. Brown TD, Van Raalte JL, Brewer BW, Winter CR, Cornelius AA. World cup soccer home advantage. J Sport Beh, 2002; 25(2): 134-44.
23. Dosseville FE. Inluence of ball type on home advantage in French professional soccer. Percept Mot Skills, 2007; 104(2):347-51. 24. Armatas V, Pollard R. Home advantage in Greek football. Eur J
Sport Sci, 2014; 14(2):116-22.
25. Thomas S, Reeves C, Smith A. English soccer teams’aggressive behavior when playing away from home . Percept Mot Skills, 2006;102(2):317-20.
26. Neave N, Wolfson S Testosterone, territoriality, and the ‘home advantage’. Physiol. Behav, 2003; 78(2):269-75.
27. Pollard R, Gómez MA. Components of home advantage in 157 national football leagues worldwide. Int J Sport Exerc Psychol, 2014; 12(3):218-33.
28. Drummond LR, Drummond FR, Silva CD. A vantagem em casa no futebol: comparação entre Copa Libertadores da América e UEFA Champions League [The home advantage in soccer: comparision between Libertadores of American Cup and UEFA Champions League]. Rev Bras Ed Fís Esp, 2014; 28(2): 283-92.
29. Page L, Page K. The second leg home advantage: evidence from European football cup competitions. J Sports Sci, 2007; 25(14):1547-56.
30. Eugster MJA, Gertheiss J, Kaiser S. Having the Second Leg at Home - Advantage in the UEFA Champions League Knockout Phase? J Quant Anal Sports, 2011; 7(1):1-9.
31. Lidor R, BarEli M, Arnon M, BarEli AA. On the advantage of playing the second game at home in the knock out stages of European soccer cup competitions. Int J Sport Exerc Psychol, 2010; 8(3):312-25.
32. Allen MS, Jones MV. The home advantage over the irst 20 seasons of the English Premier League: Effects of shirt colour, team ability and time trends. Int J Sport Exerc Psychol, 2014; 12(1):10-8.
33. Pereira CAB, Stern JM. Evidence and credibility: full Bayesian significance test for precise hypotheses. Entropy, 1999; 1(4):99-110.
34. Memmert D, Huttermann S, Hagemann N, Lofing F, Strauss B. Dueling in the penalty box: evidence-based recommendations on how shooters and goalkeepers can win penalty shootouts in soccer. Int Rev Sport Exerc Psychol, 2013; 6(2):209-29.
35. Jordet G, Hartman E, Jelle Vuijk P. Team history and choking under pressure in major soccer penalty shootouts. Br J Psychol, 2012; 103(2), 268-283.
36. Greenlees I, Leyland A, Thelwell R, Filby W. Soccer penalty takers’ uniform colour and pre-penalty kick gaze affect the im -pressions formed of them by opposing goalkeepers. J Sports Sci, 2008; 26(6), 569-576.
38. McGarry T, Franks IM. On winning the penalty shoot-out in soc -cer. J Sports Sci, 2000; 18(6), 401-409.
39. Jordet G, Hartman E, Sigmundstad E. Temporal links to perform -ing under pressure in international soccer penalty shootouts. Psychol Sport Exerc, 2009; 10(6), 621-627.
40. Moll T, Jordet G, Pepping GJ. Emotional contagion in soccer penalty shootouts: Celebration of individual success is associated with ultimate team success. J Sports Sci, 2010; 28(9), 983-992. 41. Furley P, Dicks M, Memmert D. Nonverbal behavior in soccer:
The inluence of dominant and submissive body language on the impression formation and expectancy of success of soccer players. J Sport Exerc Psychol, 2012; 34(1), 61-82.
42. Baumann F, Friehe T, Wedow M. General ability and specializa -tion: evidence from penalty kicks in soccer. J Sport Econ, 2011; 12(1), 81-105.
43. Smeeton NJ, Williams AM. The role of movement exaggeration in the anticipation of deceptive soccer penalty kicks. Br J Psychol, 2012; 103(4), 539-555.
Corresponding author
Cesar C. C. Abad
SENAC, Department of Physical Education, Centro Universitário SENAC, Ave
-nida Engenheiro Eusébio Stevaux, 823, Santo Amaro, CEP: 04696-000, São Paulo/ SP, Brazil.
Email: [email protected]
Manuscript received on February 24, 2017 Manuscript accepted on June 13, 2017