Jacob Rosenblit, Cláudia Regina Abreu, Leonel Nulman Szterling, José Mauro Kutner, Nelson Hamerschlak, Paula Frutuoso, Thelma Regina Silva Stracieri de Paiva, Orlando da Costa Ferreira Júnior
Evaluation of Thre e Me thods for He moglobin
Me asure me nt in a Blood Donor Se tting
Hemotherapy Service, Hospital Israelita Albert Einstein, São Paulo, Brazil
INTRODUCTION
The hemo g lo bin (Hb) level is the mo st-used pa ra meter fo r sc reening b lo o d do no rs fo r the presence o f anemia. This measurement is usually perfo rmed during the c linic a l-epidemio lo g ic a l interview tha t prec edes b lo o d do na tio n.
Presently, o ne o f the mo st-used metho ds fo r measuring Hb levels is based o n pho to metric detection of cyanmetahemoglobin, which is a stable co mpo und derived fro m Hb. In additio n, readyto -use reag ents, as well as cyanmetahemo g lo bin standard so lutio n fo r calibratio n, are co mmercially available.
A s a n a lte rna tive to this te c hno lo g y, Hemo Cue has develo ped a pho to metric metho d b a se d o n the d e te rmina tio n o f a z id e me ta he mo g lo b in,1 sta nd a rd iz e d a g a inst the Interna tio na l Co mmittee fo r Sta nda rdiz a tio n in He ma to lo g y (IC SH) me tho d .2 The a z id e meta hemo g lo b in is mea sured a t 5 7 0 nm. To c o mpensa te fo r turb idity, e.g . due to lipids, a sec o nd mea surement is ta ken a t 8 8 0 nm.3 The a dva nta g e o f this tec hno lo g y is tha t it is simple, ra p id a nd d o e s no t re q uire so p histic a te d he ma to lo g ic a l e q uip me nt. The sy ste m is desig ned to use c a pilla ry, veno us o r a rteria l blo o d. Also , the instrument is small and po rtable
ABSTRACT
Contex t: The hemo g lo b in (Hb ) level is the mo st-used pa ra meter fo r sc reening b lo o d do no rs fo r the presenc e o f a nemia, o ne o f the mo st-used metho ds fo r measuring Hb levels is based o n pho to metric detectio n o f
cyanmetahemo glo bin, as a n a lterna tive to this tec hno lo g y, Hemo Cue ha s develo ped a pho to metric metho d b a sed o n the determina tio n o f a z ide meta hemo g lo b in.
O bjective: To evaluate the perfo rmance o f three metho ds fo r hemo g lo bin (Hb) determinatio n in a blo o d bank setting .
Design: Pro spective study utiliz ing blo o d samples to co mpare metho ds fo r Hb determinatio n.
Setting: Hemo therapy Service o f the Ho spital Israelita Albert Einstein, a private institutio n in the tertiary health care system.
Sa m ple: Serial blo o d samples were co llected fro m 2 5 9 individuals during the perio d fro m March to June 1 9 9 6 .
M a in M ea surem ents: Test perfo rmances and their co mpariso ns were assessed by the analysis o f co efficients o f variatio n (CV), linear reg ressio n and mean differences.
Results: The CV fo r the three metho ds were: Co ulter 0 .6 8 %, Co bas 0 .8 2 % and Hemo Cue 0 .6 9 %. There was no difference between the mean Hb determinatio n fo r the three metho ds (p>0 .0 5 ). The Co ulter and Co bas metho ds sho wed the best ag reement and the Hemo Cue metho d g ave a lo wer Hb determinatio n when co mpared to bo th the Co ulter and Co bas metho ds. Ho wever, pairs o f metho ds invo lving the Hemo Cue seem to have narro wer limits o f ag reement (± 0 .7 8 and ± 1 .0 2 ) than the Co ulter and Co bas co mbinatio n (± 1 .1 3 ).
Conclusion: The three metho ds pro vide g o o d ag reement fo r hemo g lo bin determinatio n.
Key w ords: Hemo g lo bin. Metho ds. Q uantificatio n. Equipment.
whic h a llo ws its use in mo b ile b lo o d c o llec tio n units a nd physic ia ns’ o ffic es.
Severa l studies perfo rmed o n Americ a n b lo o d d o no rs ha ve a tte ste d to the g o o d repro duc ib ility a nd a c c ura c y o f the Hemo Cue metho d.4 ,5 Ho wever, c o mpa ra b ility o f the Hb level mea sured via the Hemo Cue metho d with o ther, mo re rec ently a va ila b le hema to lo g ic a l eq uipment ha s no t b een perfo rmed.
In this study we reviewed the perfo rma nce o f the Hemo Cue system in c o mpa riso n with the C o ulte r a nd C o b a s me tho d s. Bo th o f the se me tho d s a re b a se d o n the d e te c tio n o f c ya nmeta hemo g lo b in.
METHODS
Sa mple Selec tio n. A to ta l o f 2 5 9 b lo o d sa mples were c o llec ted during the perio d fro m Ma rc h to June 1 9 9 6 . Blo o d wa s c o llec ted with the Va c uta ine r syste m, c o nta ining EDTA -K3
(Bec to n-Dic kinso n) to a to ta l vo lume o f 4 .5 ml. He mo g lo b in Le ve ls. A ll sa mp le s w e re evaluated by three metho ds: (a) Co ulter STKS (C o ulte r C o rpo ra tio n, Hia le a h, FL, USA), (b ) Co bas Micro s O T, 1 6 (Ro che Diag no stic System, Mo ntpe llie r, Fra nc e ) a nd (c ) He mo C ue , Inc ., Missio n Viejo , CA, USA).
Hb Measurements. Fo r the 2 5 9 samples were perfo rmed by the three metho ds within an inte rva l o f 1 0 -2 0 minute s to a vo id va ria tio n during pro c essing a nd mea surement. Fo r the repro ducibility analysis o f the Hb measurements, we used a sing le sample that was evaluated 1 0 time s b y e a c h me tho d . Ba se d o n the se determinatio ns we calculated the co efficient o f variatio n (CV) defined as the ratio between the standard deviatio n and the mean o f the Hb levels, multiplied by 1 0 0 . The Co ulter and Co bas were calibrated daily acco rding to the manufacturer’s reco mmendatio n. The Hemo Cue pho to meter is facto ry-calibrated and sho uld no t be recalibrated. The calibratio n was checked daily acco rding to the ma nufa c ture r’ s re c o mme nd a tio n. The calibratio n was stable during o ur study perio d. Sta tistic a l M e tho d s. A ll the sta tistic a l a na lyse s w e re p e rfo rme d o n the sha re w a re
so ftwa re EPIIN FO , versio n 6 (linea r reg ressio n a na lysis, Student “ t” test, the c a lc ula tio n o f the mea n a nd sta nda rd devia tio n).6 A “ p” va lue less tha n 0 .0 5 wa s c o nsidered a s sta tistic a lly sig nific a nt.
RESULTS
The repro duc ib ility o f ea c h metho d wa s eva lua ted b y mea suring the Hb level 1 0 times fro m a sing le b lo o d sa mple a nd determining the c o effic ient o f va ria tio n (CV) fo r ea c h a ssa y. The CV fo r the Co ulter, Co b a s a nd Hemo Cue me tho d s w a s 0 . 6 8 % , 0 . 8 2 % , a nd 0 . 6 9 % , respec tively (Ta b le 1 ).
W e first a sse sse d the me a sure me nts o f c e ntra l te nd e nc y (me a n a nd me d ia n) a nd variatio n (rang e and standard deviatio n) fo r the 2 5 9 Hb determina tio ns fro m ea c h metho d. As sho w n in Ta b le 2 , w e c o uld no t find a ny sta tistic a l d iffe re nc e fo r the se p a ra me te rs. Ho w e ve r, w e o b se rve d tha t the He mo C ue metho d sho wed the lo west mea n (1 1 .5 g / dl) a nd the lo w e st me d ia n (1 1 . 4 g / d l) w he n c o mp a re d to b o th the C o ulte r a nd C o b a s metho ds (mean = 1 1 .6 and median = 1 1 .7 and 1 1 .6 g / dl, respec tively).
determina tio n will no t b e sta tistic a lly different fro m z e ro . By using this a ppro a c h it is a lso po ssible to establish a limit o f ag reement (within a g iven c o nfidenc e interva l) b etween the two me tho d s a nd to g ra p hic a lly visua liz e the dispersio n o f these differences acro ss Hb levels.
Fo r instance, this co uld indicate whether g reater variability co uld be asso ciated with a particular ra ng e o f Hb determina tio ns a nd thus sug g est a lack o f precisio n asso ciated with that Hb rang e. The a pplic a tio n o f the Bla nd a nd Altma n a ppro a c h to o ur da ta is sho wn in Ta b le 4 . It c a n b e seen tha t the o nly pa ir o f metho ds with a mea n o f the differenc e no t different fro m z ero is the C o ulte r/ C o b a s p a ir (p = 0 . 5 8 8 ). Therefo re, these a re the metho ds whic h a g ree o n Hb me a sure me nts. Pa irs o f me tho ds tha t invo lved the Hemo Cue metho d g a ve a mea n o f the differenc e sta tistic a lly different fro m z ero (p < 0 .0 0 1 ).
The Bla nd a nd Altma n a ppro a c h a llo wed us to c a lc ula te the limit o f a g reement b etween
Table 1 – Determination of the coefficient of variation for the three methods of Hb measurement
Metho d Mean SD CV
Co ulter 1 3 .4 0 .0 1 9 0 .6 8
Co bas 1 2 .8 0 .1 0 0 .8 2
Hemo Cue 1 3 .0 0 .0 9 0 .6 9
SD = Standard Deviatio n
CV = Co efficient o f Variatio n
Ta ble 2 – M ea surements of centra l tendency a nd va ria tion for the three methods of Hb determina tion
Metho d n Rang ea Meana,b SDc Mediana
Co ulter 2 5 9 7 .2 to 1 8 .3 1 1 .6 2 .1 1 1 .7
Hemo Cue 2 5 9 6 .7 to 1 8 .5 1 1 .5 2 .3 1 1 .4
Co bas 2 5 9 6 .8 to 1 8 .5 1 1 .7 2 .2 1 1 .4
a
Hemo g lo bin values in g / dl
b
There was no statistically sig nificant difference between the mean o f the Hb determinatio n fo r the three metho ds
c
SD = Standard Deviatio n
Ta ble 3 - Linea r Regression Ana lysis betw een pa irs of the three methods used for Hb determina tion (n=2 5 9 )
Reference Testing Co efficient
metho d metho d Co rrelatio n Slo pe Y-Intercept
Co ulter Hemo Cue 0 .9 9 1 .0 5 -0 .6 9
Co ulter Co bas 0 .9 7 1 .0 0 -0 .0 2
Co bas Hemo Cue 0 .9 7 0 .9 9 -0 .1 1
Ta ble 4 - Use of the Bla nd a nd Altma n a pproa ch for determining the a greement betw een pa irs of the three methods used for Hb mea surement
Reference Testing Mean o f the Limits o f p-value fo r
metho d metho d difference ag reement the difference
Co ulter Co bas -0 .0 3 0 ± 1 .1 3 0 .5 8 8
Co ulter Hemo Cue 0 .1 0 0 ± 0 .7 8 <0 .0 0 1
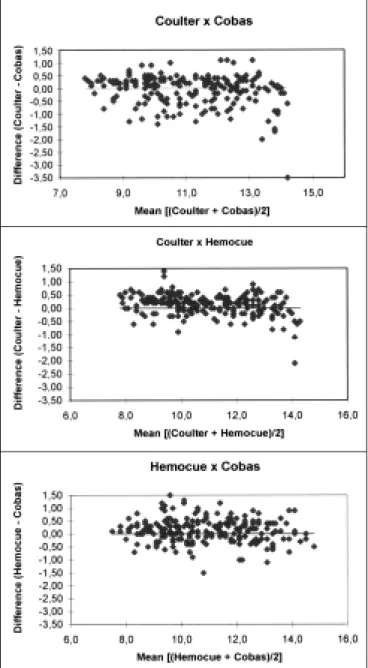
a ny two metho ds. These limits a re a lso sho wn in Ta b le 4 . The pa ir Co ulter/ Co b a s g a ve a limit o f ag reement o f 1 .1 3 g / dl, while pairs invo lving the He mo C ue me tho d sho w lo w e r limits o f ag reement (Co ulter/ Hemo Cue = 0 .7 8 g / dl and Co b a s/ Hemo Cue = 1 .0 2 g / dl). The limit o f a g reement reflec ts the dispersio n o f the da ta a ro und the mea n o f the differenc e (illustra ted in Fig ure 1 ).
DISCUSSION
Ta ken a s a who le, o ur da ta indic a tes tha t the Co ulter a nd Co b a s metho ds sho w the b est ag reement and that the Hemo Cue metho d g ives a lo wer Hb determina tio n when c o mpa red to b o th the C o ulte r a nd C o b a s me tho d s. This differenc e is 0 .1 0 a nd 0 .1 3 g / dl in rela tio n to the C o ulte r a nd the C o b a s me tho d s, re sp e c tive ly. Ho w e ve r, p a irs o f me tho d s invo lving the Hemo Cue seem to ha ve na rro wer limits o f a g reement tha n the Co ulter a nd Co b a s c o mb ina tio n. This is in a c c o rda nc e with the CV fo r the thre e me tho d s. Thus, a ltho ug h the Hemo Cue metho d sho ws lo wer mea surement o f Hb le ve ls, the se me a sure me nts se e m to fluc tua te le ss w he n c o mp a re d w ith o the r metho ds.
In this study we used sa mples fro m veno us puncture co llected directly into Vacutainer tubes c o nta ining EDTA -K3. This w a s d o ne to
sta nda rdiz e the mea surement o f the Hb . Pa rt o f the 1 % d iffe re nc e (0 . 1 0 g / d l) b e tw e e n the Hemo Cue system a nd the Co ulter STKS c a n b e expla ined b y the fa c t tha t the Hemo Cue system c o mpensa tes fo r turb idity in the b lo o d sa mple. Turb idity due to lipids, fo r exa mple, will g ive fa lsely eleva ted rea ding s b y Co ulter a nd o ther instruments mea suring pho to metric a lly a t o nly o ne wa veleng th.1 ,3 The ICSH metho d2 a c c epts a turb idity o f 0 .0 0 3 a b so rb a nc e units, whic h c o rrespo nds to 0 .1 1 g / dl hemo g lo b in. Hig her turb idity is expec ted sinc e b lo o d do no rs a re no t fa sting .
It is a lso po ssib le tha t the b io c he mic a l me tho d use d fo r Hb me a sure me nt (c ya nme -ta hemo g lo b in versus hemo g lo b ina z ide) c o uld
Figure 1 - Individual differences between Hb values
(n=259) were plotted against the average Hb value as determined by pairs of Hb measurement meth-ods. Each figure shows plots of the following differ-ences and averages: A, Cobas; B, Coulter-HemoCue; and C, Cobas-HemoCue. The line indi-cates the null difference.
ha ve influe nc e d o ur re sult. It sho uld b e mentio ned tha t the c ya nmeta hemo g lo b in is the metho d rec o mmended b y the ICSH.
REFERENCES
1. Vo n Schenck, Falkensso n M, Lundberg B. Evaluatio n o f Hemo Cue, a
new Device fo r Determining Hemo glo bin. Clin Chem 1986;32:526-9.
2. ICSH. Reco mmendatio ns fo r Reference Metho d fo r Hemo glo b
in-o metry in Human Blin-o in-o d (ICSH standard 1995) and Specificatiin-o ns fo r Internatio nal Hemo glo b incyamide Standard (4th editio n). J Clin Patho l 1996;49:271-4.
3. Nicho lls PD. An evaluatio n o f the Hemo Cue fo r Co rrecting the
He-m o g lo b in Va lu e o f Lip e He-m ic S a He-m p le s . M e d La b S c ie n c e s 1990;47:226-9.
4. Cab le RG. Hemo glo b in Determinatio n in Blo o d Do no rs.
Transfu-sio n Med Ver 1995;9:131-44.
5. Carls o n DA, Daigne ault RW, Statland BE. Evaluatio n o f the
Hemo Cue pho to meter fo r measurement o f b lo o d do no r hemo glo
-b in. A-b stract fo r the 40th anniversary meeting o f the American
As-so ciatio n o f Blo o d Banks, Orlando , FL, 1987.
6. Dean AG, Dean JA, Burto n AH, Dicker RC. Epi Info , versio n 5: a
wo rd pro cessing, datab ase, and statistics pro gram fo r epidemio l-o gy l-o n micrl-o cl-o mputers. Stl-o ne Ml-o untain, GA: USD; 1990.
7. Bland JM, Altman DG. Statistical Metho ds fo r Assessing
Agree-m e nt Be twe e n two Me tho d s o f Clinic al Me asure Agree-m e nt. Lanc e t 1986;i:307-10.
Ja cob Rosenblit - MD, Hemo therapy Service, Ho spital Israelita Albert Einstein.
RESUMO
Contex to: A medida de hemo g lo bina (Hb) é o indicado r mais utiliz ado para a verificação de anemia, na triag em de do ado res de sang ue. Atualmente o méto do fo to métrico mais utiliz ado é o da ciano -metahemo g lo bina. Co mo alternativa a essa tecno lo g ia, a Hemo cue desenvo lveu um méto do fo to métrico baseado na determinação da az ida metahemo g lo bina.
O bjetivo: Avaliar o desempenho de três méto do s de do sag em de hemo g lo bina (Hb) em do ado res de sang ue. Tipo de Estudo: Estudo pro spectivo utiliz ando amo stras de sang ue para co mparar testes de do sag em de Hb. Loca l: Serviço de Hemo terapia do Ho spital Israelita Albert Einstein, instituição privada de atenção terciária de saúde. Am ostra : Fo ram co lhidas amo stras seriadas de sang ue de 2 5 9 indivíduo s no perío do de março a junho de 1 9 9 6 . Va riá veis Estuda da s: O desempenho do s testes e suas co mparaçõ es fo ram realiz ado s pela análise do co eficiente de co rrelação , reg ressão linear e co mparação das médias. Resulta dos: O s co eficientes de variação para o s três méto do s fo ram: Co ulter, 0 .6 8 %, Co bas, 0 .8 2 %, e Hemo Cue, 0 .6 9 %. N ão ho uve diferenças estatísticamente sig nificativas entre as médias das determinaçõ es de hemo g lo bina pelo s três méto do s (p>0 ,0 5 ). O s méto do s Co ulter e Co bas mo straram melho r co nco rdância enquanto o méto do Hemo Cue teve medidas de hemo g lo bina meno res. Entretanto , o s pares Co ulter/ Hemo Cue e Co bas/ Hemo Cue tiveram limites de co nco rdância mais estreito s (+ 0 ,7 8 e + 1 ,0 2 ) daquele o btido co m o par Co ulter/ Co bas (+ 1 ,1 3 ). Conclusões: O s três méto do s demo straram excelente co nco rdância para a do sag em de hemo g lo bina.
Clá udia Regina Abreu - BSC, Hemo therapy Service, Ho spital Israelita Albert Einstein.
Leonel N ulm a n Szterling - MD, Hemo therapy Service, Ho spital Israelita Albert Einstein.
José M a uro Kutner - MD, Hemo therapy Service, Ho spital Israelita Albert Einstein.
N elson Ha m erschla k - MD, Hemo therapy Service, Ho spital Israelita Albert Einstein.
Pa ula Frutuoso - BSc, Hemo therapy Service, Ho spital Israelita Albert Einstein.
Thelm a Regina Silva Stra cieri de Pa iva - BSC, Hemo therapy Service, Ho spital Israelita Albert Einstein.
O rla ndo da Costa Ferreira Júnior - MD, PhD. Hemo therapy Service, Ho spital Israelita Albert Einstein.
Sources of Funding: N o t dec la red
Conflict of interest: N o t dec la red
La st received: 1 5 June 1 9 9 8
Accepted: 2 3 July 1 9 9 8
Address for correspondence:
Ja c o b Ro senb lit
Serviç o de Hemo tera pia do Ho spita l Alb ert Einstein Av. Alb ert Einstein, 6 2 7 , 4 º a nda r