SATISFACTION OF HEARING IMPLANT USERS
Satisfação de usuários de próteses auditivas
Quezia Peruzzo(1), Dioni Ceolin(1), Lenita da Silva Quevedo(2)
(1) Universidade de Passo Fundo, Passo Fundo, RS, Brasil. (2) Universidade Federal de Santa Maria, Santa Maria, RS,
performance in speech tests. Even normal hearing individuals need more intensity of sentences presentation in silence and in noise to reach speech recognition percentages similar to young adults normal hearing subjects3.
The auditory rehabilitation may be deined as a process of problem solving, with the purpose of minimizing diiculties (activity limitation) and disad
-vantages (participation restriction) of an individual with hearing impairments4.
The HA are adapted for each type of hearing loss (mild, moderate, severe and profound). The HAs are a resource of variable technology, with available sound to reach individuals and they amplify entrance sounds. They provide auditory comprehension, not avoiding hearing loss progression, but they stimulate delays, decreasing, over time, sensory deprivation, and improving the degree of auditory acclimatation5.
The users of hearing implants improve their own quality of life and the life quality of individuals who live close to them. They make communication
INTRODUCTION
Hearing is fundamental not only for acquisition as well as for maintaining human communication, speech development and language.
Auditory impairment is considered the third most common population’s impairment1. It causes
hearing diiculties and also a negative impact on development, psychosocial and cognitive behavior, speech and language, as there may be isolation of social and occupational activities, afecting quality of life. A way to decrease the impact of hearing loss in individuals’ lives is the use of Hearing Aids (HA). So, environmental and speech sounds, as well as signs of warning and danger will be ampliied1, 2.
When hearing loss is perceived in adult age, its implications may be higher because of the restric
-tions it imposes. The aging process causes worse
ABSTRACT
Purpose: to analyze through the questionnaire Satisfaction With Ampliication in Daily Life the
satisfaction users Sound Ampliication Device Single, after a month of use and check if there was an improvement in this satisfaction two months after the irst application of the questionnaire. Methods:
according to inclusion criteria, 50 patients participated, with varying age, hearing loss, regardless of the level and type that they need to use hearing aids bilaterally. The questionnaire was applied 30 days after the adaptation of Device Personal Sound Ampliication apparatus and reapplied after 60 days of adjustment with to the use of the prosthesis. Result: it was observed a satisfaction of hearing aids
at all factors (negative factors, positive efect, personal image and personal service and cost). The positive efect subscale showed the highest numbers in search of satisfaction. In relation to age group who obtained satisfaction, prevailed over 60 years ages; in the degree of loss, were the moderate and moderately severe; in the classiication of appliance, the type A introduced greater satisfaction. These results were statistically signiicant in the research. Conclusion: there was satisfaction with the
use of the Individual Sound Ampliication Device at all factors evaluated. The positive efect was the subscale that had the highest numbers of satisfaction in age, degree of hearing loss and classiication of Individual Sound Ampliication Device.
limitations.
First, the subjects who came and accepted to participate in the research were patients of irst check-up (30 days after HA adaptation), who signed the informed consent term, after reading it. Then, the patients responded the SADL questionnaire7 (Annex
1). The researchers read the questions and the patients had 30 minutes to answer them. When the patients returned for the second check-up (90 days after adaptation), the questionnaire was reapplied. After concluding the fulillment, the questionnaires were collected and the data were tabulated.
The SADL questionnaire was developed at Memphis University (United Stated) and translated to Brazilian Portuguese by the questionnaire authors. The original version and the Portuguese version are available on htm.www.memphis.edu/ausp/harl/sadl. Such instrument was elaborated with the purpose of quantifying the satisfaction degree by the use of ampliication, allowing the identiication of adverse aspects regarding the HA adaptation.
The SADL questionnaire consists of 15 closed questions, subdivided in four sub-scales:
• Positive Efects: present questions related to
communicative skills, sound location, sound quality and also psychological aspects. It consists of six items (questions 1, 3, 5, 6, 9, 10);
• Service and cost: it evaluates the
Speech-Language therapist competence and the HA value, in three items (12, 14, 15). As the research was performed with subjects who received their HA through concession, the cost was treated only regarding the batteries values and the trans
-portation to the adaptations;
• Negative factors: they cover three items which
investigate the performance in noisy environment, with feedback and use of telephone (questions
2, 7, 11);
• Personal image: it consists of three items which
research the HA users1 self-image and the
hearing implants stigma (questions 4, 8, 13). The questionnaire was applied in the patients 30 days after receiving the HA and it was reapplied after 60 days of implants use adaptation.
The Grant Hearing Aids Program provides seven brands in three types of HA. The type A classiication is digital with timer and it has one channel; type B is digital, with timer and two channels; type C is digital computerized. All of them present noise reducer. The HAs, categories A, B and C presented diferent brands.
The statistical test used for the analysis was the T-test with average comparisons for dependent samples (paired t-test). The data analysis was There are several factors which contribute for
the success of the sound ampliication use, such as: age, degree, type of hearing loss, physical features, hearing processing skills, use preceding HA and hearing loss length, which, together, play an essential role for ampliication acceptation. With this, the auditory handicap perception, the cost, personal expectations, satisfaction, performance and beneits may indicate the users’ satisfaction with the sound ampliication6.
With the purpose of knowing the satisfaction of auditory implants’ users, researchers developed the questionnaire Satisfaction With Ampliication in Daily Life (SADL)7. This instrument was created
with the aim of quantifying the satisfaction degree with the ampliication use, allowing the identiication of adverse aspects related to HA adaptation. It is a simple questionnaire, with easy application, which contains ifteen questions that help professionals to observe factors which are impairing and/or improving the use of implants.
So, after these considerations, the research purpose was to analyze the satisfaction in the HA adaptation through the SADL questionnaire, divided by the sub-scales: Positive Efect, Negative Factor, Service and Cost and Personal Image. Each sub-scale was analyzed in relation to age group, type of hearing loss, degree of hearing loss and HA type classiication, comparing the irst and the second questionnaire application in each subject.
METHODS
The project was approved by the Ethics Committee from Passo Fundo University (UPF), protocol n. 443. 285.
The present research is a cross sectional study. It was performed in a partnership between the Speech-Language and Hearing course from UPF and a clinic in connection to the Uniied Health System (SUS) in the north of Rio Grande do Sul State, Brazil, that participates in the Grant Hearing Aids Program of the Secretary of Health Care from the Ministry of Health, where institutional authori
-zation was requested.
The list sampling was for convenience. It means that the sample size was determined through avail
hearing loss, it was observed that most subjects presented sensorineural hearing loss (84%). The prevalent levels of hearing loss were moderate (38%) and moderate-severe (32%). The HAs were classiied in three categories: category A was 37%; B was 29%; and C was 33%.
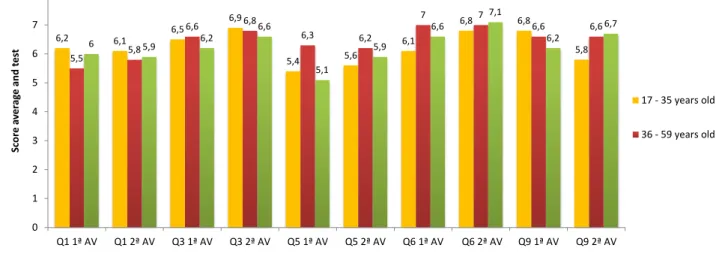
In relation to Positive Efect, the responses were observed according to the age group. The age group 17-35 years old presented important improvements in questions 3, 5 and 6; in the age group 36-59 years old, there were improvements in questions 1 and 3; and in the age group over 60 years old, the questions which obtained improvements were 3, 5, 6 and 9 (Figure 1).
performed through the signiicance level adopted for the α tests = 5% (0.05).
The analyzed variables in relation to the sub-scales (positive efect, negative factor, service and cost and personal image) were age group, loss degree and HA type.
RESULTS
The sample consisted of 50 subjects. From them, 56% were male and 44% were female. The age group varied from 17 to 84 years old. Most subjects were over 60 years old (60%). About the type of
6,2 6,1 6,5
6,9
5,4 5,6
6,1
6,8 6,8
5,8
5,5 5,8
6,6 6,8
6,3 6,2
7 7
6,6 6,6
6 5,9 6,2
6,6
5,1
5,9
6,6
7,1
6,2
6,7
0 1 2 3 4 5 6 7 8
Q1 1ª AV Q1 2ª AV Q3 1ª AV Q3 2ª AV Q5 1ª AV Q5 2ª AV Q6 1ª AV Q6 2ª AV Q9 1ª AV Q9 2ª AV
S
co
re
a
v
e
ra
g
e
a
n
d
t
e
st
17 - 35 years old
36 - 59 years old
Note: Q: question; AV: evaluation
Figure 1 – Comparison between the score averages of the irst and second questionnaire application, in relation to the positive efect, according to age group
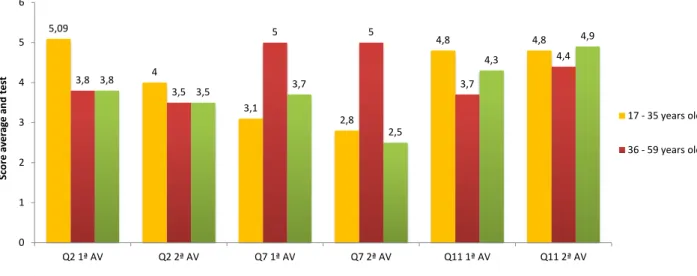
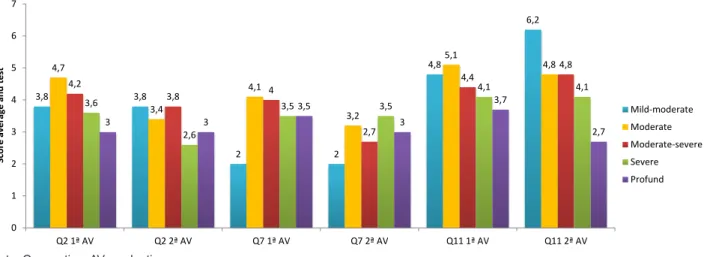
and the second evaluation to improve the results, because they regard discomfort caused by HA sounds and whistles and, in question 11, the score should increase because it is related to the use of telephone with HA. In the age group 17-35 years old, it was veriied that, in questions 2 and 7, there was improvement; the age group 36-59 presented improvements in questions 2 and 11; and, in the age group over 60 years old, all questions obtained improvements (Figure 2).
The statistical analysis was performed through the total average of the results from the irst and the second evaluation by each age group. It was observed that HA users from the age group over 60 years presented statistically signiicant diference (p<0.05) when it was compared the results from the irst and second evaluation of HA adaptation
(Figure 1).
5,09
4
3,1
2,8
4,8 4,8
3,8
3,5
5 5
3,7
4,4
3,8
3,5 3,7
2,5
4,3
4,9
0 1 2 3 4 5
Q2 1ª AV Q2 2ª AV Q7 1ª AV Q7 2ª AV Q11 1ª AV Q11 2ª AV
S
co
re
a
v
e
ra
g
e
a
n
d
t
e
st
17 - 35 years old
36 - 59 years old
Note: Q: question; AV: evaluation
Figure 2 – Comparison between the score averages of the irst and second questionnaire application,
in relation to the negative factor, according to the age group
Because the questions presented diference in scores, it was not possible to perform an analysis between the general average of the irst and second evaluation of the Negative Factor (Figure).
Regarding services and costs, in the age groups 17-35 and 36-59 years old, it was observed improvements only in question 14, while in the age
group over 60 years old, there was improvement in question 12. About question 15, there was no alteration in the score of any age group, because it is a question related to HA repair, what did not happen because of the little time the patients used the implants (Figure 3).
6,4 6,3
6
6,4
7 7
6,8 6,7
5,1
6,1
7 7
6,5
7,1
6,4 6,3
7 7
0 1 2 3 4 5 6 7 8
Q12 1ª AV Q12 2ª AV Q14 1ª AV Q14 2ª AV Q15 1ª AV Q15 2ª AV
S
co
re
a
v
e
ra
g
e
a
n
d
t
e
st
17 - 35 years old
36 - 59 years old
Note: Q: question; AV: evaluation
Figure 3 – Comparison between the score averages of the irst and second questionnaire application,
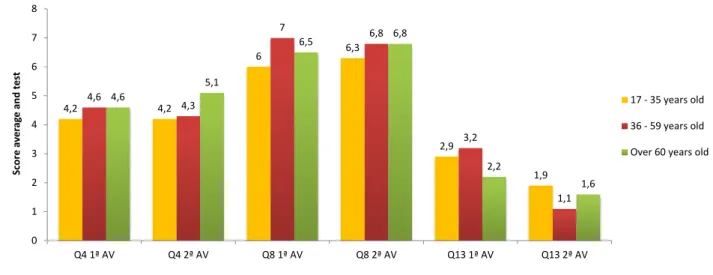
The indings about Personal Image, in relation to age group, showed that, in the age group 17-35 years old, the questions 8 and 13 presented improvements; 36-59 years old, there were improve
-ments in questions 4 and 13; and in the age group over 60 years old, the questions 8 and 13 prevailed
(Figure 4).
The statistical analysis was performed through the results total average of the irst and second evaluation of each age group. About services and costs, although it was observed improvements regarding satisfactions in some questions by HA users, this sub-scale was not statistically signiicant
(Figure 3).
4,2 4,2
6 6,3
2,9
1,9 4,6
4,3
7
6,8
3,2
1,1 4,6
5,1
6,5 6,8
2,2
1,6
0 1 2 3 4 5 6 7 8
Q4 1ª AV Q4 2ª AV Q8 1ª AV Q8 2ª AV Q13 1ª AV Q13 2ª AV
S
co
re
a
v
e
ra
g
e
a
n
d
t
e
st
17 - 35 years old
36 - 59 years old
Over 60 years old
Note: Q: question; AV: evaluation
Figure 4 – Comparison between the score averages of the irst and second questionnaire application,
in relation to personal image, according to age group
The statistical analysis was performed through the total results average from the irst and second evaluation of each age group. For the HA users of all age groups, regarding personal image, it was observed improvement in the results, but without signiicant values (Figure 4).
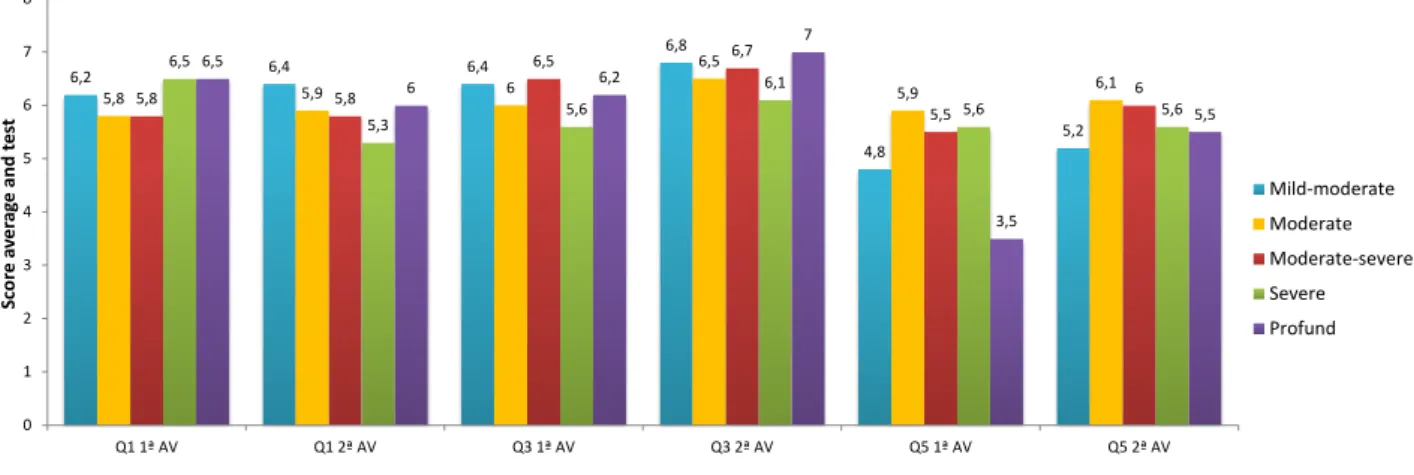
The data about loss degree related to the positive efect were divided in two parts, to better visualize information (Figures 5.1 and 5.2).
It was observed that, in the mild-moderate degree, questions 1, 3 and 5 presented improvements; in the moderate degree, there was prevalence in questions 3, 5, 6, 9 and 10; in moderate-severe level, questions 3, 5 and 10 improved in the severe degree; the questions 3, 6 and 10 presented improvements and; in profound level, the questions 3, 5, 6 and 10 presented score increase (Figures
5.1 and 5.2).
The statistical analysis was performed through the results total average from the irst and the second evaluation, related to the hearing loss degree. Thus, the HA users, regarding the positive
efect, presented score improvements, with statis
-tically signiicant results in the levels moderate (p<0.05) and moderate-severe (p<0.05); in the levels mild-moderate, severe and profound there was improvement, but without statistical relevance
(Figures 5.1 and 5.2).
irst and second evaluation of each classiication that, in the positive efect, type A patients adapted with HA presented higher satisfaction degree, with statistically signiicant diference (p<0.05); in type B and C HA patients, there were improvements, but not signiicant. Although type A HA has less techno
-logical resources, compared to the other types, the patients who use this type of implant presented higher satisfaction level. Type A HAs are used, often, in patients with higher degrees of hearing loss, what may justify the satisfaction (Figure 7).
The questions presented score diferences, so, it was not possible to perform an analysis between the averages of the irst and second evaluation in the Negative Factor (Figure 6).
In the results related to HA classiication, it was observed that in type A there were improvements in all questions regarding the positive efect; in type B, only question 10 presented prevalence; and, in type C, there was signiicant diference in questions 3, 5
and 10 (Figure 7).
In the performed statistical analysis, it was observed, through the total results average of the
6,2 6,4 6,4
6,8
4,8
5,2
5,8 5,9 6
6,5 5,9 6,1 5,8 5,8 6,5 6,7 5,5 6 6,5 5,3 5,6 6,1 5,6 5,6 6,5 6 6,2 7 3,5 5,5 0 1 2 3 4 5 6 7
Q1 1ª AV Q1 2ª AV Q3 1ª AV Q3 2ª AV Q5 1ª AV Q5 2ª AV
S co re a v e ra g e a n d t e st Mild-moderate Moderate Moderate-severe Severe Profund
Note: Q: question; AV: evaluation
Figure 5.1 – Comparison between the score averages of the irst and second questionnaire application, in relation to the positive efect, according to the loss degree
7 7 6,4 6,2 5,8 5,2 6,5 6,7 5,9 6,5 5,6 5,8 6,9 7 6,5 6,6 5,5 6,1 6,5
6,8 6,8 6,8
5,6 6 6,7 7 7 6,7 5,5 6 0 1 2 3 4 5 6 7 8
Q6 1ª AV Q6 2ª AV Q9 1ª AV Q9 2ª AV Q10 1ª AV Q10 2ª AV
S co re a v e ra g e a n d t e st Mild-moderate Moderate Moderate-severe Severe Profund
Note: Q: question; AV: evaluation
3,8 3,8 2 2 4,8 6,2 4,7 3,4 4,1 3,2 5,1 4,8 4,2 3,8 4 2,7 4,4 4,8 3,6 2,6 3,5 3,5 4,1 4,1 3 3 3,5 3 3,7 2,7 0 1 2 3 4 5 6 7
Q2 1ª AV Q2 2ª AV Q7 1ª AV Q7 2ª AV Q11 1ª AV Q11 2ª AV
S co re a v e ra g e a n d t e st Mild-moderate Moderate Moderate-severe Severe Profund
Note: Q: question; AV: evaluation
Figure 6 – Comparison between the score averages of the irst and second questionnaire application,
in relation to the negative factor, according to the loss degree
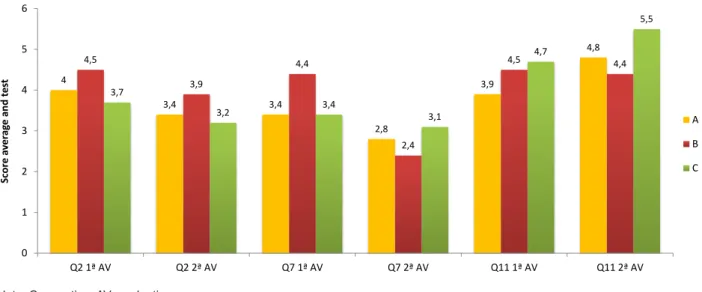
The results of questions 2 and 7 need to have the diference reduced between the irst and second evaluation to improve the results, as they are questions related to discomfort caused by HA sounds and whistles and Q11. The score should increase because it is a question related to telephone use with HA. Therefore, in types A and C implants,
all the questions presented improvements; in type B HAs only in questions 2 and 7 there were improve
-ments (Figure 8).
As the questions present scores diferences, it was not possible to perform an analysis between the irst and second evaluation of the Negative factor (Figure 8).
4,7 6,2 6,1 6,7 5,4 5,8 6,8 7 5,8 6,3 5,2 5,5 6 5,8 6,8 6,8 5,8 5,9
6,9 6,9 7 7
5,6 5,8 6,2 5,5 6,1 6,5 5,1 5,8
6,4 6,5 6,5 6,4
5,9 6,2 0 1 2 3 4 5 6 7 8
Q1 1ª AV Q1 2ª AV Q3 1ª AV Q3 2ª AV Q5 1ª AV Q5 2ª AV Q6 1ª AV Q6 2ª AV Q9 1ª AV Q9 2ª AV Q10 1ª AV Q10 2ª AV
S co re a v e ra g e a n d t e st A B C
Note: Q: question; AV: evaluation
research, in which 95% of the subjects presented sensorineural hearing loss11.
Some studies mention that the interval between the adaptation and the evaluation date is one of the variables which seems to inluence the results of the self-evaluation methods. Several studies concluded that the period of two weeks after the HA adaptation is not enough to evaluate the result through the SADL12. In the present study, it was used a 30 days
interval among the applications, what has already occurred in other researches8-14.
In the present research, it was observed that the Positive Efect was the factor with signiicant diference between the analysis of the results of the irst and second evaluation in the use of hearing implants. In another research, it was also observed that the positive efect increased after the irst three months of use. It means that three months of HA use were enough to increase the score of positive efects and this result remained after six months8.
In the research with the questionnaire IOI-HA (International Outcome Inventory for Hearing Aids)15,
the results showed higher degree of satisfaction of a sample with predominance of older individuals (63,67%), with ages over 60 years, retired and with little quality of life expectancy15. In the present
research, it was also observed that the age group over 60 years old presented a degree of satisfaction statistically diferent (p<0.05), in the positive efect
(Figure 1).
About the characteristics of the hearing loss degree, 38% of the subjects presented moderate degree and 32%, moderate-severe, who obtained
DISCUSSION
The SADL questionnaire7, according to literature,
is a practical questionnaire easy to be compre
-hended. However, it was veriied some problems of its application, such as the use of words which are diicult for the population in general, who need help to understand these terms7.
It was observed, in the present research, that there was reluctance in expressing negative opinion or criticism, perhaps because some individuals are afraid of losing the right to be received at the clinic or the HA use. It was also observed in another study8,9.
About the score, the SADL is practical, but in the analysis there was diiculty, because the question
-naire presents distinctive marking and some questions need to have low values to refer HA use improvements.
The questionnaire score should be more evident, not using numbers, which are from 1 to 7. A study suggests the use of words such as good, very good, great and regular to express the level of satisfaction10.
The patients were predominantly male (56%), as in other studies10,11 which researched the satisfaction
of hearing implants users. The age of the evaluated individuals was very diversiied and well distributed, from 17 to 84 years old (Figure 1).
Regarding the type of hearing loss, it was observed prevalence of the sensorineural hearing loss (84%), (6%) of mixed e (10%) of sensorineural/ mixed (Figure 1). This data agrees with a similar
4
3,4 3,4
2,8
3,9
4,8 4,5
3,9
4,4
2,4
4,5 4,4
3,7
3,2 3,4 3,1
4,7
5,5
0 1 2 3 4 5
Q2 1ª AV Q2 2ª AV Q7 1ª AV Q7 2ª AV Q11 1ª AV Q11 2ª AV
S
co
re
a
v
e
ra
g
e
a
n
d
t
e
st
A
B
C
Note: Q: question; AV: evaluation
they still have diiculties of HA adaptation, the technology of the hearing implants seems not to have inluenced the response (50% analogical and 50% programmable digital)15. It can be compared
with the present study, in which there was higher satisfaction by the type A HA users, which refer to the device with less technology (Figure 7).
CONCLUSION
It was observed satisfaction by the HA users between the irst and the second evaluation. There were improvements in the results of all sub-scales of the research, although not necessarily in all variables. The positive efect was the aspect with higher numbers of satisfaction in age group, level of hearing loss and HA classiication.
It can be concluded that the HA adaptation (use) time contributes to the users’ satisfaction in all researched sub-scales.
signiicant improvements in the positive efect, moderate and moderate-severe (Figure 6.1). It is possible to compare this to a study that found 90% of the subjects who presented tonal average of normal, mild or moderate degree. Probably, it beneited the good satisfaction results obtained, as the HA performance is worse in cases of more severe hearing loss11.
In the negative factor sub-scale, there is a question about telephone use, in which it was possible to observe that most HA users who partici
-pated in the research were not satisied with its use, because they referred a lot of diiculty or they did use the telephone along with the HA use. Such results were also found in other studies11,14.
The present research observed high level of satisfaction in the factor personal image. The users were glad and they feel able to use the HA, data which was also observed in another study16.
In a study15 which evaluated the level of dii
-culty found with the ampliication use, the authors observed that in 22 individuals, who referred that
RESUMO
Objetivo: analisar, por meio do questionário Satisfaction With Ampliication in Daily Life, a satisfação
dos usuários de Aparelho de Ampliicação Sonora Individual, após um mês de uso, e veriicar se houve uma melhora nesta satisfação dois meses após a primeira aplicação do questionário. Métodos: de
acordo com critérios de inclusão, participaram 50 pacientes, com faixa etária variada, com perda audi
-tiva, não importando grau e tipo de necessidade do uso de prótese auditiva bilateralmente. Aplicou-se o questionário 30 dias após a adaptação do Aparelho de Ampliicação Sonora Individual e reaplicado após 60 dias de adaptação com o uso da prótese. Resultado: foi observada uma satisfação da pró
-tese auditiva em todos os fatores (negativo, positivo, imagem pessoal, serviço e custo). A subescala efeito positivo foi a que apresentou maior número de satisfação na pesquisa. Em relação à faixa etária que obteve satisfação, prevaleceram as idades acima de 60 anos; nos graus de perda, foram as moderadas e moderadamente severa; na classiicação de aparelho, o tipo A apresentou maior satisfação. Esses resultados foram estatisticamente signiicantes na pesquisa. Conclusão: houve
satisfação com o uso do Aparelho de Ampliicação Sonora Individual em todos os fatores avaliados. O efeito positivo foi a subescala que apresentou maior número de satisfação na faixa etária, grau de perda auditiva e classiicação de Aparelho de Ampliicação Sonora Individual.
9. Armigliato ME, Prado DGA, Melo TM, Martinez MANS, Lopes AC, Amantini RCB, Bevilacqua MC. Avaliação de serviços de saúde auditiva sob a perspectiva do usuário: proposta de instrumento. RevSocBrasFonoaudiol. 2010;15(1):32-9.
10. Danieli F, Castiquini EAT, Zambonatto TCF, Bevilacqua MC. Avaliação do nível de satisfação de usuários de aparelhos de ampliicação sonora individuais dispensados pelo Sistema Único de Saúde. RevSocBrasFonoaudiol. 2011;16(2):152-9. 11. Carvalho JSA. Satisfação de idosos com Aparelhos Auditivos concedidos no Estado de Tocantins. Arq. Int. Otorrinolaringol. / Intl. Arch. Otorhinolaryngol, 2007;11(4):416-26.
12. De Almeirda K, Iorio MCM. Próteses auditivas: fundamentos teóricos e aplicações clínicas. 2ª ed. São Paulo: Editora Lovise; 2003.
13. Farias RB, Russo ICP. Saúde auditiva: estudo do grau de satisfação de usuários de aparelho de ampliicação sonora individual. RevSocBrasFonoaudiol. 2010;15(1):26-31.
14. Veiga LR, Merlo ARC, MengueSS. Satisfação com a prótese auditiva na vida diária em usuários do sistema de saúde do exército. RevBrasOtorrinolaringol. 2005;71(1):67-73.
15. Teixeira CF, Augusto LGS, Caldas Neto SS.Prótese Auditiva: satisfação do usuário com sua prótese e com seu meio ambiente. Rev CEFAC. 2008;10(2):245-53.
16. Lessa AH, Costa MJ, Becker KT, VaucherAVA. Satisfação de usuários de próteses auditivas, com perda auditiva de graus severo e profundo. Arq. Int. Otorrinolaringol. / Intl. Arch. Otorhinolaryngol. 2010;14(3):338-45.
1. Albernaz PLM. Quem ouve bem, vive melhor: um livro para pessoas com problemas de audição e seus familiares. 1ª ed. São Paulo: MG editores; 2008.
2. Campos CAH, Russo ICP, Almeida K. Indicação, seleção e adaptação de próteses auditivas: princípios gerais. In: Almeirda K, Iorio MCM. Próteses auditivas: fundamentos teóricos e aplicações clínicas. 2ª ed. São Paulo: Editora Lovise; 2003. P.35-54.
3. Campos UP, Almeida KA. Satisfação com o uso de Próteses Auditivas Analógicas, Programáveis e Digitais. Distúrb. Comum. 2008;20(3):355-64. 4. Danieli F, Castiquini EAT, Zambonatto TCF, Bevilacqua MC. Avaliação do nível de satisfação de usuários de aparelhos de ampliicação sonora individuais dispensados pelo Sistema Único de Saúde. RevSocBrasFonoaudiol. 2011;16(2):152-9. 5. De Freitas CD, Costa MJ. Processo de adaptação de próteses auditivas em usuários atendidos em uma instituição pública federal – parte I: resultados e implicações com o uso da ampliicação. Rev. Bras. Otorrinolaringol. 2007;73(6):744-51.
6. Magalhães FF, Mondelli MFCG. Avaliação da satisfação dos usuários de aparelho de ampliicação sonora individual – revisão sistemática. Rev CEFAC. 2011; 13(3):552-8.
7. Mondelli MFCG, Magalhães FF, Lauris JRP. Cultural Adaptation of the SADL (Satisfaction with Ampliication in Daily Life) questionaire for Brazilian Portuguese. Rev. Brazilian Journal Otorhinolaryngol. 2011;77(5):563-72.
8. Laperuta EB, Fiorini AC. Satisfação dos idosos com os aparelhos de ampliicação sonora nos
Received on: September 09, 2014 Accepted on: January 05, 2015
Mailing address:
Dioni Ceolin
Rua Cel Chicuta, 10, ap. 802, Centro Passo Fundo – RS – Brasil
CEP: 99010-050
ANEXO 1
SATISFACTION WITH AMPLIFICATION IN DAILY LIFE
Name_______________________________________________________________________________ Date of Birth___/___/___ Today’s
Date___/___/___
INSTRUCTIONS
Listed below are questions on your opinions about your hearing aid(s). For each question, please circle the letter that is the best answer for you. The list of words on the right gives the meaning for each letter. Keep in mind that your answers should show your general opinions about the hearing aids that you are wearing now or have most recently worn.
A Not At All B A Little C Somewhat D Medium E Considerably
1. Compared to using no hearing aid at all, do your hearing aids help you understand the people you speak with most frequently?
A B C D E F G
2. Are you frustrated when your hearing aids pick up sounds that keep you from hearing what you want to hear?
A B C D E F G
3. Are you convinced that obtaining your hearing aids was in your best interests? A B C D E F G
4. Do you think people notice your hearing loss more when you wear your hearing aids? A B C D E F G
5. Do your hearing aids reduce the number of times you have to ask people to repeat? A B C D E F G
6. Do you think your hearing aids are worth the trouble? A B C D E F G
7. Are you bothered by an inability to get enough loudness from your hearing aids without feedback (whistling)?
A B C D E F G
8. How content are you with the appearance of your hearing aids? A B C D E F G
9. Does wearing your hearing aids improve your self-conidence? A B C D E F G
10. How natural is the sound from your hearing aids? A B C D E F G
11. How helpful are your hearing aids on MOST telephones with NO ampliier or loudspeaker? (If you hear well on the telephone without hearing aids, check here [ ] )
A B C D E F G
14. Does the cost of your hearing aids seem reasonable to you? A B C D E F G