The several faces of fear: ecological consequences of
predation risk in a lagoon model system
As várias faces do medo: consequências ecológicas do risco de
predação em um sistema modelo lagunar
Rafael Dettogni Guariento1 and Francisco de Assis Esteves2
1Departamento de Engenharia Civil, Universidade Federal do Rio Grande do Norte – UFRN,
BR-101, Campus Universitário, CEP 59078-970, Natal, RN, Brazil e-mail: [email protected]
2Núcleo em Ecologia e Desenvolvimento Sócio-Ambiental de Macaé – NUPEM,
Universidade Federal do Rio de Janeiro – UFRJ, CP119331, CEP 27965-045, São Jose do Barreto, Macaé, RJ, Brazil
e-mail: [email protected]
Abstract:Aim: The aim of this study was to evaluate the role of predation risk on the occurrence of trophic cascades in a benthic food chain, and detect if the ecological consequences of predation risk can reverberate in patterns observed across different hierarchical scales, such as prey size, prey growth efficiency and nutrient recycling patterns. Methods: The model system used in the present experiment consisted of a simple linear food chain comprising a predator, a consumer and periphyton as basal resources. For 2 weeks, we manipulated predation risk using caged predators, incapable of killing their prey, across twelve outdoor mesocosms, simulating natural lagoon conditions. Results: Our results showed that predation risk can be responsible for the occurrence of a trophic cascade and the strength of the cascade is proportional to the intensity of risk. Predation risk can also negatively influence prey biomass and growth efficiency as well as affect nutrient recycling patterns by altering prey nutrient excretion rates. Through a simple mathematical formulation, we attempted to show that individual-level experimental results can be generalized to natural populations if evolutionary constraints to prey fitness can be reproduced in experimental conditions. Conclusions: Our results corroborate to integrate ecosystem dynamics with animal behavior, highlighting that not only bottom-up but also top-down mechanisms are responsible for determining ecosystem properties. We ultimately claim that prey adaptive foraging may serve to integrate ecosystem and evolutionary ecology, resulting in the development of a more robust and predictive theory of the functioning of aquatic ecosystems.
Keywords: trophic cascades, trophic interactions, coastal lagoons, behavior, benthic food chain.
1. Introduction
The ecological literature offers many examples of the influence of predators on the structure of natural communities, and the concept of trophic cascade, the indirect interaction between top predators and resources, has been the focus of many of these studies (Schmitz et al., 2004; Gruner et al., 2008). In a simple food chain, which is composed of a predator, a prey and a primary producer, the trophic cascade describes the increase in the biomass or density of primary producers as a result of diminished consumer density due to predation. However the top interaction does not necessarily involve the consumption of prey: the presence of a predator represents a source of predation risk to the consumers (i.e., prey), which can modify the predator-prey interaction, resulting in changes in prey foraging behavior (Peckarsky et al., 2008, Moulton et al. 2010). This behavioral modification
can result in the reduction of the foraging time spent by prey or in an alteration in diet food items (non-consumptive predator effects), and both of these can favor primary producer total biomass (Figure 1).
Empirical evidence has shown that non-consumptive predator effects are as important as consumptive effects for the occurrence of trophic cascades (Guariento, 2007). The effort to connect these two distinct approaches has been propelled by the growing recognition that species interactions, as consequence of the traits and functional characteristics, can be important mediators of ecosystem properties and other biophysical aspects (Schmitz et al., 2008). To develop a predictive theory of the functioning of ecosystems we need to identify an essential mechanism for the functioning of ecosystems that is common to a great variety of natural systems. This is not an easy task since there o forrageamento adaptativo de presas pode servir para integrar a Ecologia Evolutiva e a
Ecologia de Ecossistemas, resultando no desenvolvimento de uma teoria mais preditiva e robusta a respeito do funcionamento de ecossistemas aquáticos.
Palavras-chave: cascatas tróficas, interações Tróficas, lagoas costeiras, comportamento, cadeia trófica bentônica.
as the occurrence of a trophic cascade and if this trophic cascade is proportional to the intensity of risk. In addition, our objective is test if life history characteristics (e.g., prey size), trophic level properties (e.g., growth efficiency), and ecosystem properties such as nutrient recycling rates can be affected by the predation risk gradient. We also developed a simple model simulation based on the Price equation (Price, 1970) attempting to show that individual-based process can be generalized under specific circumstances, therefore showing that experimental results can be generalized to natural systems.
2. Methods
The model system used in this study consisted of a linear food chain comprising three trophic levels, a predator (P), a consumer (C) and resources (R). We used individuals of Belostoma flumineum (giant waterbug) as predators and juvenile individuals (tadpoles) of Lithobates catesbeianus (American bullfrog) as consumers. The
periphytic community was used as resources. All individuals of Belostoma flumineum were collected at Imboassica lagoon, located in the city of Macaé-RJ, and were acclimatized in the laboratory for one day before the beginning of the experiment. All individuals of L. catesbeianus were born in the same mass of eggs acquired from an artificial pond. These individuals were also acclimatized for one day before the experiment. The periphytic community was established adding 15mg of NH4NO3 and 2.7 mg of KH2PO4 daily in the mesocosms, which had been filled with water for 30 days. Although
L. catesbeianus was introduced in tropical systems,
both B. flumineum and L. catesbeianus co-occur in temperate regions, and therefore we expected that both species share evolutionary histories. In addition, prey response to predators or predator cues may be a strongly conserved niche characteristic (Tolrian et al. 1999). For example, Moulton et al. (2010) found that Macrobrachium shrimp have a very strong negative trait effect on mayfly herbivores, although predation of the mayflies was rare.
The experiment was conducted in outdoor mesocosms of 500 L, allowing the manipulation of all organisms in conditions close to the natural system. Treatments consisted of 4 levels of predation risk replicated 3 times, resulting in 12 mesocosms. Treatment levels consisted of a control treatment (K), with no predator addition, and the remaining levels consisted of the addition of 1, 2 and 4 predators in each mesocosm. These densities were chosen is great variability in both temporal and spatial
scales in the dynamics of different systems (Levin, 1998). In addition, mechanisms operating at a specific organizational level in the biological scale can influence the properties of higher levels. As a result, the relationships among different levels of organization can only be apparent when multiple levels are evaluated together (Ovadia and Schmitz, 2002).
In this study we argue that the adaptive foraging of prey must be considered as a crucial mechanism that can be summarized and explicitly evaluated in any ecological community and should have a great impact on different properties of the ecosystem. This assertion is based on different arguments: First, the whole biotic part of an ecosystem can be represented as a chain of trophic interactions that themselves represent resources for other consumers (Lindeman, 1942). Second, prey adaptive foraging, especially from herbivores, can affect primary productivity rates through the selective consumption of specific species or thought the reduction in the time spent on foraging effort (Schmitz et al., 2004). Third, predators can affect not just prey biomass but also their diversity, the efficiency in the energy transference among trophic levels, organic matter decomposition and nutrient cycling (Peckarsky and McIntosh, 1998, Ngai and Srivastava, 2006). Finally, intermediate trophic levels, in general, must balance the trade-off between energy maximization and predation-risk minimization (Guariento, 2007); therefore, from the evolutionary point of view, every species subjected to predation risk must respond adaptively to the gains in fitness due to consumption and losses due to predation.
samples in a total carbon analyzer (TOC-Shimadzu 5000).
Prey biomass was determinedby comparing the initial average prey weight of each treatment with the average prey weight at the end of the experiment. With the joint values of preriphytic biomass removal and prey biomass gain, we also calculated prey growth efficiency for each treatment: we took the ratio of the difference in the average prey biomass at the beginning and the end of the experiment and multiplied it by prey total density, and divided this by the quantity of periphyton biomass removed in each treatment according to the following formula:
∆
= Prey Biomass x Prey Density
Eficiency(%) Cosumed Periphyton Biomass
where consumed periphyton biomass was calculated as the difference in periphyton biomass at the beginning and in the end of the experiment. During the experiment, we did not observe an increase in periphyton biomass in the tanks with no tadpoles, indicating a low turn-over rate of the periphyton biomass under experimental conditions.
Nutrient concentration in each mesocosm was measured periodically and kept at a constant ratio of 24:1 in terms of N:P concentrations. For the determination of tadpole excretion rates, we removed from each tank 3 random individuals of
L. catesbeianus at the end of the experiment and
placed them individually in plastic chambers with deionized water. After 1 hour these individuals were removed from the chambers and kept frozen for body nutrient content determination. Excretion rates were determined as the difference of the final and initial concentration of nutrients in each excretion chamber. Total particulate phosphorus from periphyton and tadpoles was analyzed after persulfate digestion in an autoclave following dissolved phosphate determination (Golterman et al., 1978). We expressed biomass P values according to sample dry weight, mg P / mg. Nitrogen determination was obtained by the same procedure but dissolved N was determined through a flux injection analysis (FIA). Biomass nitrogen content was also expressed in terms of sample dry weight, mg N / mg. The final concentrations of N and P in moles were used to determine C:N, C:P and N:P ratios.
We used linear regressions and an ANOVA, with the Tukey post-test, to evaluate statistical differences among treatments. In the linear regression model predator density was treated as a continuous variable. All tests were done using STATISTICA 8.0. The advantage of regression analysis over because they comprise the natural density of these
predators in Imboassica lagoon, and similar lagoons in the same geographic region, and are similar to densities used in previous experiments evaluating the consequences of predation risk (Peacor and Werner, 2001). In all treatments, 50 individuals of L. catesbeianus were added, establishing the
beginning of the experiment. For the periphyton sampling, we removed from each mesocosm plastic tiles with a defined area (0.025 m2), which were previously placed along the mesocosm wall. These plastic tiles were placed at the surface and 60 cm below water surface to encompass the whole depth profile of periphyton development. Before the beginning of the experiment, a random sampling showed no difference between top and bottom average periphyton biomass and among mesocosms (p > 0.05 Two-Way ANOVA for both factors). The experiment lasted for 2 weeks and during this period an additional set of mesocosms, with no tadpole addition, was evaluated and no significant difference was observed for the periphyton biomass between the beginning and the end of the experiment (p > 0.05 t-test). Individuals of B. flumineum were kept in cages within the mesocosms, where all individuals were fed daily with two individuals of L. catesbeianus. Therefore, any predation cues produced by predators were released inside the mesocosms but predators could not attack their prey, resulting in a condition where only predation risks were present and not the actual predation. At the end of the experiment, we recaptured all prey individuals added to each mesocosm to evaluate background mortality rates.
material to be detected in the analytical procedure. These results suggest that prey activity was intense in the bottom of the mesocosms but reduced by predator presence in the surface, exactly where predator cages were located.
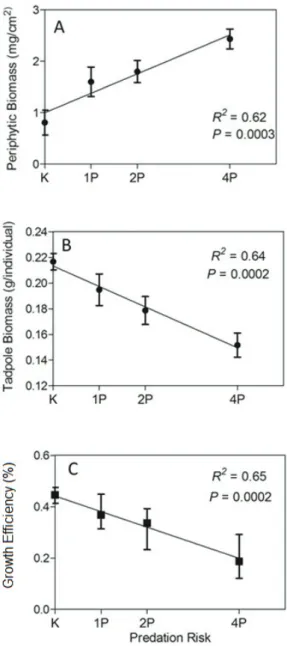
Prey biomass was also affected by the predation risk. Tadpoles biomass significantly decreased as a function of predation risk (p = 0.0002, R2 = 0.64, LR – Figure 2B). This result suggests that periphyton growth was negatively affected by predation risk. The results of growth efficiency rates suggest that ANOVA relies on the fact that a linear regression
also establishes a quantitative relationship among response and predictor variables (Cottingham et al., 2005) and therefore was used whenever the data fitted model assumptions; otherwise a ANOVA model was used and predator density was treated as a categorical factor.
2.1. Modelling
Attempting to show that individual-based process can be generalized under specific circumstances, we also developed a simple model simulation based on the Price equation (Price, 1970). The Price Equation is a covariance equation that describes the process of evolution by natural selection, and can be used to explain many ecological processes (Fox, 2006).
Let c’i be the average amount of the characteristic displayed by the offspring from group i. Denote the amount of change in characteristic in group i
by ∆ci defined by:
∆ =cidefc′i−ci
Now take c to be the average characteristic value in this population and c’ to be the average characteristic value in the next generation. Define the change in average characteristic by ∆c so that it can be described as follows:
def
c c c
∆ = −′
also take w to be the average fitness of this population. The Price equation can be described as:
( ) ( )
w c cov w ,c∆ = i i +E w , ci ∆ i
Where cov stands for covariance function and
E the expected mean. The second term of this equation can be abstracted in the simplified version of the Price Equation when the term ci does not differ from the parent generation.
3. Results
Periphytic biomass increased throughout the predation risk gradient, therefore, it was positively affected by predation risk (p = 0.0003, R2 = 0.62, Linear Regression (LR) – Figure 2A). However, even in the treatment with greatest predator density (i.e., 4 individuals), prey was able to remove 60% of initial periphyton biomass, approximately 6 mg/cm2. In treatments with no predators this removal was approximately 80%. These results are for the periphyton sampled in the surface of the mesocosms, bottom samples did not have enough
was basically driven by changes in prey foraging behavior, since herbivory rates were reduced at the top of the mesocosm, where predators were located. These results corroborate the results of previous studies from aquatic ecosystems (McIntosh and Peckarsky, 1996, Moulton et al. 2010) or even terrestrial ones (Beckerman et al., 1997), which shows that prey avoid foraging close to areas where predators or predation cues are present. It is important to note that any density effect on prey population can be excluded for the present experiment because all predators were incapable of killing their prey, and no background mortality was observed. However, even in treatments with the greatest density of predators there was a reduction in 60% of periphytic biomass, while in treatments with no predator this reduction was of 80%, showing that even though the strength of the trophic cascade is positively affected by predation risk this effect is generally weak. One of the explanations for this pattern is the fact that we used very young individuals of L. catesbeianus in the experiment. In terms of energy reserves, young individuals in the negative effect of predation risk on tadpole
biomass increased as the number of predators increased (p = 0.0003, R2 = 0.65, LR – Figure 2C). Therefore the reduction in the growth rate was even more pronounced in high predation risk conditions.
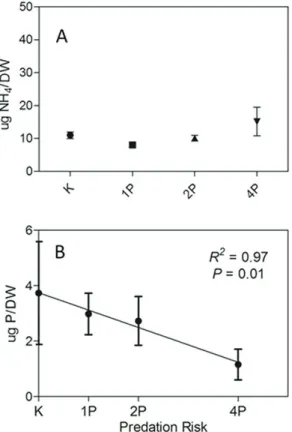
Prey excretion of NH3+ was not affected by the predation risk (p = 0.2, ANOVA – Figure 3A). We also did not observed a significant effect of predation risk on prey PO4- excretion rates (p = 0.48, ANOVA), however a strong trend of reduction of excretion rates could be observed through a linear regression analysis (p = 0.01, R2 = 0.97, LR – Figure 3B). However, this regression was significant only when mean values of each treatment are considered. The divergence between the ANOVA and the regression analysis relies on the huge variability within treatments of PO4- excretion samples, but the results suggest a negative relationship between P excretion rates and predation risk.
Periphytic biomass nutrient stoichiometry (C:N:P) was close to 201:28:1, which in terms of N:P ratio is close to the ratio of nutrient of the water column. The prey body nutrient content of C, N and P was not different along the predation risk gradient (p > 0.05, ANOVA – Figure 4), even though some results were marginally significant (e.g., P body content). The same pattern of no significant statistical difference was observed for C:N, C:P and N:P ratios (p > 0.05, ANOVA – Figure 4).
4. Discussion
The distinction between predation risk and actual predation is well established in theoretical and empirical studies of predator-prey interactions, but some classical examples may not follow this rule (Peckarsky et al., 2008). However, the implications of this distinction to the dynamics and structure of communities and ecosystems remains vastly neglected (Creel and Christianson, 2008). We observed in this study that trophic cascades can be mediated by predation risk and the strength of trophic cascades is proportional to the intensity of predation risk. The results show that the consequences from the risks induced by the predator was responsible for reducing prey growth rates, growth rate efficiency and prey nutrient recycling patterns. These results are evidences that consequences of predator-induced risk are not restricted to the individual level, and may have multiple consequences for ecosystem functioning, ranging from population to ecosystem level patterns.
We observed that prey reduced their herbivory rates when predators were present. This reduction
The classical view of trophic structure, determined by the energy transference among trophic levels, assumes that a constant fraction of energy that is consumed is consistently converted into biomass based on the ability of the consumer to incorporate resources, independent of the environmental context. This perspective implies that species in an ecosystem have fairly constant efficiencies (May, 1983). This study, however, showed that predation risk may change prey conversion efficiencies and biomass production, and thus can have great influence on the trophic structure and energy transference of food webs. We observed that biomass uptake by tadpoles, estimated from rates of periphytic biomass removal, declines more slowly than the biomass growth rates of tadpoles general are near to starvation limits (Luttbeg et al.,
2003) and, therefore, energy build-up is required. As a result, predators would exert little or no effect on prey foraging behavior. For example, if we compare the results from Beckerman et al. (1997) and Schmitz et al. (1997) in which both worked with grasshopper nymphs of the same species but at different ages, we can observe that the strength of behavioral mediated trophic cascades were greater for older nymphs. Another factor that supports these results is the fact that behavioral trophic cascades are weaker when resources are scarce (Werner and Anholt, 1993), or when intra-specific competition is high (Peacor and Werner, 2001); both factors constrain food acquisition and consequently increase their demand.
metabolic pathways other than growth. There is evidence that an increase in the metabolic cost related to high stress in response to predation risk may lead to reduced growth efficiencies. For example, mollusks (Mytilus edulis) exposed to the
presence of a predator (Nucella sp.) dramatically
increase their heartbeat (Rovero et al., 1999), which is directly linked to respiration rates. The stress-mediated predation risk can also lead to production of specific proteins, such as heat-shock proteins, which compromises the organism energy budget with the production of molecules unassociated with biomass production (Steinberg, 2011). Additionally, it was shown that predation risk can cause various morphological changes in prey (Relyea, 2001). In amphibians, such changes can result in reduced length of the intestinal tract, which in turn can decrease the rates of food absorption (Steiner, 2007).
The current knowledge about the relationship between nutrient limitation and consumer biomass suggest that C (carbon) is in excess, while N (nitrogen) and P (phosphorus) are the most limiting elements for herbivores (Hawlena and Schmitz, 2010). This conclusion is obtained from observations of the imbalance in the content of C relative to N and P between herbivores and primary producers. In coastal lagoons, P is generally one of the most limiting nutrients to primary productivity (Sundareshwar et al., 2003) and even secondary productivity (Guariento et al., 2011). Our results showed that the ortho-phosphate excretion by tadpoles decreased with increased predation risk, however there was no effect observed for the excretion of ammonium (i.e., nitrogen). These results can be explained by the limiting nature of P in these ecosystems. The values of the N: P ratio of the periphytic biomass was 28:1 and the N: P ratios for the body of the tadpoles were approximately 22:1, which shows that N is in excess when compared to P in the diet, corroborating the fact that P is a limiting factor for these consumers. Thus, the decrease in excretion rates of P with increased risk may reflect a decrease in the rate of acquisition of resources with increasing predation by decreasing the intake of a limiting element. In addition, the stress associated with predation may increase the organism´s demand for phosphorus due to an increased production of ribosomes to produce proteins related to stress (e.g., heat-shock proteins) (Makino et al., 2003). However, no significant differences were observed in the phosphorus biomass content of tadpoles along the predation-along the predation risk gradient. Thus, trophic
efficiency was affected by reduced growth efficiency. By reducing both the amount of embodied energy and biomass converting rates, predators effectively and directly reduce the energy available to the next lower trophic level without that level being actually consumed. As a consequence, predation risk can affect the size of food webs by restricting the flow of energy (Trussell et al., 2006). This hypothesis has been used to explain, for example, why trophic chains in rocky shores are so short, since behavioral responses to predation is an ubiquitous feature in these communities (Dalziel and Boulding, 2005). Coastal lagoons and shallow lakes generally have short food chains (Scheffer et al., 2006) which may be due to low productivity (Karlsson et al., 2009) or even due to indirect effects of the size of these ecosystems. Post et al. (2000) argues that one explanation for the lower number of trophic levels in aquatic environments is the absence of prey refuges due to its small size. However, Post et al. (2000) presents a perspective focused primarily on the effects mediated by density to support his argument. The lowest number of refugees in a small environment can increase the chances of encountering between predator and prey, making it less possible for the prey to escape predation, a factor that increases the actual perception of predation risk by prey. Therefore, a hypothesis that can be explored in future studies is that the lowest number of trophic levels in small systems (e.g. coastal or temporary lakes) may be a result of higher predation risk experienced by prey in these habitats.
Previous studies of the trade-off between foraging and predation risk of stoneflies revealed that differences between species growth rates could not be explained by differences in the amount of food consumed (McPeek et al., 2001). For instance, Eastern Forktail (Ischnura verticalis) grew faster in the presence of predators than Azure Bluet (Enallagma aspersum) because the former was more efficient in converting food into biomass. This increased conversion rate is explained by the fact
due to higher food acquisition. Individual fitness wi
by the model equation is given by:
wi= −xbi+zbi
where bi is a measure of foraging effort, the xbiterm is the decrease in fitness due to increased predation probability and zbi is the increase in fitness due to increased food acquisition. Let us assume that both
x and z are greater than zero. From the simplified version of the Price Equation, the amount of change of the behavioral trait (b) among generations can be given by:
( )
w b cov w ,b∆ = i i
(
)
b cov w w ,bi i
∆ =
( ) ( )
b z x var bi
∆ = −
where var(bi) is the variance of (bi), which is the covariance of bi with itself.
( ) def
( )
2 ( )2var bi →E bi −E bi
It can be seen from this simple model that the foraging effort will change among generations until it becomes uniform among individuals. If bi is not
uniform, this value would increase if (z-x) is positive,
the fitness gain from food acquisition is greater than the fitness loss from predation, or decrease if (z-x)
is negative, the fitness gain from food acquisition is lower than the fitness loss from predation. In other words, If there are individuals with different efforts in the population (i.e.,var(bi) not equal to zero) the average effort would decrease to the lowest if (z-x) is negative or increase to the largest if (z-x) is positive.
The main conclusion from this mathematical formulation is that if we consider the behavioral trait that governs prey foraging effort, or any other foraging feature, as determinant to prey fitness, the population in equilibrium should evolve to have a similar trait value, assuming stability of environmental conditions. Therefore, although prey individuals would have different responses to predator presence, the results obtained from small-scale experiments, using only a subset of the total population, can be generalized to the ecosystem if the same evolutionary constraints are conserved among experimental and natural conditions, such as the trade-off between energy uptake and predation risk. Actually, the most important feature is whether the trade-off between foraging and predation risk is truly an important selective pressure for prey populations. We argue that this is a very plausible risk gradient, even though previous studies have
indicated changes in the stoichiometry of the body of animals subject to predation risk (Hawlena and Schmitz, 2010). Although the notion that consumers are strictly homeostatic, i.e., they do not vary regardless of their nutritional content, has been contested (Guariento et al., 2011), there is a very large phylogenetic variation in the level of homeostasis observed in each taxon. Most studies that have looked at the effects of predation risk on the stoichiometry of prey have mostly used invertebrates as intermediate consumers. Indeed, invertebrates in general have a much larger variation in body stoichiometry due to nutritional or other physiological restrictions (Persson et al., 2010). Hawlena and Schmitz (2010) showed that predation risk reduced by 6% the N content of grasshoppers which led to an increase in C: N ratio of the body and a concomitant increase of 7% in the C: N ratio of fecal debris entering the detritus chain. Our results show that predation risk can have an important effect on nutrient flow and nutrient recycling patterns within ecosystems, however the effect on prey body stoichiometry may depend on prey phylogeny, especially that which is associated with prey overall homeostasis, which is more evident in vertebrates such as amphibians.
We have shown up until this point that individual processes, such as prey behavioral changes, can be linked to higher-order patterns, such as trophic cascades and nutrient recycling rates, but should all individuals in a population behave the same, or at least respond in the same way to a common interference? Can we generalize these experimental finding to natural populations in natural systems? Individuals within a population are not equal, they have personalities, genetic and epigenetic differences, and all these differences could make individuals respond differently to a common interference (Wolf and Weissing, 2012). To address this problem, we attempt to show, through a very simple and straightforward mathematical formulation based on the Price equation, that in equilibrium all individuals should behave the same in a homogeneous selective scenario.
To exemplify this question we will assume the situation where a prey must choose a strategy that balances the energy uptake and predation risk. The behavioral trait bi will be defined as a genetic
and that they may play an important role in overall ecosystem functioning. The mechanisms behind trophic cascades and other indirect predator effects have profound implications on the types of mathematical models of dynamic communities currently used to generate predictions about the dynamics of food webs. However, the predictability of the dynamics of food webs is based primarily on assumptions of density-mediated effects (Yodzis, 1996), which therefore, according to our results, weakens its power of generalization and accuracy. Overall, community ecologists accept the idea that trophic interactions are controlled by the interaction of bottom-up (nutrient availability) and top-down (predation) mechanisms. However, ecosystem ecologists are more reluctant to accept this formalization, preferring the dominance of bottom-up mechanisms in the regulation of ecosystem processes, such as nutrient cycling (Shurin et al., 2006). This study shows that prey behavioral responses to the risk imposed by predators can restrict the flow of energy and nutrients along the food chain and reduce the removal of autotrophic biomass. Therefore the risk of being killed can have several consequences to prey and consequently to the ecosystems, not being restricted to a narrow set (i.e. population level) of responses. These findings can help integrate ecosystem dynamics and animal behavior, highlighting that not only bottom-up but also top-down mechanisms are responsible for determining ecosystem properties. At last, this study provides evidence that prey adaptive foraging may serve to integrate ecosystem and evolutionary ecology, resulting in the development of a more robust and predictive theory of the functioning of aquatic ecosystems.
Acknowledgments
The Brazilian Council of Scientific and Technological Development (CNPq) financially supported this study. The authors are grateful to two anonymous reviewers who greatly improved an earlier version of the manuscript. RDG receives a fellowship of CAPES Project Nº 063/2013.
References
ABRAMS, P. 2000. The Evolution of Predator-Prey Interactions: Theory and Evidence. Annual Review of Ecology and Systematics, vol. 31, p. 79-105. http:// dx.doi.org/10.1146/annurev.ecolsys.31.1.79 BECKERMAN, AP., URIARTE, M. and SCHMITZ,
OJ. 1997. Experimental evidence for a behavior-mediated trophic cascade in a terrestrial food chain. assumption because of three key aspects. First,
predation is omnipresent. There are very few food-webs without predators in nature. Second, prey just die once. All prey expected future reproduction goes to zero if a predator captures and kill its prey, therefore, avoid predation is fundamental to prey fitness (Houston and McNamara, 1999). Finally, avoidance of predation generates costs (Creel and Christianson, 2008) and prey would not exhibit a reduction in their energy income through investing in vigilance or any other defense strategy if it was not essential. Although, we cannot presume the overall magnitude of behaviorally mediated effects in natural ecosystems from experimental results, even though it has been proven to be preeminent (Schmitz et al., 2004), at least the occurrence of the mechanisms behind trait effects in experimental conditions can be expected to occur in natural populations. A research program that combines largely reductionist laboratory and field studies can provide complementary insights that enable the scaling from individual-level behavior and physiology to whole-ecosystem functioning (Hawlena and Schmitz, 2010). On the other hand, Peacor et al. (2013) showed that a condition for strong non-consumptive effects is a large fitness cost of having an anti-predator trait. This would be equivalent to a large parameter x in our model. Therefore as long as a trait is noticeably large, behavioral trait mediated effects are likely if the costs of have such a trait are also large. It is reasonable to expect that the environment is not stable and that genotypic divergences in a population would be always present due to mutation and immigration. However, as presented here, is not unreasonable to expect that all individuals in a prey population would present a similar response to predation since it turns out to be a fundamental component of prey fitness.
5. Conclusion
HOUSTON, AI. and MCNAMARA, JM. 1999.
Models of Adaptive Behavior. Cambridge University Press. 387 p.
KARLSSON, J., BYSTROM, P., ASK, J., ASK, P., PERSSON, L. and JANSSON, M. 2009. Light limitation of nutrient-poor lake ecosystems. Nature, vol. 460, no. 7254, p. 506-509. PMid:19626113. http://dx.doi.org/10.1038/nature08179
LEVIN, SA. 1998. Ecosystems and the Biosphere as Complex Adaptive Systems. Annual Review of Ecology and Systematics, vol. 1, p. 431-436.
LINDEMAN, RL. 1942. The trophic-dynamic aspect of ecology. Ecology, vol. 23, p. 399-418. http://dx.doi. org/10.2307/1930126
LUTTBEG, B., ROWE, L. and MANGEL, M. 2003. Prey state and experimental design affect relative size of trait-and density-mediated indirect effects.
Ecology, vol. 84, no. 5, p. 1140-1150. http://dx.doi. org/10.1890/0012-9658(2003)084[1140:PSAED A]2.0.CO;2
MATTHEWS, B., NARWANI, A., HAUSCH, S., NONAKA, E., PETER, H., YAMAMICHI, M. and SULLAM, KE. 2011. Toward an integration of evolutionary biology and ecosystem science.
Ecolog y Letters, vol. 14, no. 7, p. 690-701. PMid:21554512. http://dx.doi.org/10.1111/j.1461-0248.2011.01627.x
MAY, R. 1983. The structure of food webs.
Nature, vol. 301, p. 566-568. http://dx.doi. org/10.1038/301566a0
MAKINO, W., COTNER, JB., STERNER, RW. and ELSER, JJ. 2003. Are bacteria more like plants or animals? Growth rate and resource dependence of bacterial C:N:P stoichiometry. Functional Ecology, vol. 17, no. 1, p. 121-130. http://dx.doi. org/10.1046/j.1365-2435.2003.00712.x
MCINTOSH, A. and PECKARSKY, B. 1996. Differential behavioral responses of mayflies from streams with and without fish to trout odour.
Freshwater Biology, vol. 35, no. 1, p. 141-148. http:// dx.doi.org/10.1046/j.1365-2427.1996.00489.x McPEEK, M., GRACE, M. and RICHARDISON,
M. 2001. Physiological and behavioral responses to predator shape the growth/predation risk trade-off in damselfly. Ecology, vol. 82, p. 1535-1545. http:// dx.doi.org/10.1890/0012-9658(2001)082[1535:PA BRTP]2.0.CO;2
MOULTON, TP., SOUZA, ML., SILVEIRA, RML., KRSULOVIĆ, FAM., SILVEIRA, MP., ASSIS, JCF. and FRANCISCHETTI, CN. 2010. Patterns of periphyton are determined by cascading trophic relationships in two neotropical stre-ams. Marine Freshwater Research, vol. 61, no. 1, p. 57-64. http:// dx.doi.org/10.1071/MF08326
Proceedings of the National Academy of Sciences of the United States of America, vol. 94, p. 10735-10738. PMid:11038581 PMCid:PMC23467.
COTTINGHAM, K., LENNON, J. and BROWN, B. 2005. Knowing when to draw the line: designing more informative ecological experiments.
Frontiers in Ecology and Evolution, vol. 3, no. 3, p. 145-152. http://dx.doi.org/10.1890/1540-9295(2005)003[0145:KWTDTL]2.0.CO;2 CREEL, S. and CHRISTIANSON, D. 2008.
Relationships between direct predation and risk effects. Trends in ecology and evolution, vol. 23, no. 4, p. 194-201. PMid:18308423. http://dx.doi. org/10.1016/j.tree.2007.12.004
DALZIEL, B. and BOULDING, E. 2005. Water-borne cues from a shell-crushing predator induce a more massive shell in experimental populations of an intertidal snail. Journal of Experimental Ecology and Biology, vol. 317, p. 25-35. http://dx.doi. org/10.1016/j.jembe.2004.11.015
FOX, JW. 2006. Using the Price Equation to partition the effects of biodiversity loss on ecosystem function.
Ecology, vol. 87, p. 2687-2696. http://dx.doi. org/10.1890/0012-9658(2006)87[2687:UTPETP ]2.0.CO;2
GOLTERMAN, HL., CLYMO, RS. and OHMSTAD, MAM. 1978. Methods for physical and chemical analysis of freshwaters. Oxford: Blackwell Scientific Publisher. 214 p.
GUARIENTO, RD. 2007. O papel do comportamento na ocorrência de cascatas tróficas. Oecologia Brasiliensis, vol. 11, no. 4, p. 590-600. http://dx.doi. org/10.4257/oeco.2007.1104.11
GUARIENTO, RD., CARNEIRO, LS., CALIMAN, A., LEAL, JJF., BOZELLI, RL. and ESTEVES, FA. 2011. Food web architecture and basal resources Interact to Determine Biomass and Stoichiometric Cascades along a Benthic Food Web. (T. N. ROMANUK, Ed.).
PLoS ONE, vol. 6, no. 7, p. e22205.
GRUNER, DS., SMITH, JE., SEABLOOM, EW., SANDIN, SA., NGAI, JT., HILLEBRAND, H. and HARPOLE, WS. 2008. A cross-system synthesis of consumer and nutrient resource control on producer biomass. Ecology letters, vol. 11, no. 7, p. 740-55. PMid:18445030. http://dx.doi.org/10.1111/j.1461-0248.2008.01192.x
HAWLENA, D. and SCHMITZ, OJ. 2010. Herbivore physiological response to predation risk and implications for ecosystem nutrient dynamics.
Predators. Ecology, vol. 82, no. 2, p. 523. http:// dx.doi.org/10.1890/0012-9658(2001)082[0523:MA BPOL]2.0.CO;2
ROVERO, F., HUGHES, R. and CHELAZZI, G. 1999. Cardiac and behavioral responses of mussels to risk of predation by dogwhelks. Animal Behaviour, vol. 58, p. 707-714. PMid:10512643. http://dx.doi. org/10.1006/anbe.1999.1176
SCHEFFER, M., VAN GEEST, GJ., ZIMMER, K., JEPPESEN, E., SØNDERGAARD, M., BUTLER, MG. and HANSON, MA. 2006. Small habitat size and isolation can promote species richness: second-order effects on biodiversity in shallow lakes and ponds. Oikos, vol. 112, no. 1, p. 227-231. http:// dx.doi.org/10.1111/j.0030-1299.2006.14145.x SCHMITZ, OJ. 2010. Resolving Ecosystem Complexity.
Princeton University Press. 176 p.
SCHMITZ, OJ., BECKERMAN, AP. and O’BRIEN, KM. 1997. Behaviorally mediated trophic cascades: effects of predation risk on food web interactions.
Ecology, vol. 78, no. 5, p. 1388-1399. http://dx.doi. org/10.1890/0012-9658(1997)078[1388:BMTCE O]2.0.CO;2
SCHMITZ, OJ., KRIVAN, V. and OVADIA, O. 2004. Trophic cascades: the primacy of trait-mediated indirect interactions. Ecology Letters, vol. 7, no. 2, p. 153-163. http://dx.doi.org/10.1111/j.1461-0248.2003.00560.x
SCHMITZ, OJ., GRABOWSKI, JH., PECKARSKY, BL., PREISSER, E., TRUSSELL, GC. and VONESH, JR. 2008. From individuals to ecosystem function: toward an integration of evolutionary and ecosystem ecology. Ecology, vol. 89, no. 9, p. 2436-45. PMid:18831165. http://dx.doi.org/10.1890/07-1030.1
SHURIN, JB., GRUNER, DS. and HILLEBRAND, H. 2006. All wet or dried up? Real differences between aquatic and terrestrial food webs. Proceedings of the Royal Society B: Biological Sciences, vol. 273, no. 1582.
STEINBERG, C. 2011. Stress Ecology: Environmental Stress as Ecological Driving Force and Key Player in Evolution. Berlin: Springer-Verlag. 418 p.
STEINER, U. 2007. Linking antipredator behaviour, ingestion, gut evacuation and costs of predator-induced responses in tadpoles. Animal Behavior, vol. 74, no. 5, p. 1473-1479. http://dx.doi. org/10.1016/j.anbehav.2007.02.016
STOKS, R., DE BLOCK, M. and MCPEEK, M. 2005. Alternative growth and energy storage response to mortality threats in damselfly. Ecology Letters, vol. 8, p. 1307-1316. http://dx.doi.org/10.1111/j.1461-0248.2005.00840.x
NGAI, JT. and SRIVASTAVA, DS. 2006. Predators accelerate nutrient cycling in a bromeliad ecosystem.
Science, vol. 314, no. 5801, p. 963. PMid:17095695. http://dx.doi.org/10.1126/science.1132598 OVADIA, O. and SCHMITZ, OJ. 2002. Linking
individuals with ecosystems: Experimentally identifying the relevant organizational scale for predicting trophic abundances. Proceedings of the National Academy of Sciences of the United States of America, vol. 99, no. 20, p. 12927-12931. PMid:12232041 PMCid:PMC130562. http:// dx.doi.org/10.1073/pnas.192245499
PEACOR, SD. and WERNER, EE. 2001. The contribution of trait-mediated indirect effects to the net effects of a predator. Proceedings of the National Academy of Sciences of the United States of America, vol. 98, no. 7, p. 3904-8. PMid:11259674 PMCid:PMC31151.
PEACOR, SD., PECKASKY, BL., TRUSSEL, GC. and VONESH, JR. 2013. Costs of predator-induced phenotypic plasticity: a graphical model for predicting the contribution of non-consumptive and consumptive effects of predators on preys. Oecologia,
vol. 171, p. 1-10.
PETCHEY, OL. and GASTON, KJ. 2006. Functional diversity: back to basics and looking forward. Ecology Letters, vol. 9, p. 741-758. PMid:16706917. http:// dx.doi.org/10.1111/j.1461-0248.2006.00924.x PECKARSKY, BL. and MCINTOSH, AR. 1998. Fitness
and community consequences of avoiding multiple predators. Oecologia, vol. 113, p. 565-576. http:// dx.doi.org/10.1007/s004420050410
PECKARSKY, BL., ABRAMS, PPA., BOLNICK, DI., DILL, LM., GRABOWSKI, JH., LUTTBEG, B. and ORROCK, JL. 2008. Revisiting the classics: considering non-consumptive effects in textbook examples of predator-prey interactions. Ecology, vol. 89, no. 9, p. 2416-25. PMid:18831163. http:// dx.doi.org/10.1890/07-1131.1
PERSSON, J., FINK, P., GOTO, A., HOOD, J., JONAS, J. and KATO, S. 2010. To be or not to be what you eat: regulation of stoichiometric homeostasis among autotrophs and heterotrophs.
Oikos, vol. 119, no. 5, p. 741-751. http://dx.doi. org/10.1111/j.1600-0706.2009.18545.x
POST, DM., PACE, ML. and HAIRSTON, N. 2000. Ecosystem size determines food-chain length in lakes.
Nature, vol. 405, p. 1047-1049. PMid:10890443. http://dx.doi.org/10.1038/35016565
PRICE, GR. 1970. Selection and covariance. Nature, vol. 227, no. 5257, p. 520-521. PMid:5428476. http://dx.doi.org/10.1038/227520a0
YODZIS, P. 1996 Food webs and perturbation experiments: theory and practice. In POLIS, G. and WINEMILLER, K. Food Webs in Theory and Practice.
New York: Chapmanand Hall. p. 192-200.
WERNER, W. and ANHOLT, B. 1993. Ecological consequences of the trade-off between growth and mortality rates mediated by foraging activity.
American Naturalist, vol. 142, no. 2, p. 242-272. PMid:19425978. http://dx.doi.org/10.1086/285537 WOLF, M. and WEISSING, FJ. 2012. Animal
personalities: consequences for ecology and evolution.
Trends in Ecology and Evolution, vol. 27, no. 8, p. 452-461. PMid:22727728. http://dx.doi.org/10.1016/j. tree.2012.05.001
Received: 10 April 2013 Accepted: 01 November 2013 SUNDARESHWAR, PV., MORRIS, JT., KOEPFLER,
EK. and FORNWALT, B. 2003. Phosphorus limitation of coastal ecosystem processes. Science, vol. 299, p. 563-565. PMid:12543975. http://dx.doi. org/10.1126/science.1079100
TOLRIAN, R., HARVELL, C. and DREW, ED. 1999.
The Ecology and Evolution of Inducible Defenses. New Jersey: Princeton Univ Pr. Ewing. 395 p.