The Brazilian Journal of
INFECTIOUS DISEASES
w w w . e l s e v i e r . c o m / l o c a t e / b j i d
Original article
Virologic and immunologic effectiveness of darunavir-based
salvage therapy in HIV-1-infected adults in a Brazilian
clinical practice setting: results of a multicenter and
retrospective cohort study
Karina Mota Ribeiro
a,∗, Fernando Martin Biscione
b, Mateus Rodrigues Westin
a,b,
Danielle Pessoa Machado
b, Dirceu Bartolomeu Greco
a,b, Unaí Tupinambás
a,baPostgraduate Program on Health Sciences: Infectious Diseases and Tropical Medicine, Federal University of Minas Gerais,
Belo Horizonte, MG, Brazil
bSchool of Medicine, Federal University of Minas Gerais, Belo Horizonte, MG, Brazil
a r t i c l e
i n f o
Article history:
Received 29 January 2013 Accepted 17 April 2013 Available online 31 July 2013
Keywords:
HIV-1
Highly active antiretroviral therapy Salvage therapy
Multiple viral drug resistance Genotyping techniques
a b s t r a c t
Background:Darunavir has been proven efficacious for antiretroviral-experienced HIV-1-infected patients in randomized trials. However, effectiveness of darunavir-based salvage therapy is understudied in routine care in Brazil.
Methods:Retrospective cohort study of HIV-1-infected patients from three public refer-ral centers in Belo Horizonte, who received a darunavir-based therapy between 2008 and 2010, after virologic failure. Primary endpoint was the proportion of patients with viral load < 50 copies/mL at week 48. Change in CD4 cell count was also evaluated. Outcome measures were analyzed on an intent-to-treat basis applied to observational studies. Sensi-tivity analysis was conducted to evaluate the impact of missing data at week 48. Predictors of virologic failure were examined using rare-event, finite sample, bias-corrected logistic regression.
Results:Among 108 patients, the median age was 44.2 years, and 72.2% were male. They had long-standing HIV-1 infection (median 11.6 years) and advanced disease (76.9% had an AIDS-defining event). All patients had previously received protease inhibitors and nucleo-side reverse transcriptase inhibitors, 75% nonnucleonucleo-side reverse transcriptase inhibitors, and 4.6% enfuvirtide. The median length of protease inhibitor use was 8.9 years, and 90.8% of patients had prior exposure to unboosted protease inhibitor. Genotypic resistance pro-file showed a median of three primary protease inhibitor mutations and 10.2% had three or more darunavir resistance-associated mutations. Virologic success at week 48 was achieved by 78.7% (95% CI = 69.7–86%) of patients and mean CD4 cell count increase from baseline was 131.5 cells/L (95% CI = 103.4–159.6). In multiple logistic regression analysis, higher baseline
viral load (RR = 1.04 per 10,000 copies/mL increase; 95% CI = 1.01–1.09) and higher number of darunavir resistance-associated mutations (RR = 1.23 per each; 95% CI = 0.95–1.48) were independently associated with virologic failure.
∗ Corresponding author at: Federal University of Minas Gerais, School of Medicine Belo Horizonte, Minas Gerais, Brazil. E-mail address: [email protected] (K.M. Ribeiro).
Conclusion: Virologic suppression is a realistic endpoint for most treatment-experienced patients who begin a darunavir-based therapy outside the controlled conditions of a ran-domized trial, at routine care settings.
© 2013 Elsevier Editora Ltda. All rights reserved.
Introduction
The improved potency and tolerability of antiretroviral (ARV) drugs and the accumulated knowledge about their ideal com-bination enabled a higher proportion of long-term virologic suppression in randomized clinical trials of initial ARV ther-apy (ART) in HIV-1-infected patients.1–5 Cohort studies also
showed an increased virologic response with initial ART, evidencing the applicability of clinical trials results to the clin-ical practice.6,7Additionally, studies that analyzed clinical
out-comes of initial ART found no significant divergence between efficacy in clinical trials and effectiveness in routine care.8,9
There is cumulative evidence from randomized trials that treatment of ARV-experienced patients with third-line drugs is efficacious.10–14 However, salvage therapy remains
understudied in routine clinical care, especially in low- and middle-income countries.15–19 Therefore, it is important to
ascertain clinical outcomes of third-line drugs outside the controlled conditions of a randomized trial and in the Brazil-ian context. In this study, we assessed virologic, immunologic, and clinical outcomes of ARV-experienced patients who ini-tiated darunavir (DRV)-based salvage therapy in routine care settings. We also analyzed risk factors associated with viro-logic failure.
Materials and methods
We conducted a retrospective cohort study to evaluate viro-logic and immunoviro-logic response and risk factors for viroviro-logic failure in patients from three public referral centers (one ter-tiary center and two secondary centers) for HIV treatment in Belo Horizonte, Brazil, failing ART (viral load≥50 copies/mL)
and that started a DRV-based regimen between 2008 and 2010. Adult patients (≥18 years) on regular follow-up and with a HIV-1 drug-resistant virus (at least HIV-1 primary protease inhibitor mutation) and/or a treatment history of unboosted protease inhibitor in a failing regimen were eligible. Patients without a genotyping test performed in the 18 months prior to DRV-based therapy and those who received etravirine, tipranavir, maraviroc or vicriviroc concurrently with DRV were excluded, as these drugs were not then available through the Brazilian Public Health Care System.
Patient clinical charts were reviewed to gather data about demographic characteristics, baseline and nadir CD4 cell count, baseline and highest viral load, ART history, cumu-lative genotype, and optimized background therapy (OBT). The cumulative genotype was obtained by summing up all the resistance mutations detected in the latest and histori-cal genotyping resistance tests.20,21ARV resistance mutations
were defined according to the December 2009 International AIDS Society-USA (IAS-USA) list.22 The genotypic sensitivity
was based on the Brazilian Algorithm for Interpretation of
HIV-1 Genotype – version 10 (www.aids.gov.br), that assigned three levels of drug resistance: susceptible (S), intermediate-level resistance (I) or high-intermediate-level resistance (R). To assess the number of active drugs in the DRV-based therapy, a genotypic sensitivity score was calculated by assigning a score for each drug, based on the level of viral resistance (i.e., of 1 to S, 0.5 to I and 0 to R) and then adding up the scores. Raltegravir and enfuvirtide were considered fully active drugs (S) except for patients with previous use in a failing regimen.17
Primary endpoint was the proportion of patients with viral load < 50 copies/mL at week 48 (±4 weeks). Secondary end-points were changes from baseline in CD4 cell counts, and the proportion of patients who experienced an AIDS-defining event or death. Analysis was conducted on an intent-to-treat basis applied to observational studies.23The following were
considered treatment failures if they occurred before week 52: patient death, DRV interruption for any cause, or any change in the OBT resulting in higher antiviral activity. For virologic endpoint, these patients were considered as virologic failures and for the immunologic endpoint, changes from baseline CD4 cell counts were considered as being zero. For all other situations with missing viral load and/or CD4 cell count at week 48 (±4), two strategies for data analysis were adopted. In strategy 1, the first available information after week 52 was carried backward and, when the latter was unavailable, the last observation before week 44 was carried forward. As for strategy 2, last observation before week 44 was carried forward and any available information after week 52 was ignored.
In the descriptive analysis, values of qualitative variables were expressed in terms of absolute and relative frequencies, and values of numerical variables as median, 25th and 75th percentiles. The Kolmogorov–Smirnov test and visual inspec-tion of histograms were used to test the normal distribuinspec-tion of quantitative data. Differences in the distribution of numerical variables between baseline and week 48 (±4) were analyzed by the Wilcoxon test.
In univariate analysis of unmatched groups, categorical data were compared using analysis of contingency tables and chi-square test or Fisher exact test, as appropriate; numerical variables were compared using the Mann–Whitney U-test. Multiple regression analysis of factors associated with viro-logic failure was conducted using logistic regression models with backward manual elimination of variables. Candidate variables were those associated with virologic failure with a p-value≤0.3 in the univariate analysis, as well as those with high clinical relevance, irrespective of their statistical significance. Variables with a p-value≤0.1 and those with
available in the same macro, were used to estimate the effect sizes of variables in terms of relative risks instead of odds ratios.
Statistical analyses were performed with Stata for Win-dows (version 11.2, StataCorp, College Station, TX).
This study was conducted in accordance with Resolution 196/96 of the Brazilian National Research Ethics Commission (CONEP) and had the approval by the Research Ethics Commit-tees of each participating center.
Results
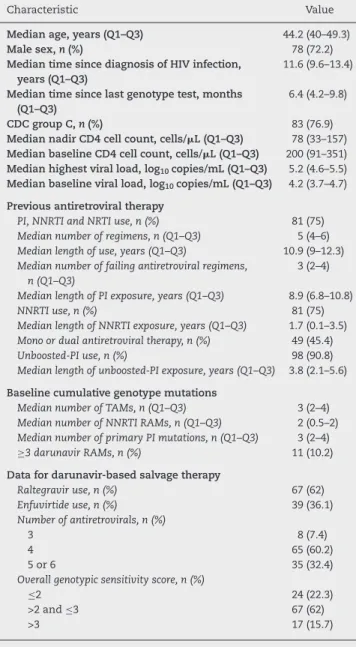
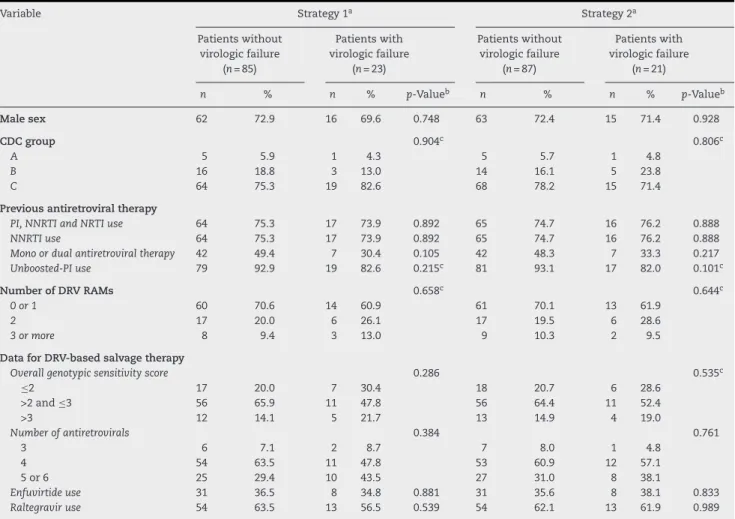
Overall, 108 patients met inclusion criteria and were eligi-ble for analysis. Demographic and baseline characteristics are described in Table 1. Most were male adults from Belo Horizonte metropolitan area (86.1%). They had long-standing HIV-1 infection and advanced disease, as confirmed by the high proportion of past AIDS-defining events and low nadir CD4 cell count. Patients also had an extensive ART history with a significant exposure to unboosted protease inhibitor (90.8%); still, only 10.2% had three or more DRV resistance-associated mutations (RAMs). Among those who received a DRV-based therapy, raltegravir association was common and most patients had more than two fully active drugs (77.7%).
At week 48, virologic success (viral load < 50 copies/mL) was achieved by 85 patients (78.7%; 95% CI = 69.7–86%) according to strategy 1 for handling missing data, and by 87 patients (80.6%; 95% CI = 71.8–87.5%) according to strategy 2. In strat-egy 1 analysis, 56.5% had a viral load available after week 52 carried backward and 8.3% had a viral load available before week 44 carried forward; 66.7% of the latter were from week 36 or after. In strategy 2, 63% had a viral load avail-able before week 44 carried forward and 79.4% were from week 36 or after. Mean CD4 cell count increase from baseline was 131.5 cells/L (95% CI = 103.4–159.6;p< 0.001) considering
strategy 1 and 107.7 cells/L (95% CI = 83.5–131.9;p< 0.001) for
strategy 2.
Seven patients (6.5%) were diagnosed with eight AIDS-defining events before week 52: Candidaesophagitis (n= 2),
Pneumocystispneumonia (n= 2), and one case each of recur-rent pneumonia, Cryptococcus meningoencephalitis, extra-pulmonary tuberculosis, and non-Hodgkin B-cell lymphoma. One patient was diagnosed with visceral leishmaniasis. Up to week 52, three patients (2.8%) died. Two of them had previously been diagnosed with opportunistic infections ( Pneumocys-tis pneumonia and Cryptococcus meningoencephalitis). One patient withdrew DRV before week 52 to avoid drug interac-tion with rifampin, prescribed for confirmed extrapulmonary tuberculosis.
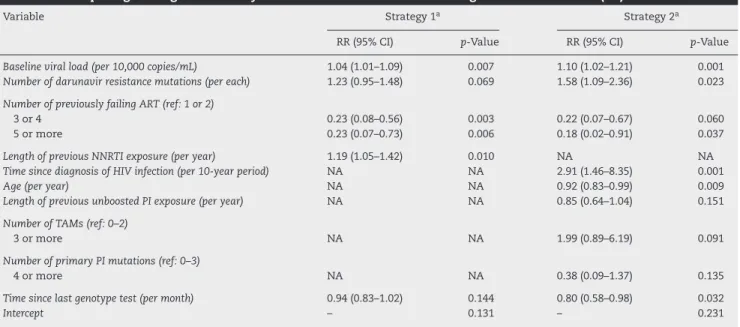
In univariate analysis, considering both strategies for handling missing data, higher baseline viral load, higher viral load at anytime, lower nadir CD4 cell count, and lower number of previous failing ARTs were independently associated with virologic failure (Tables 2 and 3). In multiple logistic regression models, irrespective of the strategy for handling missing data, higher viral load and higher number of DRV-RAMs were predic-tive of virologic failure. Conversely, use of a higher number of previous failing ARTs was associated with virologic success.
Table 1 – Demographic and baseline characteristics of patients.
Characteristic Value
Median age, years (Q1–Q3) 44.2 (40–49.3)
Male sex,n(%) 78 (72.2)
Median time since diagnosis of HIV infection, years (Q1–Q3)
11.6 (9.6–13.4)
Median time since last genotype test, months (Q1–Q3)
6.4 (4.2–9.8)
CDC group C,n(%) 83 (76.9)
Median nadir CD4 cell count, cells/L (Q1–Q3) 78 (33–157) Median baseline CD4 cell count, cells/L (Q1–Q3) 200 (91–351) Median highest viral load, log10copies/mL (Q1–Q3) 5.2 (4.6–5.5)
Median baseline viral load, log10copies/mL (Q1–Q3) 4.2 (3.7–4.7)
Previous antiretroviral therapy
PI, NNRTI and NRTI use, n (%) 81 (75) Median number of regimens, n (Q1–Q3) 5 (4–6) Median length of use, years (Q1–Q3) 10.9 (9–12.3) Median number of failing antiretroviral regimens,
n (Q1–Q3)
3 (2–4)
Median length of PI exposure, years (Q1–Q3) 8.9 (6.8–10.8) NNRTI use, n (%) 81 (75) Median length of NNRTI exposure, years (Q1–Q3) 1.7 (0.1–3.5) Mono or dual antiretroviral therapy, n (%) 49 (45.4) Unboosted-PI use, n (%) 98 (90.8) Median length of unboosted-PI exposure, years (Q1–Q3) 3.8 (2.1–5.6)
Baseline cumulative genotype mutations
Median number of TAMs, n (Q1–Q3) 3 (2–4) Median number of NNRTI RAMs, n (Q1–Q3) 2 (0.5–2) Median number of primary PI mutations, n (Q1–Q3) 3 (2–4) ≥3 darunavir RAMs, n (%) 11 (10.2)
Data for darunavir-based salvage therapy
Raltegravir use, n (%) 67 (62) Enfuvirtide use, n (%) 39 (36.1) Number of antiretrovirals, n (%)
3 8 (7.4)
4 65 (60.2)
5 or 6 35 (32.4)
Overall genotypic sensitivity score, n (%)
≤2 24 (22.3)
>2 and≤3 67 (62)
>3 17 (15.7)
Q1–Q3, 25th and 75th percentiles; CDC, Center for Disease Con-trol and Prevention; PI, protease inhibitor; NRTI, nucleoside reverse transcriptase inhibitor; NNRTI, nonnucleoside reverse transcriptase inhibitor; RAMs, resistance-associated mutations; TAM, thymidine-associated mutation.
Other variables associated with virologic failure were longer exposure to nonnucleoside reverse transcriptase inhibitors (NNRTI), longer time since HIV diagnosis, younger age, and shorter time since last genotype test, although their signifi-cance was more sensible to the strategy for handling missing data (Table 4).
Table 2 – Comparison of baseline patient characteristics (categorical data), according to virologic failure at week 48 (±4).
Variable Strategy 1a Strategy 2a
Patients without virologic failure
(n= 85)
Patients with virologic failure
(n= 23)
Patients without virologic failure
(n= 87)
Patients with virologic failure
(n= 21)
n % n % p-Valueb n % n % p-Valueb
Male sex 62 72.9 16 69.6 0.748 63 72.4 15 71.4 0.928
CDC group 0.904c 0.806c
A 5 5.9 1 4.3 5 5.7 1 4.8
B 16 18.8 3 13.0 14 16.1 5 23.8
C 64 75.3 19 82.6 68 78.2 15 71.4
Previous antiretroviral therapy
PI, NNRTI and NRTI use 64 75.3 17 73.9 0.892 65 74.7 16 76.2 0.888 NNRTI use 64 75.3 17 73.9 0.892 65 74.7 16 76.2 0.888 Mono or dual antiretroviral therapy 42 49.4 7 30.4 0.105 42 48.3 7 33.3 0.217 Unboosted-PI use 79 92.9 19 82.6 0.215c 81 93.1 17 82.0 0.101c
Number of DRV RAMs 0.658c 0.644c
0 or 1 60 70.6 14 60.9 61 70.1 13 61.9
2 17 20.0 6 26.1 17 19.5 6 28.6
3 or more 8 9.4 3 13.0 9 10.3 2 9.5
Data for DRV-based salvage therapy
Overall genotypic sensitivity score 0.286 0.535c
≤2 17 20.0 7 30.4 18 20.7 6 28.6
>2 and≤3 56 65.9 11 47.8 56 64.4 11 52.4
>3 12 14.1 5 21.7 13 14.9 4 19.0
Number of antiretrovirals 0.384 0.761
3 6 7.1 2 8.7 7 8.0 1 4.8
4 54 63.5 11 47.8 53 60.9 12 57.1
5 or 6 25 29.4 10 43.5 27 31.0 8 38.1
Enfuvirtide use 31 36.5 8 34.8 0.881 31 35.6 8 38.1 0.833 Raltegravir use 54 63.5 13 56.5 0.539 54 62.1 13 61.9 0.989
CDC, Centers for Disease Control; DRV, darunavir; NRTI, nucleoside reverse transcriptase inhibitor; NNRTI, nonnucleoside reverse transcriptase inhibitor; PI, protease inhibitor; RAMs, resistance-associated mutations.
a Strategies for handling missing data (see “Materials and methods” section for definitions).
b By chi-square test, except when indicated otherwise.
c By Fisher’s exact test.
Discussion
In this study of HIV-1-infected patients who initiated a DRV-based salvage therapy, virologic success at week 48 was achieved by about 80% of patients and the mean CD4 cell count increase from baseline exceeded 100 cells/L. Higher
base-line viral load (RR = 1.04 per 10,000 copies/mL increase; 95% CI = 1.01–1.09) and higher number of DRV-RAMs (RR = 1.23 per each; 95% CI = 0.95–1.48) were independently associated with 48-week virologic failure.
Patients in our cohort had more advanced disease (CDC group C 76.9%) than patients who initiated a DRV-based sal-vage therapy in the POWER randomized trials (36%)11and in a previous Brazilian prospective cohort from São Paulo (65%) published by Vidal et al.18 The proportion of patients with three or more primary protease inhibitor mutations was also higher that in the POWER trials (60.2% vs. 54%).11Still, the pro-portion of patients with three or more DRV-RAMs (10.2%) was lower than in the POWER trials (22%)11and higher than in the São Paulo cohort (7.6%).18Another retrospective cohort from
Table 3 – Comparison of baseline patient characteristics (numerical data), according to virologic failure at week 48 (±4).
Variable Strategy 1a Strategy 2a
Patients without virologic failureb
(n= 85)
Patients with virologic failureb
(n= 23)
p-Valuec Patients without virologic failureb
(n= 87)
Patients with virologic failureb
(n= 21)
p-Valuec
Age, years 43.8 (40.7–48.8) 44.6 (37.1–52.1) 0.607 45.2 (40.9–49.9) 43.7 (35.5–47.6) 0.088 Time since diagnosis of HIV infection, years 11.7 (9.6–13.6) 11.0 (9.2–12.5) 0.275 11.5 (9.4–13.3) 11.7 (9.6–14.3) 0.558 Nadir CD4 cell count, cells/L 80 (34–173) 76 (13–138) 0.252 85 (36–173) 39 (13–107) 0.040
Highest viral load, copies/mL 5.0 (4.6–5.5) 5.3 (4.9–5.6) 0.104 5.0 (4.4–5.5) 5.3 (5.2–5.6) 0.006 Time since last genotype test, months 6.8 (4.4–9.8) 5.3 (3.7–9.3) 0.234 6.9 (4.5–9.9) 4.6 (3.4–5.8) 0.010 Baseline viral load, copies/mL 4.1 (3.7–4.6) 4.7 (3.9–5.1) 0.047 4.1 (3.7–4.6) 4.7 (4.2–5.1) 0.003 Baseline CD4 cell count, cells/L 202 (119–329) 175 (47–362) 0.483 223 (115–356) 141 (85–329) 0.227
Previous antiretroviral therapy Overall length of antiretroviral use,
years
11.0 (9.1–12.5) 10.6 (8.9–11.8) 0.257 10.9 (9.0–12.3) 10.3 (9.2–11.8) 0.786
Number of antiretroviral regimens 5 (4–6) 4 (3–5) 0.118 5 (4–6) 4 (3–5) 0.424 Number of failing antiretroviral
regimens
3 (2–4) 2 (1–4) 0.018 3 (2–4) 2 (2–4) 0.076
Length of PI exposure, years 9.0 (6.8–10.9) 7.8 (7.0–10.4) 0.313 8.9 (6.8–10.8) 8.9 (7.3–10.6) 0.920 Length of unboosted-PI exposure,
years
3.8 (2.1–5.6) 3.9 (1.9–6.2) 0.979 4.0 (2.1–5.7) 3.2 (1.5–4.8) 0.400
Length of NNRTI exposure, years 1.5 (0.1–3.2) 2.3 (0.0–5.6) 0.154 1.6 (0.0–3.2) 2.4 (0.2–4.7) 0.228
Baseline cumulative genotype mutations
Number of TAMs 3 (3–4) 3 (1–4) 0.203 3 (2–4) 3 (3–4) 0.794 Number of NNRTI RAMs 2 (1–2) 2 (0–2) 0.810 2 (0–2) 1 (1–2) 0.650 Number of primary PI mutations 3 (2–4) 3 (2–4) 0.865 3 (2–4) 3 (2–4) 0.814 Number of DRV RAMs 1 (0–2) 1 (0–2) 0.307 1 (0–2) 1 (0–2) 0.546
DRV, darunavir; NNRTI, nonnucleoside reverse transcriptase inhibitor; PI, protease inhibitor; RAMs, resistance-associated mutations; TAM, thymidine-associated mutation.
a Strategies for handling missing data (see “Materials and methods” section for definitions).
b All values are median (25th and 75th percentiles).
c By Mann–Whitney’s test.
Table 4 – Multiple logistic regression analysis of factors associated with virologic failure at week 48 (±4).
Variable Strategy 1a Strategy 2a
RR (95% CI) p-Value RR (95% CI) p-Value
Baseline viral load (per 10,000 copies/mL) 1.04 (1.01–1.09) 0.007 1.10 (1.02–1.21) 0.001 Number of darunavir resistance mutations (per each) 1.23 (0.95–1.48) 0.069 1.58 (1.09–2.36) 0.023
Number of previously failing ART (ref: 1 or 2)
3 or 4 0.23 (0.08–0.56) 0.003 0.22 (0.07–0.67) 0.060
5 or more 0.23 (0.07–0.73) 0.006 0.18 (0.02–0.91) 0.037
Length of previous NNRTI exposure (per year) 1.19 (1.05–1.42) 0.010 NA NA Time since diagnosis of HIV infection (per 10-year period) NA NA 2.91 (1.46–8.35) 0.001
Age (per year) NA NA 0.92 (0.83–0.99) 0.009
Length of previous unboosted PI exposure (per year) NA NA 0.85 (0.64–1.04) 0.151
Number of TAMs (ref: 0–2)
3 or more NA NA 1.99 (0.89–6.19) 0.091
Number of primary PI mutations (ref: 0–3)
4 or more NA NA 0.38 (0.09–1.37) 0.135
Time since last genotype test (per month) 0.94 (0.83–1.02) 0.144 0.80 (0.58–0.98) 0.032
Intercept – 0.131 – 0.231
RR, relative risk; CI, confidence interval; ART, antiretroviral therapy; NNRTI, nonnucleoside reverse transcriptase inhibitor; NA, not applicable; PI, protease inhibitor; TAM, thymidine-associated mutation.
between 107.7 cells/L and 131.5 cells/L, and was similar to
the POWER trials (102 cells/L)11and the study by Vidal et al.
(118 cells/L).18
In multiple logistic regression analysis, higher baseline viral load was significantly predictive of virologic failure as in the subgroup analyses of TORO, BENCHMRK, DUET,10,14,29and
the previous Brazilian studies.18,19 In addition, higher
num-ber of DRV-RAMs were associated with virologic failure. This is in line with the POWER trials results, in which three or more DRV-RAMs were associated with a lower proportion of virologic success.11 In turn, the association found between
longer duration of NNRTI exposure and virologic failure may be in part explained by the higher proportion of two-drug class resistance in patients exposed to a NNRTI-containing regi-men when compared with those receiving a boosted protease inhibitor-based therapy.4
Unexpectedly, in the final logistic regression models, viro-logic failure was less likely in patients with three or more previous failing ARTs. This counterintuitive finding may reflect a prescription bias favoring patients with more previ-ous failing ARTs. Indeed, in patients with two or less failing ARTs, the proportion of raltegravir and enfuvirtide use in the OBT was, respectively, 42.1% and 21.1%. In patients with three or four previous failing ARTs, these proportions were 71.2% and 40.4%, respectively. Evidence suggests that the improved antiviral activity of third-line drugs may overcome the poor treatment history of patients.11,13,14This was illustrated in a
study that showed lower rates of virologic failure over time in patients with triple-class failure, reducing from 80% in 2000 to 48% in 2007.27 Another reason for the improved virologic
response among highly ART-experienced patients may be a higher level of adherence to ART as compared to patients with less previous ART exposure. A further explanation for this association could be a survivor bias.
Older age at baseline was also associated with higher viro-logic success. Higher adherence to ART in older HIV-1-infected patients, previously reported by some authors, may account for this finding.30–32
Due to the retrospective nature of our study, ART adher-ence could not be effectively measured. Accordingly, previous argumentations regarding ART adherence levels remain spec-ulative.
The main limitation of this study was the presence of missing data on viral load and CD4 cell counts at week 48 (±4). This is a common problem in clinical research, even in well-designed randomized controlled trials, but is more frequent in observational studies with prolonged follow-up.33
In studies where efforts to avoid missing data failed, four different types of adjustment methods for analysis may be used: complete-case analysis, single imputation methods, estimating-equation methods, and methods based on a sta-tistical model.33,34However, there is no consensus about the
best method for handling missing data in clinical studies.34,35
This is because all these methods are based on assumptions that, although scientifically plausible, are always empirically unverifiable.34On the other hand, in these situations there is
consensus that sensitivity analyses should be conducted to assess the robustness of the findings to plausible alternative assumptions about the missing data mechanism.34,36 In our
study, we conducted sensitivity analysis by comparing two
strategies for handling missing data (see “Materials and methods” section). It is worth noting that the rate of virologic success and the mean change in CD4 cell count were not highly sensitive to how missing values were treated. Regarding risk factors for virologic failure listed in Table 4, although they were less robust to the missing values assumptions, findings from both models are more complementary than conflicting.
In conclusion, virologic suppression is a realistic goal for most treatment-experienced HIV-1-infected patients who begin a DRV-based therapy even in routine care settings in Brazil.
Conflicts of interest
The authors declare no conflicts of interest.
r e f e r e n c e s
1. Bartlett JA, Fath MJ, DeMasi R, et al. An updated systematic overview of triple combination therapy in antiretroviral-naive HIV-infected adults. AIDS. 2006;20:2051–64.
2. Gallant JE, DeJesus E, Arribas JR, et al. Tenofovir DF,
emtricitabine, and efavirenz vs. zidovudune, lamivudine, and efavirenz for HIV. N Engl J Med. 2006;354:251–60.
3. Molina JM, Andrade-Villanueva J, Echevarria J, et al. Once-daily atazanavir/ritonavir versus twice-daily lopinavir/ritonavir, each in combination with tenofovir and emtricitabine, for management of antiretroviral-naïve HIV-1-infected patients: 48 week efficacy and safety results of the CASTLE study. Lancet. 2008;372:646–55.
4. Riddler SA, Haubrich R, DiRienzo G, et al. Class-sparing regimens for initial treatment of HIV-1 infection. N Engl J Med. 2008;358:2095–106.
5. Sax PE, Tierney C, Collier AC, et al. Abacavir-lamivudine versus tenofovir-emtricitabine for initial HIV-1 therapy. N Engl J Med. 2009;361:2230–40.
6. Moore RD, Keruly JC, Gebo KA, Lucas GM. An improvement in virologic response to highly active antiretroviral therapy in clinical practice from 1996 through 2002. J Acquir Immune Defic Syndr. 2005;39:195–8.
7. Porter K, Walker S, Hill T, et al. Changes in outcome of persons initiating highly active antiretroviral therapy at a CD4 count less than 50 cells/mm3. J Acquir Immune Defic Syndr.
2008;47:202–5.
8. Routman JS, Willig JH, Westfall AO, et al. Comparative efficacy versus effectiveness of initial antiretroviral therapy in clinical trials versus routine care. Clin Infect Dis. 2010;50:574–84. 9. Mugavero MJ, May M, Ribaudo HJ, et al. Comparative
effectiveness of initial antiretroviral therapy regimens: ACTG 5095 and 5142 clinical trials relative to ART-CC cohort study. J Acquir Immune Defic Syndr. 2011;58:253–60.
10. Nelson M, Arastéh K, Clotet B, et al. Durable efficacy of enfuvirtide over 48 weeks in heavily treatment-experienced HIV-1-infected patients in the T-20 versus optimized background regimen only 1 and 2 clinical trials. J Acquir Immune Defic Syndr. 2005;40:404–12.
11. Clotet B, Bellos N, Molina JM, et al. Efficacy and safety of darunavir-ritonavir at week 48 in treatment-experienced patients with HIV-1infection in POWER 1 and 2: a pooled subgroup analysis of data from two randomized trials. Lancet. 2007;369:1169–78.
12. Madruga JV, Berger D, McMurchie M, et al. Efficacy and safety of darunavir-ritonavir compared with that of
HIV-infected patients in TITAN: a randomized controlled phase III trial. Lancet. 2007;370:49–58.
13. Steigbigel RT, Cooper DA, Kumar PN, et al. Raltegravir with optimized background therapy for resistant HIV-1 infection. N Engl J Med. 2008;359:339–54.
14. Katlama C, Haubrich R, Lalezari J, et al. Efficacy and safety of etravirine in treatment-experienced, HIV-1 patients: pooled 48 week analysis of two randomized, controlled trials. AIDS. 2009;1:1–12.
15. Delaugerre C, Buyck JF, Peytavin G, et al. Factors predictive of successful darunavir/ritonavir-based therapy in highly antiretroviral-experienced HIV-1-infected patients (the DARWEST study). J Clin Virol. 2010;47:248–52.
16. Willig JH, Aban I, Nevin CR, et al. Darunavir outcomes study: comparative effectiveness of virologic suppression, regimen durability, and discontinuation reasons for three-class experienced patients at 48 weeks. AIDS Res Human Retroviruses. 2010;26:1279–85.
17. Young J, Scherrer AU, Günthard HF, et al. Efficacy, tolerability and risk factors for virological failure of darunavir-based therapy for treatment-experienced HIV-infected patients: the Swiss HIV Cohort Study. HIV Med. 2011;12:299–307.
18. Vidal JE, Song ATW, Matos ML, et al. High rate of virologic suppression with darunavir/ritonavir plus optimized background therapy among highly antiretroviral-experienced HIV-infected patients: results of a prospective cohort study in São Paulo, Brazil. Braz J Infect Dis. 2013;17:41–7.
19. Schontag M, Tenore S, Ferreira P, et al. High viral load, previous fosamprenavir use and recent HIV diagnosis correlate with darunavir failure in salvage therapy in São Paulo, Brazil. J Int AIDS Soc. 2012;15 Suppl. 4:18269. 20. Zaccarelli M, Lorenzini P, Ceccherini-Silberstein F, et al.
Historical resistance profile helps to predict salvage failure. Antivir Ther. 2009;14:285–91.
21. García F, Alvarez M, Fox Z, et al. Predicting antiretroviral drug resistance from the latest or the cumulative genotype. Antivir Ther. 2011;16:373–82.
22. Johnson VA, Brun-Vézinet F, Clotet B, et al. Update of the drug resistance mutations in HIV-1: December 2009. Top HIV Med. 2009;17:138–45.
23. Hernan MA, Alonso A, Logan R, et al. Observational studies analyzed like randomized experiments: an application to
postmenopausal hormone therapy and coronary heart disease. Epidemiology. 2008;19:766–79.
24. King G, Zeng L. Logistic regression in rare events data. Pol Anal. 2001;9:137–63.
25. King G, Zeng L. Explaining rare events in international relations. Int Org. 2001;55:693–715.
26. Tomz M, King G, Zeng L. RELOGIT: rare events logistic regression, version 1.1. Cambridge, MA: Harvard University; October 1, 1999. Available from: http://www.gking.
harvard.edu/ [cited 07.11.09].
27. Bansi L, Sabin C, Delpech V, et al. Trends over calendar time in antiretroviral treatment success and failure in HIV clinic populations. HIV Med. 2010;11:432–8.
28. Napravnik S, Keys JR, Quinlivan B, Wohl DA, Mikeal OV, Eron Jr JJ. Triple-class antiretroviral drug resistance: risk and predictors among HIV-1-infected patients. AIDS. 2007;21:825–34.
29. Cooper DA, Steigbigel RT, Gatell JM, et al. Subgroup and resistance analyses of raltegravir for resistant HIV-1 infection. N Engl J Med. 2008;359:355–65.
30. Lignani Jr L, Greco DB, Carneiro M. Avaliac¸ão da aderência aos antirretrovirais em pacientes com infecc¸ão pelo HIV/AIDS. Rev Saude Publica. 2001;35:495–501.
31. Barclay TR, Hinkin CH, Castellon SA, et al. Age-associated predictors of medication adherence in HIV-positive adults: health beliefs, self-efficacy, and neurocognitive status. Health Psychol. 2007;26:40–9.
32. Bra ˜nas F, Berenguer J, Sánchez-Conde M, et al. The eldest of older adults living with HIV: response and adherence to highly active antiretroviral therapy. Am J Med. 2008;121:820–4. 33. Wood AM, White IR, Thompson SG. Are missing outcome
data adequately handled? A review of published randomized controlled trials in major medical journals. Clin Trials. 2004;1:368–76.
34. Little RJ, D’Agostino R, Cohen ML, et al. The prevention and treatment of missing data in clinical trials. N Engl J Med. 2012;367:1355–60.
35. Huson LW, Chung J, Salgo M. Missing data imputation in two phase III trials treating HIV-1 infection. J Biopharm Stat. 2007;17:159–72.