Metabolic Syndrome in Chinese Population with
Abdominal Obesity
Shaoyong Xu
1☯, Bin Gao
1☯, Ying Xing
1, Jie Ming
1, Junxiang Bao
2, Qiang Zhang
3, Yi Wan
4*, Qiuhe Ji
1*, on
behalf of the China National Diabetes and Metabolic Disorders Study Group
¶1 Department of Endocrinology, the First Affiliated Hospital of Fourth Military Medical University, Xi’an, China, 2 Department of Aerospace Physiology, Fourth Military Medical University, Xi’an, China, 3 Department of Orthopedics, Chinese PLA general hospital, Beijing, China, 4 Department of Health Statistics, School of Public Health, Fourth Military Medical University, Xi’an, China
Abstract
Background: Not all the people with metabolic syndrome (MS) have abdominal obesity (AO). The study aimed to investigate gender differences in the prevalence and development of MS in Chinese population with abdominal obesity, which has rarely been reported.
Methods: Data were obtained from the 2007-08 China National Diabetes and Metabolic Disorders Study, and participants were divided into two samples for analysis. Sample 1 consisted of 19,046 people with abdominal obesity, while sample 2 included 2,124 people meeting pre-specified requirements. Survival analysis was used to analyze the development of MS.
Results: The age-standardized prevalence of MS in Chinese population with AO was 49.5%. The prevalence in males (73.7%) was significantly higher than that in females (36.9%). Males had significantly higher proportions of combinations of three or four MS components than females (36.4% vs. 30.2% and 18.4% vs. 5%, respectively). MS developed quick at first and became slow down later. Half of the participants with AO developed to MS after 3.9 years (95% CI: 3.7–4.1) from the initial metabolic abnormal component, whereas 75% developed to MS after 7.7 years (95% CI: 7.5–7.9).
Conclusion: Compared with females, Chinese males with AO should receive more attention because of their higher prevalence of MS and its components, more complex and risky combinations of abnormal components, and faster development of MS.
Citation: Xu S, Gao B, Xing Y, Ming J, Bao J, et al. (2013) Gender Differences in the Prevalence and Development of Metabolic Syndrome in Chinese Population with Abdominal Obesity. PLoS ONE 8(10): e78270. doi:10.1371/journal.pone.0078270
Editor: Cordula M. Stover, University of Leicester, United Kingdom
Received June 5, 2013; Accepted September 10, 2013; Published October 23, 2013
Copyright: © 2013 Xu et al. This is an open-access article distributed under the terms of the Creative Commons Attribution License, which permits unrestricted use, distribution, and reproduction in any medium, provided the original author and source are credited.
Funding: This study was supported by the Chinese Medical Association Foundation and the Chinese Diabetes Society. QZ received funding from the National Natural Science Foundation of China (grant 81101387). The funders had no role in study design, data collection and analysis, decision to publish, or preparation of the manuscript.
Competing interests: The authors have declared that no competing interests exist. * E-mail: [email protected] (QJ); [email protected] (YW)
☯ These authors contributed equally to this work.
¶ Membership of the China National Diabetes and Metabolic Disorders Study Group is provided in Appendix S1.
Introduction
Metabolic syndrome (MS) is a cluster of metabolic risk factors including hyperglycemia, hypertension and dyslipidemia [1-4]. In people with MS, the risk of suffering from diabetes and cardiovascular diseases (CVD) is significantly increased [5]. Abdominal obesity (AO) plays an important role in MS [6] and, together with insulin resistance, is considered to be one of the bases of MS [3]. However, not all the people with MS have AO [6]. It is extremely important to study MS in people with AO as
more attention [14]. There have been many epidemiological studies of MS in China; however, most of the subjects were normal people or people with diabetes [15-22]. To date, no study focuses on MS among Chinese population with AO.
Previous studies have shown the process from the occurrence of the first component to the development of MS is gradual, and people with AO develop MS faster than people without AO [23]. The risk of having diabetes and cardiovascular diseases (CVD) is significantly enhanced with increased number of abnormal metabolic components [24]. Attention should be paid to people with the appearance of the first abnormal metabolic component, for the subsequent second abnormal metabolic component or the MS arises quickly. For example, physicians are more concerned about how soon people with AO will develop to MS after the appearance of the first abnormal metabolic component. However, there has been no study of the process of development of MS from the first abnormal metabolic component.
In addition, it was reported that there was gender difference in the prevalence of MS and its components in general population [25,26]. Hence, data obtained from the 2007-08 China National Diabetes and Metabolic Disorders Study were used to investigate gender difference in the prevalence of MS and its components in Chinese population with AO, and to retrospectively explore gender difference in the development process from the first abnormal component to MS.
Materials and Methods
Ethics Statement
This study was approved by the institutional review boards from 17 participating institutions, which included First Affiliated Hospital of Fourth Military Medical University, China-Japan Friendship Hospital, Chinese People’s Liberation Army General Hospital, Third Affiliated Hospital of Sun Yat-sen University, People’s Hospital of Peking University, First Affiliated Hospital of Chinese Medical University, People’s Hospital of Shanxi Province, West China Hospital of Sichuan University, Affiliated Sixth People’s Hospital of Shanghai Jiao Tong University, Affiliated Drum Tower Hospital of Medical School of Nanjing University, Xinjiang Uygur Autonomous Region’s Hospital, Fujian Provincial Hospital, Qilu Hospital of Shandong University, Peking University First Hospital, Henan Province People’s Hospital, Second Affiliated Hospital of Harbin Medical University, and Xiangya Second Hospital. Written informed consent was gained from each participant prior to data collection. The 17 institutional review boards’ approvals covered every participant in the study.
2007-08 China National Diabetes and Metabolic Disorders Study
Data were obtained from the 2007-08 China National Diabetes and Metabolic Disorders Study, which was a population-based nationwide and multi-stage stratified sampling investigation performed between July 2007 and June 2008. Detailed information was previously described [27-31]. Briefly, adults aged >20 years with at least 2 years of residency were selected for the study. Signed informed consents were
obtained from the participants before the study. After fasting for at least 10 hours at night, participants with no history of diabetes were given a standard 75-g glucose solution, whereas for safety reasons, participants with a self-reported history of diabetes were given a steamed bun that contained approximately 80g of complex carbohydrates [27]. In addition, all participants were subjected to other laboratory tests, such as fasting triglycerides, total cholesterol (TC), and high-density lipoprotein cholesterol (HDL-c) assessments. Professionally trained doctors or nurses measured anthropometric data including height, weight, waist circumference, and blood pressure [27]. A questionnaire was designed to collect demographic data and lifestyle risk factors on all participants. Educational level was categorized as college or above, secondary school, and elementary school or below. Cigarette smoking was defined as having smoked at least 100 cigarettes in one’s lifetime. Alcohol drinking was defined as consuming alcohol at least once per week for a year or more. Physical activity was defined as participating in moderate or vigorous activity for 30 minutes or more per day for at least 3 days a week. Questions in the questionnaire were used to investigate the diagnosis history of abnormal metabolic components, which included “What is your maximum weight? Please specify your age when you reached your maximum weight.” and “Have you
ever had diabetes, hypertriglyceridemia, or
hypercholesterolemia? If yes, please indicate the date of diagnosis”.
Definitions
The definition of MS referred to the International Diabetes Federation standard [3], with AO defined as waist circumference ≥ 90 cm (males) or ≥ 80 cm (females) plus any two of the following four abnormal metabolic components: 1) fasting triglycerides ≥ 1.69 mmol/l or the use of lipid medications; 2) systolic blood pressure ≥ 130 mmHg, diastolic blood pressure ≥ 85 mmHg, or the use of antihypertensive medications; 3) fasting plasma glucose ≥ 5.6 mmol/l or the use of diabetes medications; and 4) HDL-c < 1.04 mmol/l (male) or < 1.29 mmol/l (female).
Study Population
abnormal metabolic component, the age at which maximum weight was reached was to be prior than the age when the first component happened; and 5) Two or more components could not first have been diagnosed at the same time. Otherwise, the MS may already have developed, and analyses could not be pursued. After the above selection, only 2,123 participants
were chosen as Sample 2 for the study. (Figure 1)
Data Analysis
Data were analyzed using SPSS 18.0 or Stata 11.0 software for Windows. Data were expressed as mean ± SD, median with interquartile range, or percentage as suitable. Comparisons
between groups were analyzed by t-test or Mann-Whiteney U
-test for measurement data, and chi-square -test for enumeration
data P < 0.05 was defined as the threshold for statistical
significance.
The prevalence of MS and its components in Sample 1 was analyzed and gender differences were compared. Age-standardized point prevalence estimates and confidence intervals (95% CI) for MS and its components stratified by sex
were calculated using Stata (version 11.0) svy commands to
account for the multi-stage stratified random sampling design. The calculation was weighted on the basis of Chinese population data from 2006 [33]. The presence of two or more of four components of MS could be diagnosed as MS. Thus, people with AO have a total of 10 combinations of components, including six kinds of combinations of two components, three kinds of combinations of three components, and one kind of combination of four components. The distribution characteristics of each component at different ages, and combinations of different components were analyzed by gender.
Survival analysis was used to study participants with AO in Sample 2 from the occurrence of the first abnormal component to the development of MS. The initial event was defined as the first occurrence of an abnormal component, while the end event was defined as the development of MS. The study time was defined as the time period between the initial event and the end event. If MS had not yet developed, it was defined as a censored value. Gender differences in prevalence were compared between participants aged < 50 years and those aged ≥ 50 years. A survival curve was plotted using
Kaplan-Figure 1. Flow chart of study participants. Abbreviations: MS: metabolic syndrome; AO: abdominal obesity.
Meier method and cumulative prevalence was calculated by life table method; gender differences were analyzed by Cox regression analysis. Andersen 95% confidence intervals for the median survival time of groups were constructed by a forward stepwise method.
Results
Characteristics of study subjects
In Samples 1 and 2, the age and maximum weight age of
males were significantly lower than those of females (p < 0.05).
There was significant gender difference in educational level and lifestyle risk factors as cigarette smoking and alcohol drinking. The height, current and maximum weight, body mass index, waist circumference, diastolic blood pressure and triglyceride in males were significantly higher than those in
females (p < 0.05), while the HDL-c in females was significantly
higher than that in males (p < 0.05). There was no gender
difference in TC in Sample 1 or in fasting blood glucose or
systolic blood pressure in Sample 2 (p > 0.05). However, TC
was significantly higher in females than that in males in Sample 2 (p < 0.05). (Table 1)
Gender difference in the prevalence of individual components and MS
The age-standardized prevalence of MS in people with AO was 50.5%. The prevalence in males (73.7%) was significantly higher than that in females (36.9%). Hypertension as one of the MS component had the highest age-standardized prevalence (48.9%), followed by hypertriglyceridemia (43.2%), HDL-c (34.0%), and hyperglycemia (32.4%). In males, HDL-c was the component with the highest prevalence (67.7%), followed by hypertension (61.3%) and hypertriglyceridemia (55.7%) showing moderate prevalence, and hyperglycemia having the lowest prevalence (36.4%). In females, the MS component of hypertension had the highest prevalence (41.3%), while HDL-c
had the lowest prevalence (14.8%). (Table 2)
Gender difference in the prevalence of MS component combinations
Males had the highest prevalence of MS with the combination of hypertension plus hypertriglyceridemia plus HDL-c components (14.5%), while females had the highest prevalence with the combination of hypertension plus hypertriglyceridemia (10.4%) and hyperglycemia plus hypertension plus hypertriglyceridemia (10.3%). In addition, the proportions of combinations of three and four components were
significantly higher in males than those in females (36.4% vs.
30.2% and 18.4% vs. 5%, respectively). (Figure 2)
Gender difference in the development from the initial component to MS
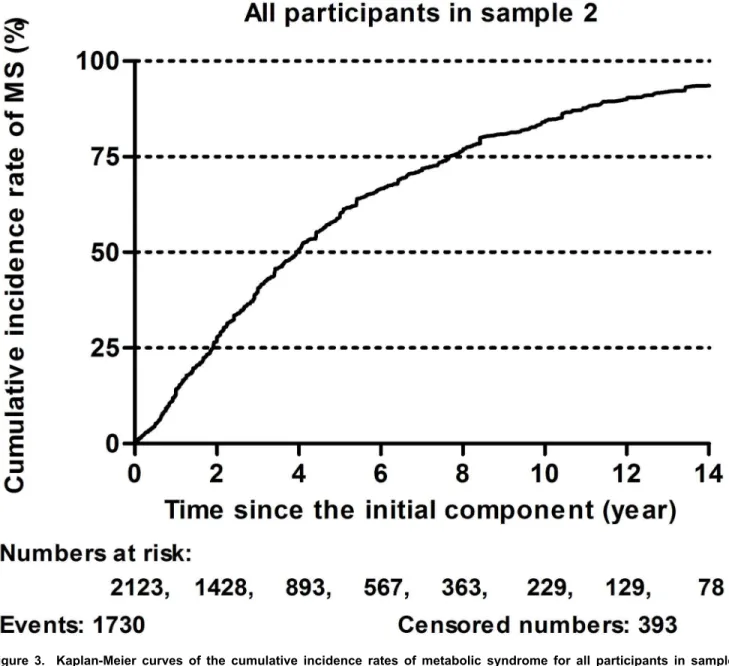
There were 1,730 individuals that developed MS among the 2,123 participants with AO in Sample 2, within the total observation time. MS developed fast at first and then became slow down later. The 5-year and 10-year cumulative prevalence of MS were 58% and 83%, respectively. Half of the
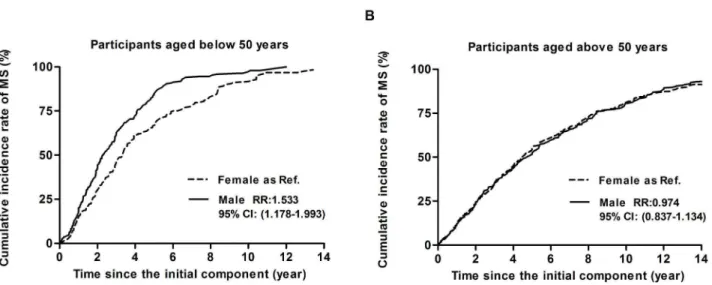
participants with AO developed MS after 3.9 years (95% CI: 3.7 - 4.1), whereas 75% developed MS after 7.7 years (95% CI: 7.5 - 7.9) (Figure 3). After adjusted for ethnics, educational level, cigarette smoking, alcohol drinking, and physical activity, males developed MS significantly faster than females in the group aged < 50 years (RR: 1.533, 95% CI: 1.178–1.993), whereas there was no significant difference in the development
Table 1. Characteristics of sample 1 and 2 according to gender.
Variable Sample 1 Sample 2
Male Female Male Female
n 6,261 12,785 742 1,381
Age, years 47.6 ± 13.4 49.9 ± 12.4* 52.5 ± 12.0 56.5 ± 10.1*
Ethnics (Han), n (%) 5,667 (91.1) 11,624 (91.5) 686 (93.0) 1295 (94.0) Educational level, n
(%)
College or above 1,647 (26.5) 1,455 (11.4)* 170 (23.1) 116 (8.4)*
Secondary school 3,511 (56.4) 6,667 (52.4)* 427 (58.1) 694 (50.4)*
Elementary school or
below 1,066 (17.1) 4,598 (36.2)* 138 (18.8) 566 (41.1)* Urban, n (%) 2050 (32.7) 4,549 (35.6)* 210 (28.3) 426 (30.8)
Cigarette smoking, n
(%) 2,945 (47.1) 431 (3.4)* 348 (47.0) 58 (4.2)* Alcohol drinking, n
(%) 3,041 (48.8) 544 (4.3)* 376 (50.8) 52 (3.8)* Physical activity, n
(%) 2,346 (37.7) 4,696 (36.9) 350 (47.6) 657 (47.8) Height, cm 169.6 ± 6.5 157.4 ± 6.0* 169.2 ± 6.0 156.5 ± 6.0*
Current weight, kg 79.5 ± 10.1 65.0 ± 8.8* 79.2 ± 9.7 65.0 ± 8.8*
Body mass index,
kg/m2 27.6 ± 3.1 26.2 ± 3.3* 27.7 ± 3.0 26.5 ± 3.2*
Maximum weight, kg 82.4 ± 11.2 67.9 ± 9.5* 84.2 ± 10.6 69.4 ± 9.1*
(n = 5,943) (n = 11,951) Age at maximum
weight, years 41.1 ± 12.4 42.0 ± 12.5* 41.6 ± 10.5 42.9 ± 11.3* (n = 5,261) (n = 10,428)
Average waist, cm 96.6 ± 6.2 87.9 ± 6.9* 96.7 ± 5.9 89.0 ± 7.1*
Fasting plasma
glucose, mmol/l 5.7 ± 1.6 5.6 ± 1.6* 6.4 ± 2.2 6.3 ± 2.3 Systolic blood
pressure, mmHg 131.8 ± 18.6 127.8 ± 20.1*
139.3 ±
19.4 138.4 ± 20.1 Diastolic blood
pressure, mmHg 84.9 ± 11.5 80.2 ± 11.1* 88.4 ± 12.4 84.2 ± 11.5* Fasting triglycerides,
mmol/l 2.1 ± 1.4 1.7 ± 1.1* 2.2 ± 1.4 1.9 ± 1.2* HDL-cholesterol ,
mmol/l 1.2 ± 0.3 1.3 ± 0.3* 1.2 ± 0.3 1.3 ± 0.3* Total cholesterol,
mmol/l 5.0 ± 1.0 4.9 ± 1.0 5.0 ± 1.0 5.2 ± 1.0* Abbreviations: HDL: high-density lipoprotein.
Data were expressed as mean ± SD, median with interquartile range, or percentage as suitable.
of MS between males and females aged ≥ 50 years (RR:
0.974, 95% CI: 0.837–1.134) (Figure 4).
Discussion
The present study focused on the prevalence and characteristics of MS in a Chinese population with AO, which, as far as we have known, have not been reported previously in China. Our results were obtained using data from a whole population-based national sampling survey that is more representative than previous hospital- or community-based studies on MS with AO. In addition, we analyzed the process of MS from the occurrence of the first abnormal MS component to the development of MS, which has been scarcely reported in the past.
Previous studies have shown that the prevalence of MS in general Chinese population was about 5–30%, depending on the diagnostic criteria used [16,18-21]. In Table 2 of our study, the age-standardized prevalence of MS in participants with AO was 50.5%, which was significantly higher than that in general population. The prevalence of MS in males (73.7%) was almost two times that in females (36.9%). This gender difference was
different from that in general population. For example, Li et al. reported the age-standardized prevalence of MS in males of the general Chinese population was only 1.5-fold that in females (15.7% vs. 10.2%) [17]. There are even two studies showing that, in the general population, the age-standardized prevalence of MS in males is significantly lower than that in females [19,34]. In addition, consistent with Claudio L. Lafortuna’s study [10], we found the MS component of hypertension had the highest age-standardized prevalence in all study subjects with AO (48.9%). However, only in females did hypertension have the highest prevalence (41.3%); the component with the highest prevalence in males was HDL-c (67.7%). The gender difference in the prevalence of different components in AO population is significantly different from previous general Chinese population. For example, InterASIA study based on the national whole Chinese population sampling survey showed that hypertension was the most frequent component among males (44.2%), whereas HDL-c was the most frequent component in females (46.5%) in the general population [34]. There are some reasons that account for the difference between ours and InterASIA study. The first is the age difference of participants between the two studies. We included adults aged above 20 years while the age range
Table 2. Age-standardized prevalence of MS and its components in male, female and total participants with abdominal obesity.
Age duration (years) MS BG BP TG HDL-c p value
n / N % n / N % n / N % n / N % n / N %
Male participants <0.001
20-30 383/613 62.5 144/613 23.5 293/613 47.8 308/613 50.2 418/613 68.2 30-40 966/1,296 74.5 424/1,296 32.7 729/1,296 56.3 791/1,296 61.0 939/1,296 72.5 40-50 1,257/1,613 77.9 649/1,613 40.2 1,042/1,613 64.6 1,019/1,613 63.2 1,041/1,613 64.5 50-60 1,151/1,473 78.1 664/1,473 45.1 1,048/1,473 71.1 780/1,473 53.0 957/1,473 65.0 > 60 1,030/1,266 81.4 665/1,266 52.5 1,022/1,266 80.7 594/1,266 46.9 811/1,266 64.1 Crude 4,787/6,261 76.5 2,546/6,261 40.7 4,134/6,261 66.0 3,492/6,261 54.9 4,166/6,261 66.5
Standardized* 73.7 36.4 61.3 55.7 67.7
Female participants <0.001
20-30 187/849 22.0 177/849 20.8 162/849 19.1 226/849 26.6 146/849 17.2 30-40 532/1,893 28.1 478/1,893 25.3 533/1,893 28.2 593/1,893 31.1 297/1,893 15.7 40-50 1,249/3,315 37.7 1,030/3,315 31.1 1,538/3,315 46.4 1,168/3,315 35.2 464/3,315 14.0 50-60 1,971/3,811 51.7 1,449/3,811 38.0 2,379/3,811 62.4 1,726/3,811 45.3 457/3,811 12.0 > 60 1,823/2,917 62.5 1,349/2,917 46.2 2,208/2,917 75.7 1,431/2,917 49.1 366/2,917 12.5 Crude 5,762/12,785 45.1 4,483/12,785 35.1 6,820/12,785 53.3 5,144/12,785 40.2 1,730/12,785 13.5
Standardized* 36.9 30.2 41.3 35.4 14.8
Total participants <0.001
20-30 570/1,462 39.0 321/1,462 22.0 455/1,462 31.1 534/1,462 36.5 564/1,462 38.6 30-40 1,498/3,189 47.0 902/3,189 28.3 1,262/3,189 39.6 1,384/3,189 43.4 1,236/3,189 38.8 40-50 2,506/4,928 50.9 1,679/4,928 34.1 2,580/4,928 52.4 2,187/4,928 44.4 1,505/4,928 30.5 50-60 3,122/5,284 59.1 2,113/5,284 40.0 3,427/5,284 64.9 2,506/5,284 47.4 1,414/5,284 26.8 > 60 2,853/4,183 68.2 2,014/4,183 48.1 3,230/4,183 77.2 2,025/4,183 48.4 1,177/4,183 28.1 Crude 10,549/19,046 52.0 7,029/19,046 36.9 10,954/19,046 57.7 8,636/19,046 45.3 5,896/19,046 32.6
Standardized* 50.5 32.4 48.9 43.2 34.0
Abbreviations: MS: metabolic syndrome; BG: raised plasma glucose; BP: raised blood pressure; TG: raised triglycerides; HDL-c reduced high-density lipoprotein cholesterol. Data are expressed as number of cases (% of total).
in InterASIA Study was 35-74 years. The second is the parameter of HDL cholesterol in MS criteria. The cutoff in our study was 1.0 mmol/L in men or 1.3 mmol/L in women, while it was 1.0 mmol/L for both men and women in InterASIA Study. Even so, we speculate that AO might influence men’s dyslipidemia more than female’s, which needs further studies to elucidate in the future.
Based on the analysis of MS components according to age groups in Table 2, we firstly revealed there were significantly more people with AO having hypertension as they aged. The prevalence of hypertension increased even up to 75% in those with AO aged >60 years, and males showed higher prevalence of hypertension than females in all age groups. The high prevalence of hypertension could be explained by the following reasons: on the one hand, the law of hypertension, namely that blood pressure increases significantly with age, indicates that age has significant effects on blood pressure [35,36]; on the other hand, the diagnostic criteria for blood pressure may be too rigid and lack age-specific diagnostic cut-off points [37,38], because it is well known that the normal value of blood pressure in elderly people are higher than those in younger people [39]. Secondly, we found that the prevalence of the hyperglycemia component in both genders was similar, i.e. it increased gradually from ~20% at 20 - 30 years old to ~50% at age >60 years. Thirdly, one component that differed in frequency between males and females in different age groups
was hypertriglyceridemia. The prevalence of
hypertriglyceridemia in males at different ages was about 50%, with slight variations among different age groups, while its prevalence in females increased gradually with age. Lastly, we showed the biggest difference between males and females was
HDL-c component. The prevalence of the HDL-c component in females with AO in different age groups was relatively low and decreased slowly with age, but it was high in males with AO, remaining at 60 - 80%. This significant gender difference in MS components in different age groups is of great importance for differential prevention strategies in different age groups.
The combinations of different MS components were compared between males and females in Figure 2. Consistent with the finding that the prevalence of MS in males was higher than that in females, the combination of MS components was more complicated in males than in females. Besides AO, there were higher prevalence of two, three and four components combinations in males than in females. Furthermore, the proportions of three and four combinations in males were significantly higher than those in females (40.6% vs. 30.1% and 9.0% vs. 5.0%, respectively). It is a commonly held view that combinations of more components equates to a higher risk of CVD [24]. In addition, a prospective study at the Framingham Heart Center showed only two kinds of combinations were associated with CVD and mortality, i.e. hyperglycemia plus hypertension (plus AO) and HDL-c plus hypertension plus hypertriglyceridemia [40]. We found that males showed higher prevalence than females for the above two combinations among people with AO (29.7% vs. 22.8 and 27.7% vs.4.4%, respectively; data not shown). Thus, we concluded that males with AO showed more complex and risky combinations of MS compared with females.
Finally, we analyzed how people with AO developed MS from the occurrence of the first abnormal component in Figure 3 and 4. It was found that MS developed quickly, and then its development slowed down. Half of participants with AO
Figure 2. Prevalence of metabolic syndrome components combination in male and female participants with abdominal obesity. Abbreviations: BG: raised fasting plasma glucose, BP: raised blood pressure, TG: raised triglycerides, HDL: reduced high-density lipoprotein cholesterol.
developed MS within 5 years, which is somewhat faster than that described in Hwang’s report [23]. We found at the same time that 75% of participants with AO developed MS within 10 years. Our results suggest that the first 5 years after the occurrence of the first component is critical and should be paid more attention. Further, this attention ought to be maintained for up to 10 years. In addition, because menopause significantly affects females [41,42], we divided the study subjects into two groups, those aged <50 years and those aged >50 years. We found that the speed of development of MS in males aged <50 years was significantly faster than that in females of the same age (RR: 1.533, 95% CI: 1.178–1.993); whereas there was no statistically significant difference between males and females aged >50 years. Our results in the
population with AO are different from the development characteristics of MS in general population. For instance, Hwang et al. reported the prevalence of MS in menopausal women was significantly lower than that in men, but, after menopause, females gradually caught up and passed males in terms of the prevalence of MS. These authors hypothesized that obesity might cause the difference in MS development before and after menopause in women [23]. We showed that there was no gender difference between males and females aged >50 years because we selected only participants with AO. Our result could partly confirm their hypothesis.
Figure 3. Kaplan-Meier curves of the cumulative incidence rates of metabolic syndrome for all participants in sample
2. Abbreviations: MS: metabolic syndrome.
Limitations
The main limitation of our study is that TC was used as one component instead of HDL-c, because we could not obtain diagnostic history of HDL-c in China. There are two reasons for choosing TC to replace HDL-c. One reason is that the purpose of studying MS was to screen people at risk of CVD and diabetes, while TC has already been demonstrated to be associated with CVD [43-46]. The other reason is that it was still a feasible method, although we might screen different populations using TC as an alternative component. Previous studies have shown that about 21% of the high-risk population was filtered out as MS using three official criteria. However, only 9% of the high-risk population was screened by all three standards; in other words, about half of the screened population was different for each standard [3]. In fact, although not intending to compare, we discovered that multiple metabolic indexes (e.g. waist circumference and blood pressure) were higher in Sample 2 than in Sample 1 in the present study, which indicated that we might have overestimated the rate of development of MS to some extent. However, due to a lack of prospective studies, the use of TC as an alternative component is reasonable and feasible for studying the characteristics of MS development.
The second limitation of the study is recall bias, including previous weight and diagnostic history of abnormal components, which were unavoidable for a retrospective study. Another concern is whether people with abnormal components will be diagnosed in time. Thus, we randomly selected some of our subjects and called them back to ask about their previous history. It was found that the consistency of memory was 87% and the Kappa value was 0.78. Considering that AO people experiencing the occurrence of the first abnormal component will be concerned about their health status and take regular
physical examinations, we believe that the above reasons could dispel any concerns about recall bias to some extent.
In addition, the number of females was higher than that of males because females had a relatively higher response rate than males, which might cause a potential selection bias [27].
Conclusion
In summary, we analyzed gender differences in the prevalence and development of MS and its components in a Chinese population with AO. We found the prevalence of MS in the AO population was significantly higher than that in the general population. Compared with females, males should receive more attention because of their higher prevalence of MS and its components, more complex and risky combinations of abnormal components, and faster development of MS. In addition, we revealed that MS developed fast at first and became slow down later. The first 5 years after the occurrence of the first component in people with AO is very critical and should be paid attention, which ought to be maintained for up to 10 years. Our study is of importance for augmenting the knowledge of MS and its components in the population with AO, which is obviously different from that in general population.
Supporting Information
Appendix S1. China National Diabetes and Metabolic Disorders Study Group.
(DOC)
Figure 4. Kaplan-Meier curve of effect of gender for participants in sample 2with ages below 50 years (A) and above 50 years (B) divided by gender. Abbreviations: MS: metabolic syndrome.
Male as reference. The relative ratio (RR) and 95% confidence intervals (CI) were calculated by cox regression after adjustment for ethnics, educational level, cigarette smoking, alcohol drinking, and physical activity.
Acknowledgements
We thank all physicians and participants of the 2007-2008 Chinese National Diabetes and Metabolic Disorders Study for their cooperation and generous participation.
Author Contributions
Conceived and designed the experiments: QJ YW SX BG. Performed the experiments: QJ SX BG YX JM. Analyzed the data: SX BG YW. Contributed reagents/materials/analysis tools: QJ SX BG YX JM. Wrote the manuscript: SX BG. Revised the manuscript: BG YX JM JB QZ YW QJ.
References
1. Alberti KG, Zimmet PZ (1998) Definition, diagnosis and classification of diabetes mellitus and its complications. Part 1: diagnosis and classification of diabetes mellitus provisional report of a WHO consultation. Diabet Med 15: 539-553. doi:10.1002/ (SICI)1096-9136(199807)15:7. PubMed: 9686693.
2. Grundy SM, Brewer HB Jr., Cleeman JI, Smith SC Jr, Lenfant C et al. (2004) Definition of metabolic syndrome: report of the National Heart, Lung, and Blood Institute/American Heart Association conference on scientific issues related to definition. Arterioscler Thromb Vasc Biol 24: e13-e18. PubMed: 14766739.
3. Alberti KG, Zimmet P, Shaw J (2006) Metabolic syndrome--a new world-wide definition. A Consensus Statement from the International Diabetes Federation. Diabet Med 23: 469-480. doi:10.1007/ BF02706751. PubMed: 16681555.
4. Alberti KG, Eckel RH, Grundy SM, Zimmet PZ, Cleeman JI et al. (2009) Harmonizing the metabolic syndrome: a joint interim statement of the International Diabetes Federation Task Force on Epidemiology and Prevention; National Heart, Lung, and Blood Institute; American Heart Association; World Heart Federation; International Atherosclerosis Society; and International Association for the Study of Obesity. Circulation 120: 1640-1645. doi:10.1161/CIRCULATIONAHA. 109.192644. PubMed: 19805654.
5. Mottillo S, Filion KB, Genest J, Joseph L, Pilote L et al. (2010) The metabolic syndrome and cardiovascular risk a systematic review and meta-analysis. J Am Coll Cardiol 56: 1113-1132. doi:10.1016/j.jacc. 2010.05.034. PubMed: 20863953.
6. Carr DB, Utzschneider KM, Hull RL, Kodama K, Retzlaff BM et al. (2004) Intra-abdominal fat is a major determinant of the National Cholesterol Education Program Adult Treatment Panel III criteria for the metabolic syndrome. Diabetes 53: 2087-2094. doi:10.2337/diabetes. 53.8.2087. PubMed: 15277390.
7. Xi B, Liang Y, He T, Reilly KH, Hu Y et al. (2012) Secular trends in the prevalence of general and abdominal obesity among Chinese adults, 1993-2009. Obes Rev 13: 287-296. doi:10.1111/j.1467-789X. 2011.00944.x. PubMed: 22034908.
8. Popkin BM, Adair LS, Ng SW (2012) Global nutrition transition and the pandemic of obesity in developing countries. Nutr Rev 70: 3-21. doi: 10.1111/j.1753-4887.2011.00456.x. PubMed: 22221213.
9. Correia F, Poínhos R, Freitas P, Pinhão S, Maia A et al. (2006) [Prevalence of the metabolic syndrome: comparison between ATPIII and IDF criteria in a feminine population with severe obesity]. Acta Med Port 19: 289-293. PubMed: 17328845.
10. Lafortuna CL, Agosti F, De Col A, Pera F, Adorni F et al. (2012) Prevalence of the metabolic syndrome and its components among obese men and women in Italy. Obes Facts 5: 127-137. doi: 10.1159/000336700. PubMed: 22433624.
11. Mathieu P, Lemieux I, Després JP (2010) Obesity, inflammation, and cardiovascular risk. Clin Pharmacol Ther 87: 407-416. doi:10.1038/clpt. 2009.311. PubMed: 20200516.
12. Freemantle N, Holmes J, Hockey A, Kumar S (2008) How strong is the association between abdominal obesity and the incidence of type 2 diabetes? Int J Clin Pract 62: 1391-1396. doi:10.1111/j. 1742-1241.2008.01805.x. PubMed: 18557792.
13. Hu FB, Liu Y, Willett WC (2011) Preventing chronic diseases by promoting healthy diet and lifestyle: public policy implications for China. Obes Rev 12: 552-559. doi:10.1111/j.1467-789X.2011.00863.x. PubMed: 21366840.
14. Shen J, Goyal A, Sperling L (2012) The emerging epidemic of obesity, diabetes, and the metabolic syndrome in china. Cardiol. Res Pract: 2012: 178675
15. Pei WD, Sun YH, Lu B, Liu Q, Zhang CY et al. (2007) Apolipoprotein B is associated with metabolic syndrome in Chinese families with familial combined hyperlipidemia, familial hypertriglyceridemia and familial hypercholesterolemia. Int J Cardiol 116: 194-200. doi:10.1016/j.ijcard. 2006.03.045. PubMed: 16828905.
16. Lu B, Yang Y, Song X, Dong X, Zhang Z et al. (2006) An evaluation of the International Diabetes Federation definition of metabolic syndrome in Chinese patients older than 30 years and diagnosed with type 2 diabetes mellitus. Metabolism 55: 1088-1096. doi:10.1016/j.metabol. 2006.04.003. PubMed: 16839846.
17. Li ZY, Xu GB, Xia TA (2006) Prevalence rate of metabolic syndrome and dyslipidemia in a large professional population in Beijing. Atherosclerosis 184: 188-192. doi:10.1016/j.atherosclerosis. 2005.03.033. PubMed: 15927187.
18. Lao XQ, Thomas GN, Jiang CQ, Zhang WS, Yin P et al. (2006) Association of the metabolic syndrome with vascular disease in an older Chinese population: Guangzhou Biobank Cohort Study. J Endocrinol Invest 29: 989-996. PubMed: 17259796.
19. Feng Y, Hong X, Li Z, Zhang W, Jin D et al. (2006) Prevalence of metabolic syndrome and its relation to body composition in a Chinese rural population. Obesity (Silver Spring) 14: 2089-2098. doi:10.1038/ oby.2006.244.
20. Ko GT, Cockram CS, Chow CC, Yeung V, Chan WB et al. (2005) High prevalence of metabolic syndrome in Hong Kong Chinese--comparison of three diagnostic criteria. Diabetes Res Clin Pract 69: 160-168. doi: 10.1016/j.diabres.2004.11.015. PubMed: 16005365.
21. Fan JG, Zhu J, Li XJ, Chen L, Lu YS et al. (2005) Fatty liver and the metabolic syndrome among Shanghai adults. J Gastroenterol Hepatol 20: 1825-1832. doi:10.1111/j.1440-1746.2005.04058.x. PubMed: 16336439.
22. Grundy SM (2008) Metabolic syndrome pandemic. Arterioscler Thromb Vasc Biol 28: 629-636. doi:10.1161/ATVBAHA.107.151092. PubMed: 18174459.
23. Hwang LC, Bai CH, Chen CJ, Chien KL (2007) Gender difference on the development of metabolic syndrome: a population-based study in Taiwan. Eur J Epidemiol 22: 899-906. doi:10.1007/s10654-007-9183-5. PubMed: 17926136.
24. Sattar N, Gaw A, Scherbakova O, Ford I, O'Reilly DS et al. (2003) Metabolic syndrome with and without C-reactive protein as a predictor of coronary heart disease and diabetes in the West of Scotland Coronary Prevention Study. Circulation 108: 414-419. doi: 10.1161/01.CIR.0000080897.52664.94. PubMed: 12860911.
25. Kuk JL, Ardern CI (2010) Age and sex differences in the clustering of metabolic syndrome factors: association with mortality risk. Diabetes Care 33: 2457-2461. doi:10.2337/dc10-0942. PubMed: 20699434. 26. Ervin RB (2009) Prevalence of metabolic syndrome among adults 20
years of age and over, by sex, age, race and ethnicity, and body mass index: United States, 2003-2006. Natl Health Stat Report: 1-7. 27. Yang W, Lu J, Weng J, Jia W, Ji L et al. (2010) Prevalence of diabetes
among men and women in China. N Engl J Med 362: 1090-1101. doi: 10.1056/NEJMoa0908292. PubMed: 20335585.
28. Hou X, Lu J, Weng J, Ji L, Shan Z et al. (2013) Impact of waist circumference and body mass index on risk of cardiometabolic disorder and cardiovascular disease in Chinese adults: a national diabetes and metabolic disorders survey. PLOS ONE 8: e57319. doi:10.1371/ journal.pone.0057319. PubMed: 23520466.
29. Gao Y, Chen G, Tian H, Lin L, Lu J et al. (2013) Prevalence of hypertension in china: a cross-sectional study. PLOS ONE 8: e65938. doi:10.1371/journal.pone.0065938. PubMed: 23776574.
30. Yang ZJ, Liu J, Ge JP, Chen L, Zhao ZG et al. (2012) Prevalence of cardiovascular disease risk factor in the Chinese population: the 2007-2008 China National Diabetes and Metabolic Disorders Study. Eur Heart J 33: 213-220. doi:10.1093/eurheartj/ehr205. PubMed: 21719451.
31. Yang W, Xiao J, Yang Z, Ji L, Jia W et al. (2012) Serum lipids and lipoproteins in Chinese men and women. Circulation 125: 2212-2221. doi:10.1161/CIRCULATIONAHA.111.065904. PubMed: 22492668. 32. Joint Committee for Developing Chinese (2007) Guidelines on
33. National Bureau of Statistics of China. China (2006) Beijing: China: Statistics Press; (Accessed February 26 (2010). Available http:// www.stats.gov.cn/tjsj/ndsj/2006/indexeh.htm.
34. Gu D, Reynolds K, Wu X, Chen J, Duan X et al. (2005) Prevalence of the metabolic syndrome and overweight among adults in China. Lancet 365: 1398-1405. doi:10.1016/S0140-6736(05)66375-1. PubMed: 15836888.
35. Safar ME, Lange C, Blacher J, Eschwège E, Tichet J et al. (2011) Mean and yearly changes in blood pressure with age in the metabolic syndrome: the DESIR study. Hypertens Res 34: 91-97. doi:10.1038/hr. 2010.180. PubMed: 20927113.
36. Alexander CM, Landsman PB, Grundy SM (2008) The influence of age and body mass index on the metabolic syndrome and its components. Diabetes Obes Metab 10: 246-250. doi:10.1111/j. 1463-1326.2006.00695.x. PubMed: 18269640.
37. Gause-Nilsson I, Gherman S, Kumar Dey D, Kennerfalk A, Steen B (2006) Prevalence of metabolic syndrome in an elderly Swedish population. Acta Diabetol 43: 120-126. doi:10.1007/ s00592-006-0226-2. PubMed: 17211562.
38. Saukkonen T, Jokelainen J, Timonen M, Cederberg H, Laakso M et al. (2012) Prevalence of metabolic syndrome components among the elderly using three different definitions: a cohort study in Finland. Scand J Prim Health Care 30: 29-34. doi:10.3109/02813432.2012.654192. PubMed: 22324547.
39. Liu LS (2011) [2010 Chinese guidelines for the management of hypertension]. Zhonghua Xin Xue Guan Bing Za Zhi 39: 579-615. PubMed: 22088239.
40. Franco OH, Massaro JM, Civil J, Cobain MR, O'Malley B et al. (2009) Trajectories of entering the metabolic syndrome: the framingham heart
study. Circulation 120: 1943-1950. doi:10.1161/CIRCULATIONAHA. 109.855817. PubMed: 19884471.
41. Martelli V, Valisella S, Moscatiello S, Matteucci C, Lantadilla C et al. (2011) Prevalence of Sexual Dysfunction among Postmenopausal Women with and without Metabolic Syndrome. J Sex Med, 9: 434–41. PubMed: 22023878.
42. Shakir YA, Samsioe G, Nyberg P, Lidfeldt J, Nerbrand C et al. (2007) Do sex hormones influence features of the metabolic syndrome in middle-aged women? A population-based study of Swedish women: the Women's Health in the Lund Area (WHILA) Study. Fertil Steril 88: 163-171. doi:10.1016/j.fertnstert.2006.11.111. PubMed: 17383645. 43. Cui R, Iso H, Yamagishi K, Saito I, Kokubo Y et al. (2012) High serum
total cholesterol levels is a risk factor of ischemic stroke for general Japanese population: the JPHC study. Atherosclerosis 221: 565-569. doi:10.1016/j.atherosclerosis.2012.01.013. PubMed: 22341595. 44. Benfante R, Yano K, Hwang LJ, Curb JD, Kagan A et al. (1994)
Elevated serum cholesterol is a risk factor for both coronary heart disease and thromboembolic stroke in Hawaiian Japanese men. Implications of shared risk. Stroke 25: 814-820. doi:10.1161/01.STR. 25.4.814. PubMed: 8160226.
45. Benfante R, Reed D (1990) Is elevated serum cholesterol level a risk factor for coronary heart disease in the elderly? JAMA 263: 393-396. doi:10.1001/jama.1990.03440030080025. PubMed: 2294305. 46. Iso H, Jacobs DR Jr., Wentworth D, Neaton JD, Cohen JD (1989)