MEASUREMENTS OF RAIN DROP SIZE
DISTRBUTION FROM RADAR
REFLECTIVITY AND ASSOCIATED
RAIN ATTENUATION OF RADIO
WAVES
A. B. Bhattacharya1*, D. K. Tripathi1,2 A. Nag1,3 and M. Debnath1
1. Department of Physics, University of Kalyani, Kalyani 741235, India 2. Department of Physics, Narula Institute of Technology, Calcutta 700109, India
3. Department of Physics, Modern Institute of Engineering and Technology, Rajhat, Bandel, Hooghly 712123, India
Abstract: Radar measurements of rainfall at different climatological conditions have been taken into account emphasizing rain rate and associated radar reflectivity. It is observed from the analysis that the reflectivity measurement is being consistent at high rain intensities. From the knowledge of radar reflectivity, the rain drop size distribution is examined. The most probable drop size diameter and rain rate have been calculated wherefrom it appears that the most probable rain drop size vary exponentially with radar reflectivity and also with rain rate. The theoretical model implemented by using the measured rain drop sizes over the tropical sites also show similar kind of variation. For estimating rain attenuation two important parameters, viz., the point rainfall rates and the vertical and horizontal structures of rain have been considered. The elevation angle we have chosen is ~ 560 as most of the stations in India have that value of elevation angle with geostationary satellite. Taking the frequencies 11 to 14 GHz separately and 00 C isotherm height as 5.0 km, the effective rain height values are determined. The attenuation of radio waves due to rain are calculated for different rain rates assigning different γ-values. The attenuation is found to vary significantly with the γ-values. Also the attenuation curves are closer when the γ-values are of low order. An increase in attenuation with the γ-values is found to be more prominent for higher rain rates.
Key words: Radar reflectivity, Rain drop size, Attenuation of radio waves
1 Introduction
The digital revolution has been successfully exploited in new generation of radars with fully digitized outputs to facilitate the quantitative use of radar information. It is a complementary source of information of rain gauge and is useful for gathering information in conjunction with other relevant meteorological and hydrological information by means of multi sensor approach [1, 2]. Besides quantitative information the radar is ideal for getting qualitativeimage of the atmosphere. In this paper radar measurements of rainfall have been taken into account emphasizing radar reflectivity wherefrom the most probable drop size diameter and rain rate have been calculated. Taking the frequencies 11 GHz to 14 GHz separately and 00 C isotherm height as 5.0 km, the effective rain heights are evaluated. The attenuation of radio waves due to rain are then determined for different rain rates corresponding to different γ-values chosen.
2 Radar Measurements of Rainfall
to the radar antenna. The back- scattered mean power Pr received by the radar is proportional to the reflectivity factor Z, provided the scattering particles are considerably smaller than the wavelength and are of spherical in shape. The received power is also proportional to the radar constant C which includes the emitted power [8]. It is again inversely proportional to the square of the target distance r2 and the square of the one-way atmospheric attenuation
L
2Atm. In fact, the radar constant C reflects the radar properties like the emitted power, 3-dB beam shape, pulse length, antenna gain and attenuation of the radar hardware etc. The distortion of beam by the radome is largely neglected in practice and some of these values are calibrated regularly. The radar reflectivity factor Z, is a purely meteorological quantity and is independent of any radar property. As the variations in radar reflectivity may span several orders of magnitude, it is preferable to use a logarithmic scale. The logarithmic radar reflectivity is expressed in units of dBZ.The radar equation becomes accurate under specific assumptions like the physical properties of the target, uniform factor Z through the sample volume, beam filling with the randomly scattered precipitation particles, etc. and so a quantity called the effective radar reflectivity Zeis used inpractice which isdefined as the summation per unit volume of the sixth power of the diameter of spherical water drops in the Rayleigh scattering region [9].
3 Theoretical Approach on Rain Rate vis-à-vis Radar Reflectivity
The integral equation that relate radar reflectivity factor (Z) in dBz, effective radar reflectivity factor (Ze) in mm6
m-3, rain drop diameter (D) in mm, drop size distribution N(D) in m-3 mm-1, rain rate (R) in mm hr-1, backscattering cross section (σb) in m2, terminal velocity of rain drop (V) in m s-1, wavelength of operating radar
(λ) in m and dielectric constant of water (KW) are expressed as follows[9]:
= ∞ … (1) = ∞ … (2) = × ∞ … (3)
In equation (1) the radar reflectivity or the radar cross section per unit volume is the scattering cross section which is a function and dimension of the scatterer. Assuming an average rain drop size distribution attributed to Marshall-Palmer, the resultant expression of the reflectivity can be modified to get the effective reflectivity, Ze.
The formulation rain rate R is a function of rain drop diameter, number of rain drop and terminal velocity of rain drop. The terminal velocity V (D) is expressed in terms of the empirical relations for different rates and it is taken in terms of Stoke’s law. The terminal velocity function is obtained by determining the constant of the equation.
If the effects of updrafts and downdrafts wind, turbulence, and raindrop interaction are neglected, the stationary rain rate R in mm h-1 is related to the raindrop size distribution
N D
v( )
according to the relation4 3
0
6
10
( )
v( )
R
π
Dv D N D dD
∞ −
=
×
… (4)Figure 1 Experimental raindrop size distributions (circles, crosses) present in a volume of air and fitted exponential parameterization (solid lines) for different rain rates [10] represented as A: 1.0 mm h-1; B: 2.8 mm h-1; C: 6.3 mm h-1; D: 23.0 mm h-1.
3.1 Empirical Rain Rate – Radar Reflectivity Relationships
It is possible to derive Z–R relationships through regression analysis. Such relationships generally follow power laws of the form
z
=
aR
b; where a and b are coefficients that may vary from location to location and also fromone season to another. These coefficients reflect the climatological behavior and type of rainfall of a particular location or season for which they are evaluated. Battan [11] quoted a list of 69 such empirical power law Z–R
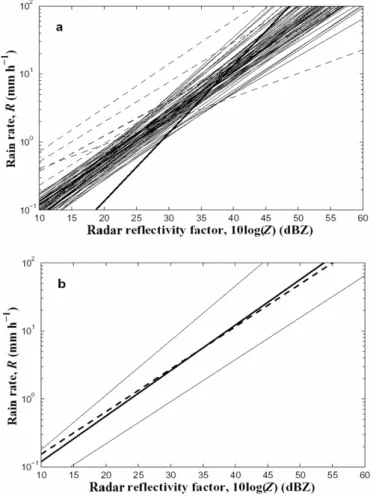
Figure 2 Radar reflectivity versus rain rate plot:
(a) The 69 power law Z-R relationships [11] including five deviating relationships as indicated by dashed lines, four of which have pre factors a significantly smaller than 100 and one of which has an exponent b as high as 2.87. The bold line in the figure represents the linear relationshipas proposed by List [12].
(b) The bold solid line represents the mean of Battan’s relationships, while the bold dashed line represents the reference relationship of Marshall et al [13]. All the individual relationships lie in between the thin solid lines as shown on either side in the form of an envelope [14, 15].
The figure shows that there is a considerable variability in the coefficients of these Z–R relationships owing to varying rainfall condition; there appears a well definedenvelope comprising most of the relationships developed. Considering the geometric mean of the individual prefactors a and the arithmetic mean of the exponents b
corresponding to averaging the linear relationships an attempt has been made by Battan[11] which leads to the mean power log Z- log R law relationship:
Z
=
238
R
1.5 … (6)explain their variability
Figure 3 The coefficients a and b of the 69 power law Z – R relationships
z
=
aR
b(where Z is expressed in mm6 m-3 and R in mm h-1 ) as quoted by Battan [11].The rainfall types considered are: thunderstorm (triangles); showers (squares); widespread/stratiform (stars); orographic (circles) and no unambiguous identification possible (dots). The vertical dashed lines represent the reference relationship
1.6
200
Z
=
R
[13] while the horizontal dash-dotted lines correspond to Marshall and Palmer’s [10] relationship Z= 237R1.5, which is nearly equal to the mean of Battan’s relationships,
Z
=
238
R
1.5 [14, 15].3.2 Drop size Distribution from Radar Reflectivity
The rain characteristics particularly rain rate and drop size distribution are important for estimating attenuated radio wave due to rain [16-18]. It is very difficult to get the exact drop size distribution but the rain rate can be measured accurately by rain gauge [19, 20]. With the help of radar reflectivity measurements from radar data located at Kolkata (22.390 N, 88.270 E) drop size distribution was being estimated for different rain rates. A comparative study of drop size distributions obtained from reflectivity measurements and also from other techniques it is observed that the reflectivity measurement is being consistent at high rain intensities. The most probable drop size diameter and rain rate have been calculated by [16.17],
= × . × … (8) and = × × … (9)
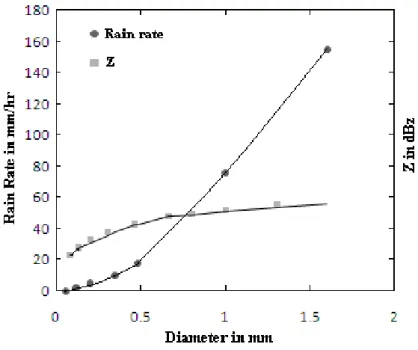
Figure 4 Variation of most probable rain drop size with radar reflectivity and rain rate
= 4.21 x 10- 5 x . , for 2.9 ≤f 54 GHz
= 4.09 x 10⁻² x . , for 54 ≤f ≤ 180 GHz … (11) and
= 1.41 x . , for 8.5 ≤f ≤ 25 GHz
= 2.63 x . , for 25 ≤f≤ 164 GHz … (12) where f represents the frequency. Knowing the rain rate profile, R(l), along the propagation path, L, the total attenuation can be determined by integrating the incremental attenuation. The total attenuation can be written as
= [ ] … (13) where R(l) represents the rain rate along the path and R0 is the rain rate at l=0, i.e., the point rain rate at l=0 at
the end of the path
For low rain rates the rain height is nearly constant [22] and is equal to the height of the 00C isotherm. But the rain height increases with the increase in rain rate. The effective rain height (He) is given by [23]
He = + log ; R0 ≥ 10 mm h-1 … (14)
where R0 is the point rain rate. Determination of path rain fall from point rainfall is done by the method of
effective path length. The exponential shaped effective profile for rain rates can be written as
= [ ] , for R0 ≥ 10 mm h-1 … (15)
where Z is the horizontal distant along the path; γ is a parameter for controlling the rate of decay of the rain profile. The path averaged rain rate for path length, D, can be calculated from:
= = {
[ ] }
; for R0 ≥ 10 mm h-1 … (16)
The total attenuation due to a point rain rate, R0, is computed from effective rain profile. The attenuation due to
path averaged rainfall is attained from
= ; for R0 ≥ 10 mm h-1 … (17)
where = , and H0is the station height from the earth’s surface.
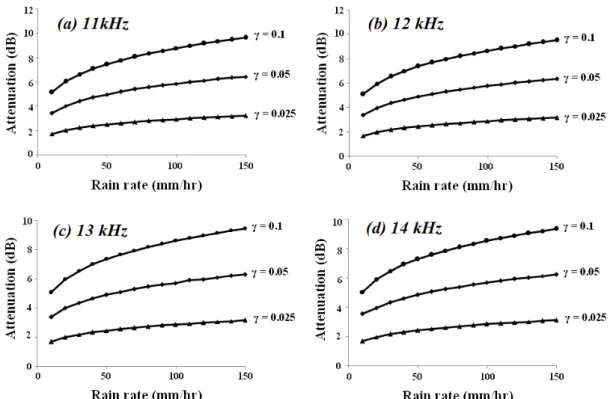
Using equations (11) and (12) the values of a and b are calculated for 11 GHz, 12 GHz, 13 GHz and 14GHz. The effective rain heights (He) over Kolkata for different rain rates are next calculated using equation (14),
considering the 00 C isotherm heights as 5.0 km as an annual average. This value of He is necessary for
estimating the value of L which is needed for the calculation of attenuation, using equation (17). The elevation angle we have considered for the present study is ~ 560 as most of the stations in India have an elevation angle of ~ 560 with geostationary satellite. Taking the frequencies 11 GHz, 12 GHz, 13 GHz and 14 GHz separately and choosing θ = 560 and 00 C isotherm height Hi = 5.0 km, the effective rain heights, He are determined. The
Figure 6 Variation of attenuation with rain rates for different values of γ
5 Discussions
It is well known that the radar beam is slightly curved downward in a standard atmosphere which reduces the height of the beam above the ground and hence one can measure the reflectivity at a lower height than in a homogeneous atmosphere [24-31]. In an analysis the physical quantity to be averaged is the rain intensity while the primarily measured quantity is the reflectivity, which is related nonlinearly to the rain intensity. For this reason averaging in reflectivity introduces a bias which increases with the in homogeneity of the reflectivity field and with distance from the radar. In order to allow the reflectivity of a single scatterer to be calculated by using the Rayleigh approximation the scatterer has to be small compared to the wavelength i.e. the diameter should be 10 to 16 times smaller than the wavelength. It thus appears that the largest particle should be smaller than 10 mm, 5 mm and 3 mm for S-, C- and X-band radars respectively [32-35].
In tropical climates, like India, the rain drops of 8 mm are frequently observed while the frozen hydrometeors may be even larger than 10 mm. These large particles reflect much less than considered by Rayleigh approximation and so they are estimated to be smaller than they are in reality. In fact, these large particles are not suitably described by the normal drop size distributions that follow the Z-R relation. Besides, other errors that may be present in the estimation of radar precipitation include reflections received from variety of non-meteorological targets like aircrafts, chaffs, insects, birds, solar radiation etc [9, 27, 36].
References
[1] Fulton, R., J. Breidenbach, D.-J. Seo, D. Miller and T. O'Bannon, “The WSR-88D rainfall algorithm”, Wea. Forecasting. 13, 377, 1998.
[2] Golding, B.W., “Nimrod: A system for generating automated very short range forecasts”, Meteorol. Appl. 5(1), 1, 1998. [3] Doviak, R., D. Zrnić,. “Doppler Radar and Weather Observation”, Academic Press Inc., second edition, 560, 1993.
[4] Collier, C.G., “Applications of weather radar systems: a guide to uses of radar data in meteorology and hydrology”, Ellis Horwood Limited Publishers.408, 1996.
[5] Sauvageot, H., “Radar Meteorology”,Artech House, 370, 1992.
[6] Bringi, V.N. and V. Chandresekhar, “Polarimetric Doppler Weather Radar”, Cambridge University Press, 2001. [7] Rinehart, R.E., “Radar for Meteorologists”, Rinehart Publications, Grand Forks, 428, 1997.
[8] Joss, J. and A. Waldvogel,. “Precipitation measurement and hydrology”, In: Radar in Meteorology, 577, 1990. [9] Sen, A.K. and A.B.Bhattacharya, “Radar Systems and Radio Aids to Navigation”, Khanna Publishers, New Dehi, 2009. [10] Marshall, J.S. and W.M. Palmer, “The distribution of raindrops with size”, J. Meteorol. 5, 165, 1948.
[11] Battan, L.J., “Radar Observation of the Atmosphere”, Univ. of Chicago Press, Chicago, 324, 1973.
[12] List, R., “A linear radar reflectivity – rain rate relationship for steady tropical rain”, J. Atmos. Sci. 45, 3564, 1988. [13] Marshall, J.S., W. Hitschfeld and K.L.S. Gunn, “Advances in radar weather”,Adv. Geophys. 2, 1, 1955.
[14] Uijlenhoet, R., “Parameterization of rainfall microstructure for radar meteorology and hydrology”,Doctoral dissertation, Wageningen University, The Netherlands, 279, 1999.
[15] Uijlenhoet, R., “Raindrop size distributions and radar reflectivity-rain rate relationships for radar hydrology”, Hydrol. Earth Syst. Sci., 5, 615, 2001.
[16] Olsen, R., D. V. Roger, and D. B. Hodge, “The aRb relation in the calculation of rain attenuation” Transactions of the Institution of Electrical and Electronics Engineers, Antennas and Propagation, 26, 318, 1978.
[17] Mapiam, P.P., and N.Sriwongsitanon, “Climatological Z-R relationship for radar rainfall estimation in the upper Ping river basin”, ScienceAsia.34,215,2008.
[18] Stutzman, W. L., and W. K. Dishman, “A simple model for estimation of rain induced attenuation along the earth- space path”, Radio Science, 17, 1465, 1982.
[19] Ajayi, G. O., and L. B. Kolawole, “ Centimeter and millimeter wave attenuation by atmospheric gases and rainfall at tropical station” International Journal of Infrared and Millimeter waves. 5, 919, 1984.
[20] CCIR, “Propagation data and prediction method required for earth-space communication systems”, CCIR Report No. 564-3, International Telecommunication Union, 1986.
[21] Capsoni, C., and A. Paraboni, “A multipurpose model for the structure of precipitation: Statistical assessment against radar data”, URSI Symposium, Rio de Janeiro, 1990.
[22] Arnold, H. W., D. C. Cox and H. H. Hoffman, “Fade duration and Interfade Interval Statistics Measured on a 19 GHz Earth Space path”, IEEE Trans. on Comm., 30(1), 265, 1982.
[23] Cox, D. C. and H. W. Arnold, “Results from the 19 and 28 GHz COMSTAR Satellite Propagation Experiments at Crawford Hill”, Proc. IEEE, 70(5), 458, 1982.
[24] Harden, B. N., J. R. Norbury and W. J. K. White, “Measurements of Rainfall for Studies of Millimetric radio Attenuation”, Microwave, Opt. and Acoustics, 1(6), 197, 1977.
[25] R. Harikumar, R., V.Sasi Kumar, S. Sampath and P.V.S.S.K. Vinayak, “Comparison of drop size distribution between stations in Eastern and Western coasts of India”J. Ind. Geophys. Union .2(2), 111, 2007.
[26] Vivekanandan J., G. Zhang, S. M. Ellis, D. Rajopadhyaya,and S. K. Avery, “Radar reflectivity calibration using differential propagation phase measurement”, Radioscience, 38(3), 8049, doi:10.1029/2002RS002676, 2003.
[27] Matricciani, E. and M. Mauri, “Rain Attenuation Successive Fade Durations and Time Intervals Between Fade in a Satellite Earth Link”, Elect. Lett. 22(12), 656, 1986.
[28] Villar, E., A. Burgueno, M. Puigcerver and J. Austin, “ Analysis of Joint Rainfall Rate and Duration statistics: Microwave Systems Design Implications”, IEEE Trans. on Comm., 36(6), 650, 1988.
[29] CCIR, “Propagation in non-ionized media”, Report No. 72-1, 1978.
[30] Flavin R. K., “Rain attenuation considerations for satellite paths in Telecommunication”, Australia Research Laboratory, Report No. 7505, 1981.
[31] Goldhirsh, J., N. E. Gebo, and J. R. Rowland, “Variability of slant path attenuation statistics in the mid Atlantic coast region of the United States Ku band”, International Conference on antennas and Propagation, Coventry, 1989.
[32] Burgueno, A., J. Austin, E. Villar and M. Puigcerver, “Analysis of Moderate and Intense Rainfall Rates Continuously Recorded over Half a Century and Influence on Microwave Communications Olanning and Rain Rate Data Acquisition”, IEEE Trans. on Comm., 35(4), 382, 1987.
[33] Matricciani, E., “Predictions of rain attenuation in a slant paths in equatorial areas: Application of two layer rain model”, Electronics Letters (U. S. A.). 29, 72, 1993.
[34] Timothy, K. I., S. Sharma, A. K. Barbara, and M. Devi, “ Rain attenuation characteristics: An observational study over LOS microwave link at 11 GHz”, Indian Journal of Radio and Space Physics, 23, 130, 1994.
[35] Hall, M. P. M., “Effects of the troposphere on a radio communication”, IEE Electromagnetic Wave series & Peter Peregrinus LTD, UK and USA, 1979.
[36] Mali, P., S. K. Sarkar, and J. Das, “Rain drop size distribution from radar reflectivity measurements”, Indian J. Radio and Space Physics, 32, 296, 2003.
[37] Oguchi, T., and Y. Hosoya, “Scattering properties of oblate raindrop and cross polarization of radio wave due to rain (pt. 2) calculations at microwave and millimeter wave region”, J. Radio Research Laboratories, 21, 191, 1974.
[38] Olsen, R. L., D. V, Rogers, and D. B. Hodge, “The relation aRb in the calculation of rain attenuation”, IEEE Transactions on Antenna and Propagation, 26, 318, 1978.
[39] Prasad, M. V. S. N., S. K. Sarkar, S. Mangal, and B. M. Reddy, “Comparision of rain attenuation prediction methods for earth-space paths over northern India”, Indian J. Radio and Space Physics, 23, 135, 1994.
![Figure 1 Experimental raindrop size distributions (circles, crosses) present in a volume of air and fitted exponential parameterization (solid lines) for different rain rates [10] represented as A: 1.0 mm h -1 ; B: 2.8 mm h -1 ; C: 6.3 mm h -1 ; D: 23.0 m](https://thumb-eu.123doks.com/thumbv2/123dok_br/17324852.249967/3.892.190.712.117.520/figure-experimental-raindrop-distributions-exponential-parameterization-different-represented.webp)