Brief Communication
Comunicação Breve
Sensitivity and specificity of the Percentage
of Consonants Correct-Revised in the
identification of speech sound disorder
Sensibilidade e especificidade da Porcentagem
de Consoantes Corretas Revisada na
identificação do transtorno fonológico
Tatiane Faria Barrozo1Luciana de Oliveira Pagan-Neves1 Joyce Pinheiro da Silva1 Haydée Fiszbein Wertzner1
Keywords
Speech-language Pathology and Audiology Diagnosis Speech Language Sensibility
Speciicity
Descritores
Fonoaudiologia Diagnóstico Fala Linguagem Sensibilidade
Especiicidade
Correspondence address:
Haydée Fiszbein Wertzner
R. Cipotânea, 51, Cidade Universitária, Butantã, São Paulo (SP), Brazil, CEP: 05360-160.
E-mail: [email protected]
Received: February 19, 2016
Accepted: October 24, 2016
Study carried out at Departamento de Fisioterapia, Fonoaudiologia e Terapia Ocupacional, Faculdade de Medicina, Universidade de São Paulo – USP - São Paulo (SP), Brazil
1 Universidade de São Paulo – USP - São Paulo (SP), Brazil.
Financial support: Fundação de Amparo à Pesquisa do Estado de São Paulo (FAPESP), process nº 2008/57145-2.
Conlict of interests: nothing to declare. ABSTRACT
Purpose: The purpose of the study was to determine the sensitivity and speciicity, and to establish cutoff points for
the severity index Percentage of Consonants Correct - Revised (PCC-R) in Brazilian Portuguese-speaking children with and without speech sound disorders. Methods: 72 children between 5:00 and 7:11 years old - 36 children without speech and language complaints and 36 children with speech sound disorders. The PCC-R was applied
to the igure naming and word imitation tasks that are part of the ABFW Child Language Test. Results were statistically analyzed. The ROC curve was performed and sensitivity and speciicity values of the index were veriied. Results: The group of children without speech sound disorders presented greater PCC-R values in both tasks, regardless of the gender of the participants. The cutoff value observed for the picture naming task was
93.4%, with a sensitivity value of 0.89 and speciicity of 0.94 (age independent). For the word imitation task, results were age-dependent: for age group ≤6:5 years old, the cutoff value was 91.0% (sensitivity of 0.77 and speciicity of 0.94) and for age group >6:5 years-old, the cutoff value was 93.9% (sensitivity of 0.93 and speciicity
of 0.94). Conclusion: Given the high sensitivity and speciicity of PCC-R, we can conclude that the index was
effective in discriminating and identifying children with and without speech sound disorders.
RESUMO
Objetivo: Veriicar a sensibilidade, especiicidade e estabelecer pontos de corte para o índice Porcentagem de
Consoantes Corretas Revisado (PCC-R) em crianças com e sem transtorno fonológico falantes do Português Brasileiro. Método: Participaram 72 crianças com idade entre 5:00 e 7:11 anos, sendo 36 sem queixas de
alteração de fala e linguagem e 36 crianças com diagnóstico fonoaudiológico de transtorno fonológico. O índice de gravidade PCC-R foi aplicado nas provas de nomeação de iguras e de imitação de palavras do Teste de
Linguagem Infantil ABFW. Os resultados foram analisados estatisticamente. Foi realizada a curva Roc e obtidos
os valores de sensibilidade e especiicidade do índice. Resultados: O grupo de crianças sem transtorno fonológico apresentou valores do PCC-R maiores nas duas provas, independentemente do gênero dos participantes. O valor
de corte na prova de nomeação de iguras foi de 93,4%, com sensibilidade de 0,89 e especiicidade de 0,94,
independentemente da idade. Já na prova de imitação de palavras, os valores obtidos variaram de acordo com
a idade. Para a faixa etária ≤6:5 anos, o valor de corte foi de 91,0%, com sensibilidade de 0,77 e especiicidade de 0,94. Para a faixa etária >6:5 anos, o valor de corte foi de 93,9%, com sensibilidade de 0,93 e especiicidade
de 0,94. Conclusão: Dada a alta sensibilidade e especiicidade do PCC-R, o índice foi efetivo na discriminação
INTRODUCTION
Children with Speech Sound Disorder (SSD) widely differ with respect to their manifestations of speech and language(1,2).
Some distort sounds, others replace them, yet others omit them. These simpliications of speech and sound patterns are called phonological processes. The literature cites three most common types of phonological processes: the syllabic structure, which alters the syllabic structure of words, following the general trend of reducing words to the structure of Consonant Vowel (CV); those of substitution, in which a sound is replaced by another one belonging to another class, sometimes reaching an entire class of sounds; and those of assimilation, in which the sounds change, becoming similar to an adjacent sound (preceding or succeeding)(3,4). Analysis of phonological processes is useful
to describe the phonological manifestations present in SSD(5).
The severity of SSD can vary at different degrees, and for this reason numeric indexes have been proposed to classify the disorder’s degree of compromise, whose classiication is obtained by means of speech samples. Several indexes are described in the literature with speciic characteristics and applications. One of the indexes proposed is the Percentage of Consonants Correct (PCC)(6), which counts the total amount of consonants
correctly produced from a speech sample, divided by the total number of consonants existing in the sample.
In 1997, variations of the PCC index(7) were proposed with
the objective of helping to differentiate the subtypes of SSD: the PCC-Adjusted index (PCC-A), which does not consider typical distortions as mistakes, and the PCC-Revised (PCC-R), which does not consider any type of distortion as mistakes. For the authors, these indexes have speciic characteristics and applications. The PCC is a meritorious index to compare children with SSD between 3 and 6 years old, the PCC-A is used to compare children at different ages with speech impairment, while the PCC-R is applied when research involves speakers at different ages and varying characteristics.
The latter index has been widely cited in the literature in order to verify its eficacy in classifying the degree of speech impairment in speech sound disorder(8-13). However, there is no
age curve that demonstrates progress by means of its values and that makes it possible to verify if a child, at a certain age, is found within the expected value or not, which would aid identiication of speech sound disorders.
In a study conducted in 2007(9), the authors developed a
curve with PCC-R values during progress, supported by speech samples of English speakers taken from databases of various researchers. Although incomplete, it allows us to see that this index demonstrates children’s phonological competence. It is observed that the values found by these authors varied between 94% and 97% for the age range between 67 and 88 months.
In another study(14), children without SSD at the age range
between 4 and 7 years old (mean age of 5:5 years) presented, on average, a PCC-R of 97%. In 2012 and 2015(15,16), some authors
described the PCC-R proile in children without and with SSD, respectively. For children with normal speech development between 5 and 7 years of age, the authors indicated mean PCC-R values between 98.3% and 98.8%. For children with SSD aged
between 30 and 65 months, the PCC-R was on average from 73.8% to 80.7%.
Since these indexes were originally applied to English speakers, some studies were carried out to apply the indexes to the speech samples of Brazilian Portuguese speakers(8,17-19).
These indexes were effective in that they aided identiication of SSD in Brazilian Portuguese-speaking children. They also allowed for the quantitative indication of the child’s improvement during the therapeutic process and facilitated the decision about the appropriate time for discharge from speech-language therapy.
As the PCC-R index has proven to be effective in helping to identify SSD, obtaining evidence of cutoff values that indicates the presence of the disorder in children aged between 5:00 and 7:11 years may contribute to a greater precision of the classiication of the impairment caused by the disorder.
Thus, the objective of this study was to verify the sensitivity and speciicity, and to establish cutoff points of the PCC-R index in Brazilian Portuguese-speaking children with and without Speech Sound Disorder.
METHODS
This cross-sectional and observational study was approved by Comissão de Ética para Análise de Projetos de Pesquisa - CaPPesq of the Clinical Board of Hospital das Clínicas and Faculdade de Medicina da Universidade de São Paulo – HC/FMUSP under No. 0958/08. The parents and/or guardians of all individuals participating in the research have signed the Informed Consent and answered the anamnesis questions.
Seventy-two children aged between 5:00 and 7:11 of both genders participated in the research, where 36 did not present speech and language impairment complaints (CG) and came from public schools in São Paulo, and 36 children were diagnosed with speech sound disorder (SSD), having been assessed at a speciic laboratory of a university in São Paulo.
The inclusion criteria for the children in the CG were: lack of complaint from parents and/or teachers related to hearing, speech and language impairments; to present adequate performance on the ABFW Child Language Test(20) and on spontaneous speech
assessed from reading the story book Esconde-Esconde(21), as
well as on the vocabulary test of the ABFW Child Language Test(22). For the SSD, the inclusion criteria were: to present
impaired performance on the ABFW Child Language Test(20) and
spontaneous speech language tests from reading the story book
Esconde-Esconde(21), to present adequate performance on the
vocabulary test of the ABFW Child Language Test(22), and not
to be undergoing or have undergone speech-language therapy. All children were evaluated by speech-language therapists with experience in the ield of SSD, and were submitted to the evaluation protocols of the laboratory in which they were selected.
107 consonants. It should be noted that this index considers the distortions performed as correct(7).
The speech-language tests of all children were recorded during evaluation and later phonetically transcribed by two experienced speech-language therapists, who also calculated the PCC-R. In all cases, there was a minimum agreement of 80% between speech therapists.
Statistical methodology
Comparison of the age and gender distribution between the groups was performed by means of the statistical tests Student’s t-test and Qui-square, respectively. Comparison between the PCC-R index values measured in the igure naming (PCC-RN) and word imitation (PCC-RI) tasks for the groups was performed by the Mann-Whitney test. When there was a signiicant correlation, demonstrated by the Spearman correlation coeficient, between the index analyzed and age, both groups (CG and SSD) were subdivided into four new subgroups. Considering that the median age of the groups was 6:5 years old, the new groupings were: ≤6:5 years and >6:5 years. The combination of groups with age ranges gave rise to four subgroups: CG aged ≤6:5 years, CG aged >6:5 years, SSD aged ≤6:5 years, and SSD aged >6:5 years. The Kruskal-Wallis test was used to compare the four subgroups. When necessary, p-values were corrected by means of the Bonferroni method.
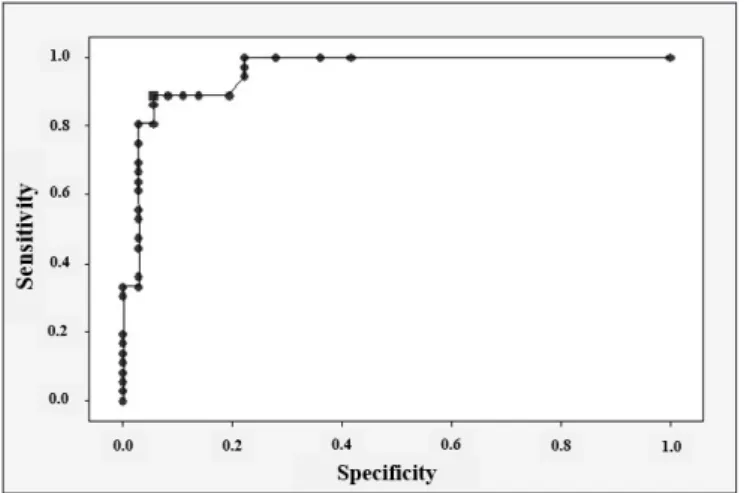
To determine the cutoff value of the PCC-R index, which allows to classify a new child as presenting a speech sound disorder or not, based on the naming and imitation tasks, the ROC curve was constructed. The cutoff value corresponds to the highest values of sensitivity and speciicity (simultaneously), represented by a square in the Figure constructed, for which the area is determined(23).
RESULTS
The results showed that the average age was 64 months in both groups. There was no difference for this variable (p=0.935) (Student’s t-test).
The majority of children in the CG were female (22 individuals), while in the SSD, the majority was male (25 individuals). The application of the chi-square test indicated a signiicant difference between the distributions as to gender in both groups (p=0.009).
Comparison between the genders for PCC-R in the igure naming task (PCC-RN) in the two groups showed no signiicant difference between the PCC-RN distributions in both the CG (p = 0.466) and the SSD (p=0.216) (Mann-Whitney test). The descriptive values of PCC-RN according to the group and gender are found in Table 1.
Upon comparing the CG and SSD, the results showed a signiicant difference between the PCC-RN distributions in the two groups (p<0.001), where the GC values were higher than in the SSD (Mann-Whitney test). In the correlation between PCC-RN and age, the results showed that, for the CG, the value observed was r=0.04 (p=0.800) and for SSD, r=0.19 (p=0.274) (Spearman’s correlation test), indicating that there
was no signiicant correlation between the PCC-R and age in both groups. Thus, the age variable was not considered for the analysis of the ROC curve.
The ROC curve (Figure 1) for the PCC-RN showed an area under the curve of 0.96, indicating a good ability of the test to discriminate. The cutoff value corresponding to the highest sensitivity and speciicity values (simultaneously) was 93.5%, indicating that any PCC-R value above this classiies the child as not presenting SSD. A sensitivity of 0.89 and speciicity of 0.94 are associated with this value.
On the word imitation task, it was observed that the PCC-R mean and median values were higher in the CG than in the SSD, in both the female and male genders (Table 2). The PCC-R values on the imitation task (PCC-RI) were more homogeneous in the CG than in the SSD. The results showed no signiicant difference between the PCC-RI distributions between the two
Table 1. Distribution of PCC-R descriptive values for the Figure Naming test according to group and gender
Group Gender N Mean Standard
deviation Median
CG
F 22 97.8 6.0 100
M 14 98.0 2.7 99.4 Total 36 97.9 4.9 100
SSD
F 11 71.8 15.6 75.9 M 25 77.5 18.2 81.1 Total 36 75.8 17.4 81.1 Caption: N = Number of children; CG = Control Group; SSD = Group with Speech Sound Disorder; F = Female; M = Male
Figure 1. ROC Curve for the PCC-R of Figure Naming Test
Table 2. Descriptive statistics for comparison between group and gender in the PCC-R phonological measurement of the Word Imitation Test
Group Gender N Mean Standard deviation Median
CG
F 22 98.2 3.7 99.8
M 14 96.9 3.6 98.9
Total 36 97.7 3.6 99
SSD
genders, both in the CG (p=0.081) and in the SSD (p=0.303) (Chi-square test).
In the correlation between PCC-RI and age, the results showed that, for the CG, the observed value of the Spearman correlation coeficient was r=0.49 (p=0.003) and for the SSD, r=0.08 (p=0.663), indicating a signiicant correlation between the PCC-RI and age only in the CG.
Due to this signiicant correlation and considering that the median age was 6:5 years, we chose to create two new groups according to age ranges: ≤6:5 years and >6:5 years. The combination of the groups with age ranges gave rise to four subgroups: CG aged ≤6:5 years, CG aged >6:5 years, SSD aged ≤6:5 years, and SSD aged >6:5 years. There was a signiicant difference between the PCC-R distributions in the four subgroups
(p<0.001) (Kruskall-Wallis), with values in the CG tending to be higher than in the SSD for the age range ≤ 6:5 years (p<0.001) and >6: 5 years (p<0.001).
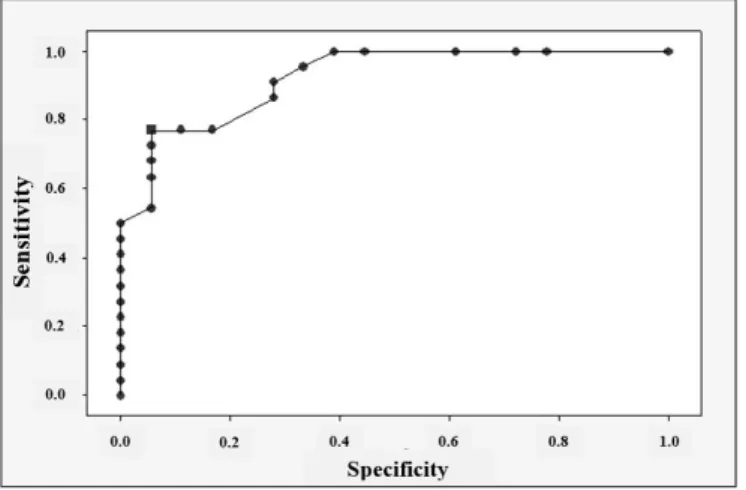
The ROC curve for the PCC-RI in the age range ≤6:5 is presented in Figure 2, and for the age group >6:5, in Figure 3. The cutoff value corresponding to the highest sensitivity and speciicity values (simultaneously) for the PCC-RI in the age range ≤6:5 years was 91.0%. A sensitivity of 0.77 and speciicity of 0.94 are associated with this value. For the age range >6:5 years, the cutoff point was 93.9%. A sensitivity of 0.93 and speciicity of 0.94 are associated with this value.
The results showed that in both the word imitation and igure naming tasks the number of individuals above the cutoff values found for each task was higher in the CG than in the SSD (Table 3).
DISCUSSION
The PCC-R(4) index was applied in several studies that aimed
to analyze speech impairment in children with SSD, both at diagnosis(10,14,16) and in treatment progression(13). In particular,
several studies with Brazilian Portuguese speakers have shown signiicant differences in PCC-R values as they compared children with and without SSD at different ages(8,17-19).
With the constant use of this index, it was observed that studying its sensitivity and speciicity and verifying the cutoff value of PCC-R in the ROC curve for two different speech samples would provide very important data both for clinical practice and research. Thus, that was the objective of this study, where results indicated high sensitivity and speciicity values both in the igure naming and word imitation tasks. We also observed that, in both phonology tasks, the PCC-R index presented higher values for speciicity, which demonstrates greater accuracy to indicate the children who do not present Speech Sound Disorders.
The results of the sensitivity and speciicity analysis indicated the cutoff value (ROC curve) of 93.4% for the PCC-R in the igure naming task. As for the analysis of the PCC-R on the word imitation task, a correlation with age was observed in the control group and, therefore, the children were grouped according to age for this task. For the subgroup ≤6:5 years, the cutoff value was 91.0%, while for the group >6:5 years the value was 93.9%.
Regarding the inluence of age on the PCC-RI, one aspect to be highlighted is that, on the imitation task, the child hears the stimulus and repeats it immediately - unlike the igure naming task, in which they need to access their lexicon, recognize the
Figure 2. ROC Curve for the imitation PCC-R in age range ≤6:5 years
Figure 3. ROC Curve for the imitation PCC-R in age range >6:5 years
Table 3. Description of the number of individuals above the cutoff point in each phonology test for the CG and SSD
Group
Naming (PCC-R 93.4%) Imitation
N Total N of children above cutoff point
≤ 6:5 years (PCC-R 91.0%) ≤ 6:5 years (PCC-R 93.9%)
N Total N of children
above cutoff point N Total
N of children above cutoff point
CG 36 34 17 16 18 18
SSD 36 4 19 3 17 3
stimulus and, subsequently, pronounce the word according to their knowledge. As demonstrated in several studies, cognitive and linguistic skills may facilitate the motor skills involved in the production of speech sounds(24,25). Thus, naming as a result
of linguistic and cognitive interference can act as a stimulus for the articulatory gestures involved in the production of speech sounds and minimize the age difference in production of speech sounds.
As pointed out before, since its proposal in 1997(7) the PCC-R
index has been applied in different studies with children in order to describe phonological competence and accuracy, as it relects the speech-language acquisition in the child’s linguistic environment(26). However, there is no age curve that demonstrates
phonological development by means of its values. The studies conducted for the English language(9,14-16) found values close to
those presented here, and small variations may occur depending on the language itself and/or the test used for data collection.
Therefore, this study’s results show that the PCC-R index is effective to indicate the absence of SSD in children aged between 5:00 and 7:11 years. It also indicates that the index can be applied to speech samples collected in igure naming and word imitation tasks. The values obtained in this study are close to those presented for English speakers.
The contribution of the study is relected in the speech-language pathology research as well as in clinical practice, insofar as it allows greater safety in indicating the absence of SSD. In particular, in clinical practice, the application of the PCC-R to the phonology test may aid in indicating immediate intervention or parent/guardian guidance to achieve adequate speech development. In addition, the PCC-R index can also be used throughout the speech-language intervention to verify the change in the child’s speech impairment proile.
CONCLUSION
The cutoff value obtained by means of the ROC curve suggests that, for the word imitation task of ABFW Child Language Test, there was an inluence of age, where the cutoff values for the age range ≤6:5 years were 91.0% and for the age range >6:5 years, 93.9%. For the igure naming task, the cutoff value was 93.4%. Thus, although the PCC-R index has shown to be more speciic than sensitive, we can conclude that its application is effective in identifying children with and without SSD.
REFERENCES
1. Wren Y, Miller LL, Peters TJ, Emond A, Roulstone S. Prevalence and predictors of persistent speech sound disorder at eight years old: findings from a population cohort study. J Speech Lang Hear Res. 2016;59(4):1-27. http://dx.doi.org/10.1044/2015_JSLHR-S-14-0282. PMid:27367606. 2. Dodd B. Differential diagnosis of pediatric speech sound disorder. Curr
Dev Disord Rep. 2014;1(3):189-96. http://dx.doi.org/10.1007/s40474-014-0017-3.
3. Ingram D. Phonological disability in children. London: Edward Arnold; 1976.
4. Stoel-Gammon C, Dunn C. Normal and disordered phonology in children. Austin, Texas: Pro-ed; 1985.
5. McLeod S, Harrison LJ, McAllister L, McCormack J. Speech sound disorders in a community study of preschool children. Am J Speech Lang
Pathol. 2013;22(3):503-22. PMid:23813192. http://dx.doi.org/10.1044/1058-0360(2012/11-0123).
6. Shriberg LD, Kwiatkowski J. Phonological disorders I: a diagnostic classification system. J Speech Lang Hear Res. 1982;46(3):197-204. PMid:7186559.
7. Shriberg LD, Austin D, Lewis BA, McSweeny JL, Wilson DL. The Percentage of Consoants Correct (PCC) metric: extensions and reliability data. J Speech Lang Hear Res. 1997;40(4):708-22. PMid:9263938. http:// dx.doi.org/10.1044/jslhr.4004.708.
8. Wertzner HF, Papp ACCS, Amaro L, Galea DES. Relação entre os processos fonológicos e classificação perceptiva de inteligibilidade de fala no transtorno fonológico. Rev Soc Bras Fonoaudiol. 2005;10(4):193-200.
9. Campbell TF, Dollaghan C, Janosky JE, Adelson PD. A performance curve for assessing change in Percentage of Consonants Correct–Revised (PCC-R). J Speech Lang Hear Res. 2007;50(4):1110-9. PMid:17675608. http://dx.doi.org/10.1044/1092-4388(2007/077).
10. Stockman IJ. Toward validation of a minimal competence phonetic core for african american children. J Speech Lang Hear Res. 2008;51(5):1244-62. PMid:18728112. http://dx.doi.org/10.1044/1092-4388(2008/07-0081). 11. Vilela N, Wertzner HF, Sanches SGG, Neves-Lobo IF, Carvallo RMM.
Processamento temporal de crianças com transtorno fonológico submetidas ao treino auditivo: estudo piloto. J Soc Bras Fonoaudiol. 2012;24(1):42-8. PMid:22460371. http://dx.doi.org/10.1590/S2179-64912012000100008. 12. Campbell TF, Dollaghan C, Janosky JE, Rusiewicz HL, Small SL, Dick F, et al. Consonant accuracy after severe pediatric traumatic brain injury: a prospective cohort study. J Speech Lang Hear Res. 2013;56(3):1023-34. PMid:23275427. http://dx.doi.org/10.1044/1092-4388(2012/12-0077). 13. Gierut JA, Morrisette ML, Dickinson SL. Effect size for single-subject design
in phonological treatment. J Speech Lang Hear Res. 2015;58(5):1464-81. PMid:26184118. http://dx.doi.org/10.1044/2015_JSLHR-S-14-0299. 14. Lewis BA, Avrich AA, Freebairn LA, Gerry Taylor H, Iyengar SK, Stein
CM. Subtyping children with speech sound disorders by endophenotypes. Top Lang Disord. 2011;31(2):112-27. PMid:22844175. http://dx.doi. org/10.1097/TLD.0b013e318217b5dd.
15. Potter NL, Hall S, Karlsson HB, Fourakis M, Lohmeier HL, McSweeny JL, et al. Reference data for the Madison Speech Assessment Protocol (MSAP): a database of 150 participants 3-to-18 years of age with typical speech (No. 18, Technical Report, Phonology Project). Madison: Waisman Center, University of Wisconsin-Madison; 2012.
16. Mabie HL, Fourakis M, Hall SD, Karlsson HB, McSweeny JL, Tilkens CM, et al. Conversational speech reference data for children with speech delay: a database of 180 Participants, 3-to-5 years of age (No. 21, Technical Report, Phonology Project). Madison: Waisman Center, University of Wisconsin-Madison; 2015.
17. Wertzner HF. O distúrbio fonológico em crianças falantes do português: descrição e medidas de severidade [tese]. São Paulo: Universidade de São Paulo; 2002. 228 p.
18. Wertzner HF, Pagan-Neves LO, Galea DES, Papp ACCS. Características fonológicas de crianças com transtorno fonológico com e sem histórico de otite média. Rev Soc Bras Fonoaudiol. 2007;12(1):41-7. http://dx.doi. org/10.1590/S1516-80342007000100009.
19. Wertzner HF, Amaro L, Galea DES. Phonological performance measured by Speech Severity Indexes related to correlated factors. Sao Paulo Med J. 2007;125(6):309-14. PMid:18317599. http://dx.doi.org/10.1590/S1516-31802007000600002.
20. Wertzner HF. Fonologia. In: Andrade CRF, Befi-Lopes DM, Fernandes FDM, Wertzner HF. ABFW Teste de linguagem infantil nas áreas de fonologia,
vocabulário, fluência e pragmática. Carapicuíba: Pró-Fono; 2004. p. 5-31.
21. Furnari E. Esconde-esconde. 5 ed. São Paulo: Ática; 1993.
22. Befi-Lopes DM. Vocabulário. In: Andrade CRF, Befi-Lopes DM, Fernandes FDM, Wertzner HF. ABFW Teste de linguagem infantil nas áreas de
fonologia, vocabulário, fluência e pragmática. Carapicuíba: Pró-Fono;
2004. p. 33-49.
24. Nip ISB, Green JR, Marx DB. Early speech motor development: cognitive and linguistic considerations. J Commun Disord. 2009;42(4):286-98. PMid:19439318. http://dx.doi.org/10.1016/j.jcomdis.2009.03.008. 25. Nip ISB, Green JR, Marx DB. The co-emergence of cognition, language,
and speech motor control in early development: A longitudinal correlation study. J Commun Disord. 2011;44(2):149-60. PMid:21035125. http:// dx.doi.org/10.1016/j.jcomdis.2010.08.002.
26. Vick JC, Campbell TF, Shriberg LD, Green JR, Abdi H, Rusiewicz HL, et al. Distinct developmental profiles in typical speech acquisition.
J Neurophysiol. 2012;107(10):2885-900. PMid:22357794. http://dx.doi. org/10.1152/jn.00337.2010.
Author contributions