* Universidade Federal de Santa Catarina, Núcleo de Pesquisa em Cinean-tropometria & Desempenho Humano.
1. Mestrando em Educação Física do Centro de Desportos da Universidade Federal de Santa Catarina – Florianópolis/Santa Catarina/Brasil (crrech @hotmail.com).
2. Professor Dr., Centro de Desportos da Universidade Federal de Santa Catarina, Coordenador e Líder do Núcleo de pesquisa em Cineantropo-metra e Desempenho Humano – Florianópolis/Santa Catarina/Brasil ([email protected]).
3. Professora Dr., Centro de Desportos da Universidade Federal de Santa Catarina – Florianópolis/Santa Catarina/Brasil ([email protected]). 4. Médico Especialista em Clínica Médica do Centro de Ciências da Saúde
da Universidade Federal de Santa Maria – Santa Maria/Rio Grande do Sul/Brasil.
Received in 14/12/04. Final version received in 12/11/05. Approved in 29/11/05. Correspondence to: Edio Luiz Petroski, Universidade Federal de Santa Catarina, Centro de Desportos/Departamento de Educação Física, Campus Universitário, Trindade, Caixa Posta 476 – 88010-970 – Florianópolis, SC. Tel.: (48) 331-8562. E-mail: [email protected]
Anthropometric indicators of fat-mass
excess among women
*
Cassiano Ricardo Rech1, Edio Luiz Petroski2, Rosane Carla Rosendo da Silva3
and João Carlos Nunes da Silva4
O
RIGINALA
RTICLEKeywords: Body mass index. Reciprocal of ponderal index. Obesity. Overweight. Middle-aged women.
ENGLISH VERSION
ABSTRACT
The aim of this study was to determine the sensitivity, specific-ity and the level of association between two indicators of over-weight and obesity among women. Sixty-five women (from 50-77 years of age) participated in the study. They showed mean body mass of 70.3 ± 11 kg and mean stature of 158.0 ± 5.5 cm. The body mass index (BMI) and the reciprocal of ponderal index (RPI) were computed. Percent of body fat, estimated by the dual-ener-gy x-ray absorptiometry (%BFDXA), was used as the gold standard measure. Data analyses consisted of descriptive statistics, Pear-son’s linear correlation and the Kappa index. The means for BMI, RPI and %BFDXA were, respectively, 28 ± 4.2 kg.m-2, 38 ± 1.9 cm.kg -1/3 and 38.1 ± 6.0. A high prevalence of overweight was detected,
regardless the method (%BFDXA = 89.2%, > 28%, RPI = 83,1% and BMI = 73,8%). Pearson’s lineal correlation coefficients between %BFDXA and RPI (r = -0.76) and %BFDXA and BMI (r = 0.72) were both significant (p < 0.01). The Kappa index showed an association of 0.31 between the %BFDXA and BMI and of 0.48 between %BFDXA and RPI. The anthropometric indicators presented high sensitivity and specificity values (80% and 55% for BMI 87,7% and 75% for RPI, respectively). The ROC curve analyses showed areas under the curve of 0.80 for BMI and 0.83 for RPI, which did not differ (p > 0.05). The cutoff points of 27.3 kg.m-2 for BMI and 39.3 cm.kg-1/ 3 for RPI presented a better relationship between sensitivity and
specificity in determining overweight. Therefore, it is concluded that both BMI and RPI are good indicators for identifying overweight in women aged over 50 years as they presented high sensitivity and specificity.
INTRODUCTION
Malnutrition, overweight and obesity represent risk factors to many diseases(1,2). The World Health Organization (WHO)
identi-fied malnutrition as the main risk factor to disease development for all causes in developing countries, and overweight is in tenth place, in developed and in developing countries(1,3).
In the US, various studies report that about 65% of the popula-tion is overweight and 30% is considered clinically obese(4,5). The
survey conducted in 2001 showed that 20 American states pre-sented overweight prevalence between 15 and 19%, and in three states this index surpassed 25%, showing an increase of 5.6% a year(6). In Europe, it is estimated that 10-20% of men and 10-25%
of women are overweight.
Data from IBGE (Instituto Brasileiro de Geografia e Estatística) and of two population surveys conducted in Brazil, in the last years (Estudo Nacional da Despesa Familiar – ENDEF – and Pesquisa Nacional sobre Saúde e Nutrição – PNSN)(2,7), indicate a significant
increase in prevalence of overweight and obesity in the popula-tion. Among people older than 60 years of age, the results show a prevalence of overweight around 27% in men and 38% in women, and 10% of that population is considered obese(2,7).
The increase in the prevalence of overweight and obesity has led WHO(1) to determine overweight a public health problem, since
it is related to the increased risk to disease development, and leads to serious health problems, when associated with an inadequate lifestyle (smoking, alcohol, inactivity)(8).
Clinical evaluation of overweight and obesity in epidemiological studies has commonly been conducted by using anthropometric measures of body mass and stature or a combination of both, due to their practicability, low cost and easy interpretation of results.
Other indicators, such as body mass divided by stature, the cube root of body mass divided by stature (ponderal index) and stature divided by cube root of body mass (Sheldon index), are also used to identify malnutrition, overweight and obesity(9). The Body Mass
Index (BMI), developed by Quetelet in 1871, is one of the most used procedures to evaluate the overweight and obesity in epide-miologic studies.
Such indicator presents high association with many chronic and non-transmissible diseases(10,11), and risk for various health
condi-tions, such as increased risk for developing cardiovascular diseas-es, hypertension(12), LDL-cholesterol, increase in blood triglycerides
concentration in the diabetes(12,13) and some kinds of cancer(14).
Some authors suggest that, despite BMI being internationally accepted as an indicator of nutritional state, it presents limitations: 1) the relationship with body proportionality, people with short legs will have increased BMI; 2) relationship with fat-free mass, espe-cially in men, because a high muscle mass can lead to misinterpre-tation of obesity; 3) correlation with stature, despite being low, it can be significant, especially in children and adolescents(15). In old
people, sarcopenia (muscle mass reduction), accumulation of and centrally distributed fat are limiting factors for BMI use(16,17).
of these indicators(9), and is mathematically more robust indicator
for identifying fat excess than BMI(17), since body mass
measure-ment (tridimensional measuremeasure-ment) is on the denominator and rep-resents more accurately changes in body structure(9,17). However,
there are few studies that relate RPI with the presence of chronic and non-transmissible diseases or show this evidence.
Besides overweight and obesity indicators, estimation of per-cent of body fat (%BF) has also great acceptability for fat-mass excess identification(18). The %BF estimation is commonly
per-formed by hydrodensitometry technique (hydrostatic weighting), which has been widely accepted as the “gold standard” tech-nique(18,19). In old people, this evaluation, which needs submersed
weight, is hard to be taken and also demands a long time(20).
Thus, other laboratory techniques have been developed and improved to %BF estimate(21,22). The dual-energy x-ray
absorptiom-etry (DEXA) seems to be an alternative to the problems presented by hydrodensitometry. This technique allows for a rapid evaluation and with reliable data when comparing to hydrostatic weighting. Some authors consider DEXA as a successor for hydrodensitome-try because of the technique evolution over the years(18,20,21).
Although being considered of highly operational cost and having some limitations, such as the use of constant values for tissue hydration and non age-specific softwares(22), DEXA has been
ac-cepted in validation studies and in body composition evaluation of new anthropometric techniques.
However, the use of anthropometric indicators for nutritional status determination presents several problems when compared to body fat analyses, especially in older people.
Some examples illustrate this fact. In a study conducted by Sardinha et al.(23), a mean %BF of 42.6% was reported with older
women, while mean BMI was 27.8 kg.m-2. In the study of
Horto-bágyi et al.(24), with middle-aged men and women, it was observed
that 40% of the women where classified as obese according to the %BF criterion, however, when BMI cutoff was adopted, only 12% were classified as such.
These examples reveal a serious problem in score interpreta-tion obtained by anthropometric indicators in older people, demon-strating that the same subject can have a different diagnosis ac-cording to the applied criterion.
Thus, with the limitations presented for estimates of body com-ponents in population studies, it is necessary, and urgent, to devel-op and validate anthrdevel-opometric indicators of easy application, low cost and with a large applicability such as BMI and RPI.
Hence, this study had the aim to analyze BMI and RPI sensitivity and specificity in the identification of fat-mass excess in women older than 50 years of age, having DEXA as reference measure-ment.
METHODS
The study was characterized as a prospective correlational de-scriptive(25). Sixty-five women between 50 and 77 years of age were
evaluated. The sample was selected by a non-probabilistic proce-dure. Women from groups of physical activities in the city of Santa Maria-RS were invited to participate and all of them were appar-ently healthy. To be included in the sample, the subjects could not wear any kind of fixed prosthesis, be under medical treatment, diets or be on diuretics, which could interfere with the study re-sults.
Before the study, the participants were asked to sign an inform consent. The subjects were distributed into five age groups to better represent the age relationship: 50-55 years (n = 12); 56-60 years (n = 14); 61-65 years (n = 12); 66-70 years (n = 14) and 71-77 years (n = 13).
Anthropometric measurements
The anthropometric data were body mass (kg) and stature (cm). Measurements followed the procedures described Alvarez and
Pa-van(26), all taken by the same evaluator. A scale with a resolution of
100 g (ARJA) and a stadiometer with 1 mm of resolution (Sanny) were used for data collection.
From body mass scores (BM) and stature (ST), BMI and RPI were calculated according to the following equations:
Body Mass Index (BMI) BMI (kg.m-2) = BM (kg)/ST2 (m)
Reciprocal of Ponderal Index (RPI) RPI (cm.kg-1/3) = ST (cm)/BM1/3 (kg)
Fat-mass measurement
To %BF evaluation, DEXA exams were performed in a HOLOG-IC QDR 4500 fan Beam X-Ray Bone Densitometer (Walthan, MA 02154-USA) from the Instituto de Densitometria Óssea de Santa Maria-(OSTEOLAB), RS. To guarantee measurement quality, the equipment was daily calibrated according to the manufacturer’s specifications. All the examinations were conducted by a techni-cian certified in medical radiology. Only total fat-mass measure, expressed in percent (%BFDEXA), was considered for this study.
Subjects were recommended to follow a routine procedure be-fore the exam, in order to avoid measurement error: to maintain regular diet on the previous days, not to smoke, not to ingest alco-holic drinks 24 hours before the test, not to use diuretic medica-tion, and not to change the hydration pattern.
Allowing for data analysis, subjects were classified either as normal or with fat-mass excess, using the cutoff points for BMI, RPI e %BFDEXA shown in box 1.
BOX 1
Cutoff points used for data analysis
Method Cutoff points
BMI (kg.m-2)a < 22 – underweight
22.1 a 27 – normal > 27 – fat-mass excess RPI (cm.kg-1//3)b > 44 – underweight
41 a 44 – normal < 41 – fat-mass excess Fat-mass (%)c < 20 – underweight
20 a 30 – normal > 30 – fat-mass excess
a: Lipschitz(27)
b: Ricardo and Araújo(17)
c: Lohman(18)
The BMI > 27 kg.m-2 cutoff point was used to determine
sensi-tivity and specificity and to represent fat-mass excess, according to classification to the elderly(27). The cutoff point established by
Ricardo and Araújo(17) for children and adolescentswas considered
for RPI classification, due to the lack of specific cutoff points for older people. The %BF classification followed Lohman(18)
recom-mendation for women over 50 years of age, where obesity is char-acterized by more than 30% of fat mass.
Sensitivity and specificity analyses of fat-excess indicators (BMI and RPI) and %BFDEXA was also used, considering false-positive, false-negative, true negative and true positive cases as shown in figure 1.
In this case, the term sensitivity refers to quality of the test in diagnosing cases of “true disease”, that is, it informs the accuracy of the anthropometric indicators (RPI e BMI) in identifying people with fat excess, who are also diagnosed as such in relation to the criterion measurement(28). The higher the sensitivity, the lower will
Women between 56-60 years of age showed the lowest values for all fat excess indicators (%BF, BMI e RPI), although not signifi-cant (p > 0,05).
Table 3 presents the prevalence of fat excess according to dif-ferent indicators. It is observed that 89.2% of the sample showed fat excess when the %BFDEXA was used as reference. Such preva-lence decreased by 6.1% when using RPI indicator and by 15.4% when using BMI.
lower the number of subjects classified as sick, when they are truly not (false-positive cases).
Statistical analysis
Data were analyzed using the Shapiro-Wilk test to check for normality. Descriptive procedures were applied (mean, standard deviation, minimum and maximum values) and data frequency. Pearson correlation and the Kappa index were used to identify the association between BMI and RPI scores with DEXA. The ROC (Receiver Operator Characteristic) curve analysis was used, allow-ing for comparison of areas under the curve, in overweight identi-fication in relation to criterion measurement(28), using a confidence
interval of 95%. The analyses were performed in the SPSS® statis-tical package forWindows (version 11.0).
RESULTS
Table 1 presents the mean and standard deviation for age, body mass, stature, %BF, BMI and RPI, as well as the range of values in order characterize the sample.
TABLE 1
Descriptive values for women between 50 and 77 years of age
Variables (n = 65) Mean ± sd Minimum Maximum
Age (years) 062.4 ± 07.3 0500, 077,0
Body mass (kg) 070.3 ± 110, 050.4 097.5 Stature (cm) 158.3 ± 05.5 1440, 1720,
%BF (DEXA) 038.1 ± 06.0 023.6 052.1 BMI (kg.m-2) 028.0 ± 04.2 021.3 038.6
RPI (cm.kg-1/3) 038.0 ± 01.9 0340, 0420,
Where: sd: standard deviation. %BF: percent of body fat. BMI: Body mass index. RPI: Reciprocal of Ponderal Index.
TABLE 2
%BFDEXA, BMI and RPI of women between 50 and 77 years of age
Ages group (years) %BFDEXA BMI RPI
50-55 40.3 ± 5.1 31.2 ± 3.5 36.0 ± 4.0 56-60 35,0 ± 6.9 27.1 ± 4.6 38.1 ± 4.2 61-65 40.3 ± 4.5 29,0 ± 4.4 37.6 ± 5.2 66-70 39.9 ± 4.2 30.2 ± 3.3 37.4 ± 6.4 71-77 37.4 ± 6.6 27.1 ± 3.8 34.0 ± 3.4
TABLE 3
Prevalence of fat excess in women between 50 and 77 years of age
Classification (n = 65) Normal Fat excess
%BFDEXA 10.8% 0(7) 89.2% (58)
BMI 26.2% (17) 73.8% (48) RPI 16.9% (11) 83.1% (54)
Fat excess using cutoff points for the indicators: %BF > 30%; BMI > 27 kg.m-2 and RPI values <
41cm.kg-1/3.
Sensitivity and specificity of BMI and RPI were tested with %BFDEXA scores (table 4). It can be observed that for false-negative cases, RPI was more precise in identifying individuals with fat ex-cess, but classified as not obese by the BMI criterion.
TABLE 4
Sensitivity and specificity of BMI and RPI in women between 50 and 77 years of age
Comparison Sensibility Specificity False False
(n = 65) Negative Positive
BMI vs %BFDEXA 79.3% 71.4% 20.6% (12) 28.6% (2)
RPI vs %BFDEXA 90%,0 71.4% 10.3% 0(6) 28.6% (2)
The results show that specificity values for BMI and RPI indica-tors were similar in the verification of fat-mass excess (71.4%) and in the classification of false-negative cases (28.6%).
Table 5 presents the Pearson correlation coefficients and the Kappa index between fat excess indicators. It may be observed that DEXA correlations with BMI and RPI were statistically signifi-cant (p < 0.01).
TABLE 5
Pearson linear correlation coefficients among %BFDEXA, BMI and RPI
Variables %BFDEXA
r* k*
BMI (kg.m-2) –0.72 0.31
RPI (cm.kg-1/3) –0.76 0.48
* significant p < 0.005. Figure 1 – Analytical model for sensitivity and specificity of
anthropomet-ric indicators of fat-mass excess in relation to percent of body fat estimat-ed by dual-energy x-ray absorptiometry. Where: sensitivity (%) = A/(A+C)x 100 and specificity (%) = D(/B+D)x100.
The BMI and RPI mean values were classified as fat excess(1,10,17),
what was already expected, since fat mass increases with age(30).
Concerning the percent of body fat (%BFDEXA), the mean was 38,1 ± 6% (23,6%-52,1%), which was also classified as fat excess(18).
Table 2 shows the mean values and standard deviation for the anthropometric indicators by age. No significant differences were observed among age groups (p > 0,05).
The correlation between DEXA and BMI was 0.72 (p < 0.01), suggesting a strong positive association, that is, when fat-mass values increase, BMI values increase as well. The correlation be-tween DEXA values and RPI was also statistically significant (p < 0.01), which reveals a strong association between these indica-tors. However, differently from BMI, this indicator presented a negative association (r = - 0.76), i.e., an inverse relationship.
The Kappa index was used to analyze the association between anthropometric indicators and DEXA (table 5). Values of 0.31 for BMI and 0.48 for RPI were observed. These values are considered moderate for the analyses of categorical variables.
The results corroborate with other investigations that found 30% of false-positive cases in adult women(32). They are also similar to
results reported by Smalley et al.(9), relating six fat excess
indica-tors with %BF obtained by hydrostatic weighting. The authors iden-tified that 44.6% of the women in the sample were false-negative cases and 1.8% false-positive using BMI in comparison to hydro-static weighting.
Hortobágyi et al.(24), evaluating 365 women between 14-45 years
of age, found 26.9% of sensitivity and 98.2% of specificity, with 9.3% of false-positive cases and 32.9% of false-negative cases. Data in that study differ from those in this study. The reason for such difference may lie in the definition of cutoff points to deter-mine fat-mass excess.
Although BMI presented an agreement between the sensitivity values with RPI diagnosis, it was lower when identifying false-neg-ative cases (specificity).
Such evidence is confirmed by the agreement index (Kappa) for both indicators, in which the indexes are considered moderate, regardless Pearson correlation coefficients being significant, which is supported by other studies in the area(32,33,35).
RPI presented a correlation coefficient of –0.76 with %BFDEXA (table 5), value lower than that reported by Smalley et al.(9) (r = –
0.86) and a correlation of 0.84 with BMI. In a study conducted with post-menopause women, the correlation values found were 0.83 between BMI and relative fat measured by DEXA(34,35).
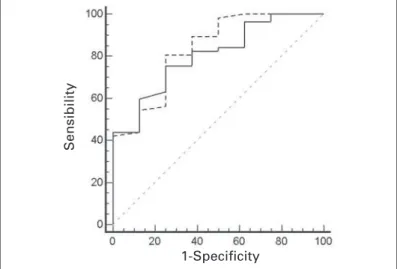
Regarding the analysis of the ROC curve, the comparison be-tween curves (figure 1) did not show significant difference for the two fat excess indicators. Although the cutoff points for diagnosis of fat excess were BMI > 27 kg.m-2 and RPI < 41 cm.kg-1/3, they did
not differ in relation to criterion measurement, an adjustment for the cutoff points of > 26.2 kg.m-2 for BMI and of < 39.3 cm.kg-1/3
for RPI, produced a better diagnosis for fat excess.
Therefore, the use of these cutoff points allowed sensitivity and specificity of 75.4% and 75%, respectively, for BMI. In other words, concerning the cutoff point adopted in this study, there would be an increase in the diagnosis of the false-positive cases. BMI sensi-tivity would be reduced in 3.9%, while the specificity would be 3.6% higher. On the other hand, RPI would have a loss of 4.3% in sensitivity and an increase of 3.6% for specificity.
The decrease of BMI relationship with fat excess diagnosis has already been reported in other studies, showing that the estab-lished cutoff points must be cautiously observed in specific groups(23,34,35). An investigation involving 317 post-menopause
wom-en demonstrated that the cutoff point of 24.9 kg.m-2 for BMI was
the best fat excess discriminator(35). These data corroborate with
those presented by Wellens et al.(34), who observed that the cutoff
point of 23 kg.m-2 would present a better balance between
sensi-tivity and specificity in women. Sardinha and Teixeira(23), in a study
with elder women, concluded that the cutoff point of 25.5 kg.m-2
was the best discriminator point of fat excess in that population, agreeing with the data found in this study, in which BMI presented a cutoff point of 26.2 kg.m-2.
The differences found in the cutoff points in various studies are related to the criterion measurement used and to the cutoff point established for identification of fat excess in elders. Some authors have used values between 30-38% of body fat as a cutoff point.
Nevertheless, in all studies where BMI is suggested as the best fat excess discriminators, the values have been smaller than those recommended by WHO(1) (BMI > 30kg.m-2) for this diagnosis(23,34,35).
Hence, the standard cutoff point (%BF = 30%) can explain the reason for higher values established by the ROC curve in compar-ison to other studies, since the criterion of fat excess adopted in studies with older groups uses higher values of %BF, which re-duce the values of anthropometric indicators to keep a suitable sensitivity value for that indicator.
This fact represents that to better identify true obese cases, the BMI cutoff point of > 26.2 kg.m-2 establishes a better relationship
The cutoff point value of 26.2 kg.m-2 presented the most adequate
balance between sensitivity (75.4%) and specificity (75%). The RPI presented an area under the curve of 0.83 (0.72-0.91), the cutoff point identified at 39.3 cm.kg-1/3 demonstrated sensitivity of 85.7%
and specificity of 75%.
The comparison between the areas under the ROC curve, showed no significant difference (p = 0.637). There was a differ-ence of 0.03 between the curves (CI = –0.09-0.15; 95%).
DISCUSSION
The concern to establish sensitivity and specificity of anthropo-metric indicators of fat-excess is justified by the constant alter-ations in body composition of middle-aged and elder population(30,31).
Thus, the relationship between weight gain and fat accumulation differs from that observed in young adults.
The aging process causes decrease in the ability to predict the amount of fat-mass by anthropometric indicators. In this study, the BMI and RPI explained 52% (R2 = 0.523) and 59% (R2 = 0.595),
respectively, of the %BF variance. Such values are smaller than those observed in young adults, which present a higher relation-ship(9,32,33).
This decrease of the ability of prediction is reflected in the rec-ommended cutoff points for identifying fat excess in middle-aged and elder adults. In other words, the adoption of generalized cutoff points for fat excess in specific groups, as analyzed in this study, can present distortions(23,34,35).
The different prevalence of fat excess can be observed in table 3. The sample presented 89.2% of fat excess by DEXA, however, the prevalence was reduced to 73.8% when the BMI scores were used and it was closer to DEXA (83.1%) when using RPI.
RPI presented a prevalence closer to that found by %BFDEXA measurement, being more sensitive in the identification of false-negative cases (table 4).
The false-negative cases are those who need more attention when groups with older individuals are analyzed, since fat-mass accumulation and distribution differ across ages(30,31). Although the
results of this study did not present a significant increase in
%BF-DEXA with age, some studies have demonstrated increase in fat
ex-cess indicators and obesity(23,35) in older ages.
Concerning specificity analyses, the two anthropometric indica-tors (BMI and RPI) presented the same results (71.4%) in relation to fat excess diagnosis. However, BMI presented 20.6% of false-negative cases (12 cases), while two false-positive cases were iden-tified (table 4).
Figure 2 – Comparison of diagnosis of two anthropometric (BMI e RPI) indicators in the identification of overweight using the ROC curve (Receiv-er Op(Receiv-erator Charact(Receiv-eristic curve).
1-Specificity
with the criterion measurement, however, this value may present a variation if another cutoff point is adopted for fat measurement, which in this study was %BF > 30%. In relation to RPI, it had the cutoff point adjusted to adequate false-positive and false-negative cases.
In any case, such differences did not produce statistically con-siderable changes in fat excess diagnosis in the sample. This situ-ation may be related to the use of established cutoff points, and the reduced sample size which was not adjusted in the “normal” and “fat excess” groups, contributing to interferences explained here. Therefore, new studies with different cutoff points and with a random sample to identify cutoff points that have a relationship with health risks in elder population are needed.
Another important factor is to determine, in a relational manner with health problems, a cutoff point for the determination of fat excess in older people, so that the comparisons could be performed.
CONCLUSIONS
The use of anthropometric indicators (BMI and RPI) presents as main characteristics the easiness of data collection and simplicity in the interpretation of results, which may contribute to control the obesity cases. The practical application of these indicators reflects on the premises that they present a direct relationship with inci-dence of many chronic and degenerative diseases.
Based on the results, it can be stated, considering the limita-tions of the use of %BFDEXA as a reference standard method, that women in this study present high prevalence of fat-mass excess, independently of the anthropometric indicator used.
BMI and RPI indicators showed high values of sensitivity. None-theless, RPI appeared to be more sensitive than BMI to evaluate the fat-mass excess in women over 50 years of age, when adopt-ing 30% of body fat as reference criterion, to diagnose fat excess. The area under the ROC curve did not demonstrate significant difference between BMI and RPI indicators for diagnosis of fat excess. The cutoff points of 26.2 kg.m-2 and 39.3 cm.kg-1/3 for BMI
and RPI, respectively, presented the best relationship between sensitivity and specificity for the diagnosis of fat-mass excess in this sample of elderly women.
ACKNOWLEDGMENTS
The authors thank the support of the Instituto de Densitometria Óssea de Santa Maria (OSTEOLAB), Santa Maria, RS.
All the authors declared there is not any potential conflict of inter-ests regarding this article.
REFERENCES
1. WHO, Word Heath Organization. Obesity status: preventing and managing the global epidemic. Report of a WHO consultation on obesity. Geneva, 1998. 2. Acuña K, Cruz T. Avaliação do estado nutricional de adultos e idosos e situação
nutricional da população brasileira. Arq Bras Endocrinol Metab 2004;48:345-61. 3. James P. Overweight and obesity worldwide now estimated to involve 1.7
bil-lion people. Obes Surg 2003;13:329-30.
4. Flegal KM, Carroll MD, Ogden CL, Johnson CL. Prevalence and trends in obesity among US adults, 1999-2000. J A M A 2002;288:1723-7.
5. Mokdad AH, Ford ES, Bowman BA, Dietz WH, Vinicor F, Bales VS, Marks JS. Prevalence of obesity, diabetes, and obesity-related health risk factors – 2001. JAMA 2003;289:76-9.
6. Mokdad AH, Bowman BA, Ford ES, Vinicor F, Marks JS, Koplan JP. The continu-ing epidemics of obesity and diabetes in the United States. JAMA 2001;286:1195-200.
7. Coutinho DC, Leão MM, Recine E, Sichieri R. Condições nutricionais da popula-ção brasileira: adultos e idosos. Pesquisa nacional sobre saúde e nutripopula-ção. Brasí-lia: INAN, Instituto Nacional de Alimentação e Nutrição, 1991.
8. Bigaard J, Frederiksen k, Tjonneland A, Thomsen BL, Overvad K, Heitmann BL, et al. Body fat and fat-free mass and all-cause mortality. Obes Res 2004;12:1042-9.
9. Smalley KL, Knerr AN, Nerr AN, Kendrick ZV, Colliver JA, Owen OE. Reassess-ment of body mass indices. Am J Clin Nutr 1990;52:953-9.
10. WHO, World Health Organization. Physical status: the use and interpretation of anthropometry. Geneva, 1995.
11. Troiano RP, Frogillo JEA, Sobal J, Levitsky DA. The relationship between body weight and mortality: a quantitative analysis of combined information from ex-isting studies. Int J Obes Relat Metab Disord 1996;20:63-75.
12. Kubena KS, McIntosh WA, Georghiades MB, Landmann WA. Anthropometric and health in the elderly. J Am Diet Assoc 1991;91:1402-7.
13. Kaye SA, Folson AR, Sprafka JM, Prineas RJ, Wallace RB. Increased incidence of diabetes mellitus in relation to abdominal adiposity in older women. J Clin Epidemiol 1991;44:329-34.
14. Rapp K, Schroeder J, Klenk J, Stoehr S, Ulmer H, Concin H, et al. Obesity and incidence of cancer: a large cohort study of over 145 000 adults in Austria. Br J Cancer 2005;93:1062-7.
15. Malina RM, Katzmarz PT. Validity of the body mass index as an indicator of the risk and presence of overweight in adolescents. Am J Clin Nutr 1999;70:131-6. 16. Anjos LA. Índice de massa corporal (massa corporal.estatura-2) como indicador
do estado nutricional de adultos: revisão de literatura. Rev Saúde Públ 1992;26: 203-15.
17. Ricardo DR, Araújo CGS. Body mass index: a scientific evidence-based inquiry. Arq Bras Cardiol 2002;79:70-8.
18. Lohman TG. Advances in body composition assessment. Champaign, Illinois: Human Kinetics Publishers, 1992.
19. Jackson AS, Poolock ML, Ward A. Generalized equations for prediction of body density of women. Med Sci Sports Exerc 1980;12:175-82.
20. Brodowicz GR, Mansfield RA, McClung MR, Althoff SA. Measurement of body composition in elderly: dual energy X-ray absorptiometry, underwater weighing, bielectrical impedance analysis, and anthropometric. Geront 1994;40:332-9. 21. Clasey JL, Kanaley JA, Wideman L, Heymsfield CD, Teates ME, Gutgesell ME,
et al. Validity of methods of body composition assessment in young and older men and women. J Appl Physiol 1999;86:1728-38.
22. Kohrt VM. Preliminary evidence that DEXA provides accurate assessment of body composition. J Appl Physiol 1998;84:372-7.
23. Sardinha LB, Teixeira PJ. Obesity screening in older women with the body mass index: a receiver operating characteristic analysis. Sci Sports 2000;15:212-9. 24. Hortobágyi T, Israel RG, O’Brien KF. Sensitivity and specificity index to assess
obesity in men and women. Eur J Clin Nutr 1994;48:369-75.
25. Thomas JR, Nelson JK. Métodos de pesquisa em atividade física. Porto Alegre: Artmed, 2002.
26. Alvarez BR, Pavan AL. Alturas e comprimentos. In: Petroski EL, org. Antropo-metria: técnicas e padronizações. Porto Alegre: Palotti, 2003.
27. Lipschitz DA. Screening for nutritional status in the elderly. Prim Care 1994;21(1): 55-67.
28. Fletcher RH, Fletcher SW, Wagner EH. Epidemiologia clínica: elementos essen-ciais. 3ª ed. Porto Alegre: Artes Médicas, 1986.
29. Micozzi MS, Harris TM. Age variations in the relation of body mass indices to estimates of body fat and muscle mass. Am J Phys Anthropol 1990;81:375-9. 30. Shephard RJ. Exercise and ageing process. Rev Bras Med Esporte
1991;5:49-56.
31. Poehlman ET. Nível de atividade física e controle de peso em idosos. In: Bou-chard C. Atividade física e obesidade. São Paulo: Manole, 2003.
32. Damasceno VO, Dutra LN, Ribeiro LG, Vianna VRA, Novaes JS, Lima JRP. Índice de massa corporal e recíproco do índice ponderal na identificação de sobrepeso e obesidade. Rev Bras Cine Des Hum 2003;5:44-53.
33. Amorim PRS, Silva SC, Fernandes Filho J. Sensibilidade e especificidade do índice de massa corpórea na determinação da obesidade. Fitness & Performance Journal 2004;3:71-5.
34. Wellens RI, Roche AF, Khamis HJ, Jackson AS, Pollock ML, Siervogel RM. Rela-tionship between the body mass index and body composition. Obes Res 1996; 4:35-44.