Submitted on: 9/12/2009 Accepted on: 12/8/2009
Corresponding author: Rosana dos Santos e Silva Martin
Departamento de Clínica Mé-dica - Faculdade de Medicina de Botucatu - Rubião Júnior s/n Botucatu-São Paulo CEP: 18 618-970; Phone: 55 (14) 3811 6213 Fax: 55 (14) 3811 6213 E-mail: rmartin@fmb. unesp.br
We declare no confl ict of interest.
Authors
Rosana dos Santos e Silva Martin
Roberto Jorge da Silva Franco Beatriz Bojikian Matsubara
Silméia Garcia Zanati Pasqual Barretti Luis Cuadrado Martin André Luis Balbi Aline Araújo Antunes Antônio Sérgio Martins
Departamento de Clínica Médica, Faculdade de Medicina de Botucatu – UNESP
A
BSTRACTIntroduction: Chronic renal disease is asso-ciated with a high cardiovascular risk. Data from the general population associate cardi-ovascular diseases with low educational lev-el, but no study has evaluated this associa-tion in patients on hemodialysis. Objective: This study aimed at evaluating the associa-tion between educaassocia-tional level, hyperten-sion, and left ventricular hypertrophy in patients on chronic hemodialysis. Methods: A standard socioeconomic questionnaire was applied to 79 hemodialysis patients at the Hospital das Clínicas of Faculdade de Medicina de Botucatu, state of São Paulo. Clinical, laboratory and echocardiographic data were obtained from medical records. The patients were divided into two groups according to the median educational level, as follows: G1, patients with three or less years of schooling; G2, patients with more than three years of schooling. Results: Blood pressure, interdialytic weight gain, and vari-ables statistically different in the two groups (p < 0.2) underwent multiple analysis. Inde-pendent associations were stated with p < 0.05 in multiple analysis. The mean age of patients was 57 ± 12.8 years, 46 were males (57%), and 53 white (67%). The variables selected for multiple analysis were: age (p = 0.004); educational level (p < 0.0001); body mass index (p = 0.124); left ventricu-lar diameter (p = 0.048); and left ventricuventricu-lar mass index (p = 0.006). Antihypertensive drugs were similar in both groups. Systo-lic blood pressure (p = 0.006) and years of schooling (p = 0.047) had a significant and independent correlation with left ventricu-lar mass index. Conclusion: In hemodialysis patients, left ventricular mass associated not only with blood pressure but also with edu-cational level.
Infl uence of educational level on myocardial
hypertrophy of hemodialysis patients
Keywords: educational level, left ventricu-lar hypertrophy, uremia, dialysis, hyper-tension.
[J Bras Nefrol 2010;32(1):69-74]©Elsevier Editora Ltda.
I
NTRODUCTIONIn the general population, low educa-tional level associates with high car-diovascular morbidity and mortality.1
Hypertension2,3, diabetes4, obesity5,
smoking6, dyslipidemia7, and renal
fai-lure8, the latter being currently
recogni-zed as a cardiovascular risk factor9, are
more common among individuals with low educational level. Renal disease re-duces life expectancy, and cardiovascu-lar disease is the major cause of death among such patients.10-12 Patients with
chronic kidney disease and a low educa-tional level have their life expectancy re-duced even more as compared with tho-se with a higher educational level.13-15
Left ventricular hypertrophy (LVH) is a good prognostic marker of cardio-vascular disease in the general popu-lation16, and, in renal failure, it
identi-fies a subgroup of patients at very high cardiovascular risk.11 Hypertension is
the main etiopathogenic factor for the development of LVH in both the gene-ral population17 and patients with renal
failure.11 In addition, hypertension is
more frequent and more intense among unemployed individuals and even wor-se among unemployed individuals wi-th a low educational level.2,3,18 A large
epidemiological study has associated LVH with low educational level in the general population.19 No previous
and echocardiographic data (diastolic left ventricular diameter, interventricular septum and posterior wall thicknesses). Echocardiography was performed accor-ding to the American Echocardiography Association Standards20,21, and left ventricular mass (LVM) was
calculated by using the Devereux formula. Left ven-tricular mass index (LVMI) was obtained by dividing LVM by height to the power of 2.7. 17
The following laboratory data were assessed: calcium; phosphorus; potassium; urea; creatinine; glucose; hemoglobin; hematocrit; parathyroid hor-mone; fractional urea clearance (Kt/V); cholesterol; triglycerides; bicarbonate; albumin; and ferritin. All laboratory data were obtained immediately before the midweek dialysis session.
Continuous variables were compared by use of the Student t test or Mann-Whitney test, when ap-propriate. Categorical variables were compared by use of the Chi-square test or Fisher exact test. Blood pressure, interdialytic weight gain, and variables di-ffering between the groups at the significance level of 0.20 were included in the step-up multiple regression model using LVMI as dependent variable. When the p value was lower than 0.05, the association was con-sidered statistically significant in multiple analysis. Parametric data were expressed as mean ± standard deviation and nonparametric data were expressed as median (first and third quartiles).
R
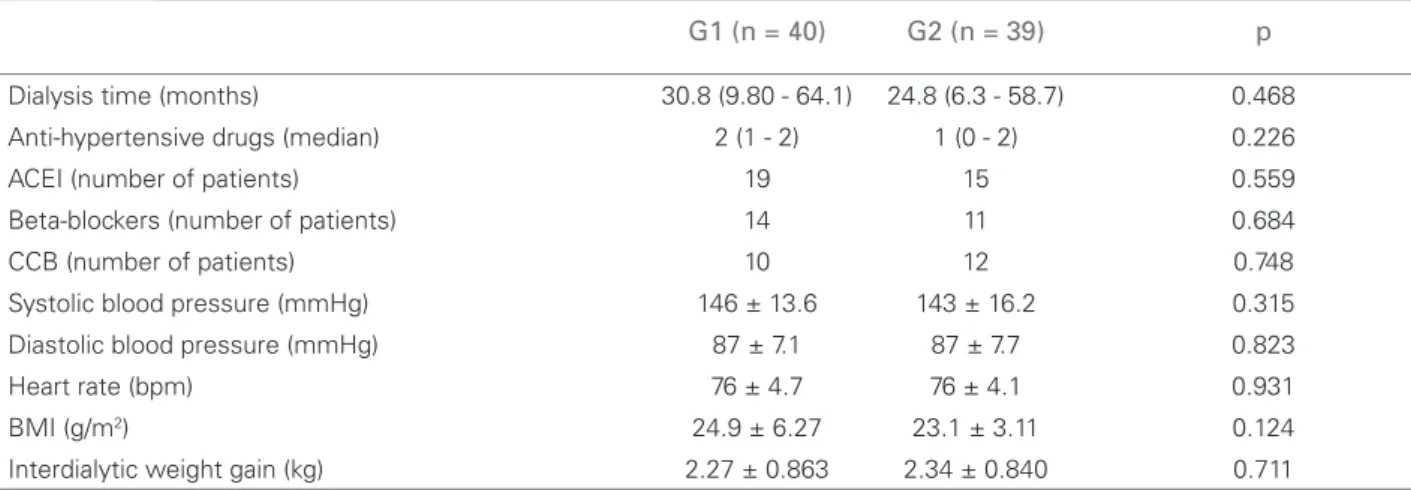
ESULTSThe mean age of the case series was 57 ± 12.8 ye-ars, 46 were men (57%), and 53 were white (67%). The etiology of renal failure was hypertension in 27 patients, diabetes in 20, glomerulopathies in 16, and other causes in 16 patients. The groups did not differ in regard to the renal failure etiology. Table 1 shows the demographic data and Table 2 shows the clinical data. The number of classes of antihypertensive drugs used did not differ between the groups. The medica-tions with specific potential for decreasing LVH, such as beta-blockers, calcium-channel blockers, angioten-sin II receptor antagonists, and angiotenangioten-sin conver-ting enzyme inhibitors, did not differ either (Table 2). Blood pressure and other clinical variables did not di-ffer between groups. The p value for body mass index (BMI) was 0.124.
The echocardiographic data in G1 and G2, res-pectively, were as follows: posterior wall thickness, 12.0 ± 2.05 mm and 12.2 ± 2.57 mm (p = 0.695); in-terventricular septum thickness, 12.3 ± 2.21 mm and 12.5 ± 2.52 mm (p = 0.835); LVM, 300 ± 96.7 g and chronic kidney disease patients. Thus, this study
aimed at assessing the influence of low educatio-nal level on blood pressure and on LVH degree in patients on hemodialysis.
M
ETHODSThe present study was carried out at the Medical School of Botucatu, UNESP, from April to June 2005. The study comprised patients on hemodialysis, aged over 18 years. Patients with intellectual difficulties to answer the questionnaire, with valvulopathies, ven-tricular dyskinesia, or poor-quality echocardiogram were excluded from the study. The study abided by re-solution 196/96 and was approved by the Committee on Ethics of the Medical School of Botucatu (protocol 1757/05).
The sample size (α error of 0.05 and β error of 0.20) was calculated and resulted in 35 patients in each group for detecting a difference of 15 g/m2,7 with
standard deviation of 22 g/m2,7 in ventricular mass
index, and 37 patients for detecting a difference of 10 mm Hg with standard deviation of 15 mm Hg in systolic pressure.
The study assessed 109 patients, 13 of whom were excluded. Of the remaining 96 patients, six died, six underwent transplantation, three moved to another city, one changed the dialysis method, and one recove-red renal function before the first echocardiographic assessment. Therefore, 79 patients were analyzed. The median educational level was three years of scho-oling. The patients were divided into the following two groups according to the median educational le-vel: G1 (40 patients with three or less years of schoo-ling); and G2 (39 patients with more than three years of schooling). The educational level of the patients excluded did not differ statistically from that of the patients included: median, first and third quartiles of 3.5 (1.5-7) versus 3 (1-4) for patients excluded and included, respectively; p=0.26.
A standard questionnaire containing the following data was applied: age; sex; ethnic group; educational level in years of schooling; dialysis time; monthly fa-mily income; number of people in the household; and “employed” or “unemployed” status.
273 ± 100.1 g (p = 0.240). The groups differed regar-ding diastolic left ventricular diameter and LVMI (Figure 1).
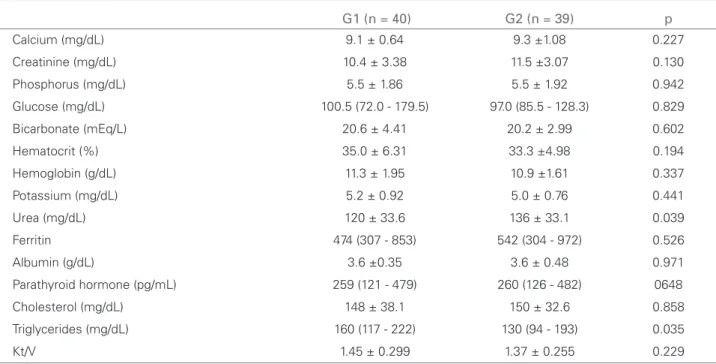
Most laboratory data were similar in both groups (Table 3), except for urea and triglycerides. The p va-lue for creatinine was 0.130.
Table 4 shows the step-up multiple regression analysis, and the following variables showed no statistically significant correlation with LVMI: age; BMI; interdialytic weight gain; creatinine; urea; and triglycerides. However, a significant and indepen-dent association of LVMI was observed with educa-tional level in years of schooling and systolic blood pressure.
To better assess the relation between age, educa-tional level, and LVMI, G1 was stratified in regard to age; patients aged 60 years or over were excluded. The mean age of that subgroup, consisting of the 18
youngest patients with lower educational level, was 51 ± 7.6 years, and was comparable to the mean age of G2 (52 ± 12.7 years) (p=0.711). That subgroup continued to differ in regard to LVMI, 97 ± 34.5 g/ m2,7 as compared with the LVMI of G2, 73 ± 24.2 g/
m2,7 (p=0.003).
D
ISCUSSIONThis study aimed at assessing the association betwe-en educational level and severity of LVH and AH of patients on hemodialysis. In G1, LVH was more in-tense as compared with that of G2. Associations of low educational level with ventricular hypertrophy and blood pressure were assessed by use of multiple regression analysis. Surprisingly, neither systolic nor diastolic blood pressure associated with low edu-cational level. Our results suggest that ventricular hypertrophy is more intense among patients with low
Table 1 DEMOGRAPHICVARIABLESOFPATIENTSONHEMODIALYSISACCORDINGTOTHEIREDUCATIONALLEVEL
G1 (n = 40) G2 (n = 39) p
Age (years) 61 ± 11.6 52 ± 12.7 0.010
Female/Male 20/20 15/24 0.316
White/Non white 27/13 25/14 0.370
Years of schooling 1.0 (0.0-2.5) 4.0 (4.0-8.0) < 0.001
Monthly income (R$) 730 (260 - 1525) 900 (633 - 1220) 0.522
People in the household (n) 3.5 (2.0 - 5.0) 3.0 (2.0 - 4.0) 0.533
Employed/unemployed 1/39 4/35 0.201
G1, educational level ≤ 3 years of schooling; G2, educational level > 3 years of schooling.
Table 2 CLINICALVARIABLESOFPATIENTSONHEMODIALYSISACCORDINGTOEDUCATIONALLEVEL
G1 (n = 40) G2 (n = 39) p
Dialysis time (months) 30.8 (9.80 - 64.1) 24.8 (6.3 - 58.7) 0.468
Anti-hypertensive drugs (median) 2 (1 - 2) 1 (0 - 2) 0.226
ACEI (number of patients) 19 15 0.559
Beta-blockers (number of patients) 14 11 0.684
CCB (number of patients) 10 12 0.748
Systolic blood pressure (mmHg) 146 ± 13.6 143 ± 16.2 0.315 Diastolic blood pressure (mmHg) 87 ± 7.1 87 ± 7.7 0.823
Heart rate (bpm) 76 ± 4.7 76 ± 4.1 0.931
BMI (g/m2) 24.9 ± 6.27 23.1 ± 3.11 0.124
Interdialytic weight gain (kg) 2.27 ± 0.863 2.34 ± 0.840 0.711
G1 = educational level ≤ 3 years of schooling; G2 = educational level > 3 years of schooling;
educational levels. It is worth noting that the median educational level of our patients on hemodialysis was half of that of the general Brazilian population, which is in accordance with data referring to patients with chronic kidney disease of another country.9
It is worth noting that the groups were divided according to their educational level as follows: G1 – educational level equal to or lower than three years of schooling [those who, before the 1971 National Educational Guidelines and Bases Law (Law 5692 of August 11, 1971, that was in effect until the pro-mulgation of the most recent National Educational Guidelines and Bases Law), did not have the then Table 3 LABORATORYVARIABLESOFPATIENTSONHEMODIALYSISACCORDINGTOTHEEDUCATIONALLEVEL.
G1 (n = 40) G2 (n = 39) p
Calcium (mg/dL) 9.1 ± 0.64 9.3 ±1.08 0.227
Creatinine (mg/dL) 10.4 ± 3.38 11.5 ±3.07 0.130
Phosphorus (mg/dL) 5.5 ± 1.86 5.5 ± 1.92 0.942
Glucose (mg/dL) 100.5 (72.0 - 179.5) 97.0 (85.5 - 128.3) 0.829
Bicarbonate (mEq/L) 20.6 ± 4.41 20.2 ± 2.99 0.602
Hematocrit (%) 35.0 ± 6.31 33.3 ±4.98 0.194
Hemoglobin (g/dL) 11.3 ± 1.95 10.9 ±1.61 0.337
Potassium (mg/dL) 5.2 ± 0.92 5.0 ± 0.76 0.441
Urea (mg/dL) 120 ± 33.6 136 ± 33.1 0.039
Ferritin 474 (307 - 853) 542 (304 - 972) 0.526
Albumin (g/dL) 3.6 ±0.35 3.6 ± 0.48 0.971
Parathyroid hormone (pg/mL) 259 (121 - 479) 260 (126 - 482) 0648
Cholesterol (mg/dL) 148 ± 38.1 150 ± 32.6 0.858
Triglycerides (mg/dL) 160 (117 - 222) 130 (94 - 193) 0.035
Kt/V 1.45 ± 0.299 1.37 ± 0.255 0.229
G1 = educational level ≤ 3 years of schooling; G2 = educational level > 3 years of schooling; Kt/V = fractional urea clearance.
Figure 1. D A: left ventricular diameter (LVD) related to the educational level; B: left ventricular mass index (LVMI) related to the educational level. Group 1: educational level ≤ 3 years of schooling; Group 2: educational level > 3 years of schooling.
Table 4 STEP-UPLOGISTICREGRESSIONBETWEENDEMOGRAPHIC, CLINICALANDLABORATORYVARIABLESANDLEFTVENTRICULAR
MASSINDEXOFPATIENTSONHEMODIALYSIS
B SE B Confi dence Interval p
Years of schooling -1.786 0.891 -3.56 to -0.012 0.048
Systolic blood pressure 0.560 0.201 0.157 to 0.963 0.007
Interdialytic weight gain - - - 0.735
Age - - - 0.713
Hematocrit - - - 0.256
Triglycerides - - - 0.266
BMI - - - 0.980
Urea - - - 0.959
Creatinine - - - 0.959
B = slope of the regression line; SE B = standard error of the slope of the regression line; BMI = body mass index. LVD (mm)
80
60
40
20
180
150
120
90
60
30
0
LVMI (g/m2.7)
P=0.048
Group 2
(n=39) Group 2(n=39) Group 1
(n=40) Group 1(n=40) 51.0±6.30 87±29.4
73±24.2 48.7±8.30
called complete elementary education]; G2 – edu-cational level equal to or higher than three years of schooling, corresponding to the old complete ele-mentary education. Considering the age of our case series, almost all patients attended elementary scho-ol before the promulgation of that 1971 law. Thus, the division was performed between those who did not have completed old elementary school and those who had at least completed elementary school. It is worth emphasizing that at that time there was a “rite of passage”, which was an admission test to middle school. Therefore, it is worth noting that the median educational level coincides with a very important re-ference for people within the age group studied, that is, the passage from old elementary school to old mi-ddle school.
Considering that blood pressure did not associa-te with educational level, that is, patients of a lower or higher educational level did not differ in regard to blood pressure, the correlation coefficients of the re-gression model that considered blood pressure a de-pendent variable were not shown in the results. On the other hand, considering that blood pressure and LVMI had a close relation, blood pressure needed to be included as an independent variable in the multi-ple model, in which LVMI was a dependent variable. Even so, the low educational level had an additional effect to blood pressure elevation on the degree of car-diac hypertrophy.
It should be considered that the patients in G1 we-re older at the time of analysis. However, it is wor-th noting wor-that multiple analysis was performed, and, still, educational level appeared as a factor associated with LVMI, independently of age. Thus, educational level had an additional effect to age, that is, when as-sessing patients of the same age and different educa-tional level, LVMI statistically differed between both groups. To illustrate that statement, G1 was stratified and, when excluding the patients aged 60 years or above and constituting subgroups with similar ages, the educational level maintained an association with LVMI independently of age.
To explain the association between low educa-tional level and blood pressure, a Brazilian study22
has correlated the low socioeconomic level with salt ingestion, which could measure the association be-tween low socioeconomic level and arterial hyperten-sion. Hypervolemia is a common condition among patients with end-stage chronic kidney disease.23 A
previous study has demonstrated the existence of an independent correlation between hypervolemia and left ventricular mass in patients on hemodialysis.24
In the present study, the higher ventricular diameter in patients with lower educational level corrobora-tes the assumption that volume overload could ex-plain the greater ventricular mass in those patients. However, the interdialytic weight gain was equal in both groups. Thus, volume overload cannot explain the results of the present study. An epidemiological study in the general population has shown the effect of low educational level on LVH. In Afro-Americans, the association between low educational level and LVH was independent of other cofactors, including hypertension19, and this was attributed to psicossocial
stress, which is more intense among those with lower educational levels.
There is evidence that low educational level has a strong negative impact on the prognosis of patients on hemodialysis.13-15 In addition, cardiovascular
di-seases are the major causes of death among those patients, and LVH is a strong prognosis marker. 10-12. Therefore, the correlation between educational
level and ventricular hypertrophy could explain the higher mortality in patients with chronic kidney fai-lure and lower educational level. However, no pre-vious study has associated indicators of socioecono-mic level with cardiovascular risk factors of patients on hemodialysis.
C
ONCLUSIONTo our knowledge, this is the first study associating LVH and low educational level in end-stage chronic kidney disease patients.
R
EFERENCES1. Melchior M, Berkman LF, Kawachi I et al. Lifelong socioeconomic trajectory and premature mortality (35-65 years) in France: findings from the GAZEL Cohort
Study.J Epidemiol Community Health. 2006; 60:937-44.
2. Fuchs FD, Moreira LB, Moraes RS, Bredemeier M, Cardozo SC. Prevalência da hipertensão arterial sistê-mica e fatores associados na região urbana de Porto Alegre. Estudo de base populacional. Arq Bras Cardiol. 1995; 63:473-9.
3. Tedesco MA, DiGalvo G, Caputo S, Natale F, Ratti G, Iarussi IA. Educational level and hypertension: how so-cioeconomic differences condition health care. J Hum Hypertens. 2001; 5:727-31.
4. Unwin N, Binns D, Elliott K, Kelly WF. The rela-tionships between cardiovascular risk factors and socio-economic status in people with diabetes. Diabet Med.1996; 13:72-9.
6. GordonT, Kannel WB. Drinking and its relation to smoking, blood pressure, blood lipids and uric acid. Arch Intern Med. 1983; 143:1366-74.
7. Panagiotakos DB, Pitsavos C, Manios Y, Polychronopoulos E, Chrysohoou CA, Stefanadis C. Socio-economic status in relation to risk factors asso-ciated with cardiovascular disease, in healthy individu-als from the ATTICA study. Europ J Cardiovasc Prev Rehabil. 2005; 12:68-74.
8. Fored CM, Ejerblade E, Fryzed JP, Lambe M, Lindblad, Elinder ONC. Socio-economic status and chronic re-nal failure: a population-based case-control study in Sweden. Nephrol Dial Transplant. 2003; 18:82-8. 9. Martin LC, Franco RJS. Renal disease as a
cardiovascu-lar risk factor. Arq Bras Cardiol. 2005; 85:432-6. 10. Eknoyan G. On the epidemic of cardiovascular disease
in patients with chronic renal disease and progressive renal failure: A first step to improve the outcomes. Am J Kidney Dis. 1998; 32:1-4.
11. Foley RN, Parfrey PS, Harnett JD. Clinical and echo-cardiographic disease in patients starting end-stage re-nal disease therapy. Kidney Int. 1995; 47:186-92. 12. Alpert MA, Wizemann V, Nolph KD, Van Stone J,
Culpepper MC. Hemodialysis and the heart. Am J Med Sci. 1995; 309:110-21.
13. ORiordan E, Lambe D, ODonoghue DJ, New J, Foley RN. Variation in dialysis patient mortality by healthy authority. Q J Med. 2003; 96:739-45.
14. Port FK, Wolfe RA, Levin NW, Guire KE, Ferguson CW. Income and survival in chronic dialysis patients. ASAIO transactions.1990; 36:154-57.
15. Husebye DG, Westlie L, Styrvoky TJ, Kjellstrand CM. Psychological Social and somatic prognostic indicators in old patients undergoing long-term dialysis. Arch Intern Med.1987; 147:1921-4.
16. Verdecchia P, Angeli F, Achilli P, Castellani C, Brocatelli A, Gattobigio R, et al. Echocardiographic left
ventricular hypertrophy in hypertension: marker for fu-ture events or mediator of events? Curr Opin Cardiol. 2007; 22:329-34.
17. Devereux RB, Liebson PR, Horan MJ. Recommendations concerning use of echocardiography in hypertension and general population research. Hypertension. 1987; 9(Suppl 2):97-104.
18. Brackbill RM, Siegel PZ, Ackermenn SP. Self-reported hypertension among unemployed people in the United States. Br Med J.1995; 310:568-72.
19. Rodriguez CJ, Sciacca RR, Diez-Roux AV et al. Relation between socioeconomic status, race-ethnicity, and left ventricular mass: The Northern Manhattan Study. Hypertension.2004; 43:775-9.
20. Sahn DJ, DeMaria A, Kissio J, Weiman A. Recommendations regarding quantitation in M-mode echocardiography: Results of a survey of echocardiografic measurements.Circulation.1978; 58:1072-9.
21. Rakowski H, Appleton C, Chan KL et al. Canadian Consensus recommendation for the measurement and reporting of diastolic dysfunction of echocar-diography: from the investigators of Consensus of Diastolic Dysfunction by Echocardiography. J Am Soc Echocardiogr.1996; 9:736-60.
22. Bisi-Molina MC, Cunha RS, Herkenhoff LF, Mill JG. Hypertension and salt intake in an urban population. Rev Saúde Pública. 2003; 37:743-50.
23. Cannela G, Albertini A, Assanelli D et al. Effects of changes in intravascular volume on atrial size and plasma levels of immunoreactive atrial natriuretic peptide in uremic man. Clin Nephrol.1988; 30:187-92.