Resumo
– Um aumento na ênfase dada ao mercado de consumidores de carne de frango e modelos de maximização de lucros na produção de frangos de corte geram resultados que diferem daqueles obtidos em mo-delos tradicionais de maximização de lucros. Esta metodologia revela que a adoção de step-pricing e considerando opções de mercado ( exemplos de resposta às preferências de consumidores) afetam os níveis ótimos de formulação de rações e os tipos de produção de frangos de corte que geram uma lucratividade máxima. A adoção de step-pricing atesta que maiores lucros podem ser obtidos para pesos-alvo somente se preços-prê-mio para produtos processados de carne de frango forem contratados.Palav ras-chav e:decisões do produtor, opções de mercado, preferência
do consumidor, step-pricing.
Abstract – Increased emphasis on consumer markets in broiler profit-maximizing mo deling generates results that differ fro m tho se by traditional profit-maximization models. This approach reveals that the ado ptio n o f step pricing and co nsideratio n o f marketing o ptio ns
Consumer-Driven Profit Maximization in Broiler
Production and Processing
Ecio de Farias Costa1
Jack E. Houston2
1 Professor de Economia at UFPE- Ph.D. em Economia Agrícola, University of Georgia,2001-E-mail: ecio@ yahoo.com
( examples of responsiveness to consumers) affect the optimal feed formulation levels and types of broiler production to generate maximum profitability. The adoption of step pricing attests that higher profits can be obtained for targeted w eights only if premium prices for broiler products are contracted.
Key Words: co nsumer preferences, pro cesso r decisio ns, marketing options, step pricing.
Introduction
Vertically integrated chains of production in the broiler industry m ake determ inatio n o f pro fit-enhanc ing dec isio ns perplexing. Ascertaining pro fits in bro iler pro ductio n is co mplex, because the production and processing involve many steps, ranging from hatchery to production using formulated feeds to processing in the plants and to distribution onwards. Efficient organization and utilization of resources w ill pro duce no t necessarily the heaviest, but the mo st pro fitable, broilers. The retail market is consumer-driven, and thus it is important fo r the pro cesso rs to meet the specific characteristics desired by consumers for product size and quality most profitably.
Higher prices are paid to processed parts that meet specifications of the retail market, and this premium price concept is termed step pricing. Such specifications can be used for selling chicken parts that target a weight range that the consumer prefers, for example. The concept of marketing options is based on the premise that broiler processors must decide at what processing level they want to sell their products; i.e., whether to process chickens into whole carcasses, or to further process them to sell as cut-up parts, seasonally adjusting to the market. The prices paid differ as to the level of processing, and the production process is also directly influenced by the marketing decision process. After the step-pricing and marketing options are chosen, it is necessary to integrate this information into the decision model to determine the most efficient feed formulation and production process to yield targeted products.
The proper feed ration is formulated according to prior information on step-pricing and marketing options, but it will also be formulated according to the prices and availability of nutrient sources. Other factors also play a role in the broiler model composition. For example, it is necessary to factor in the gender percentage of the chicks, temperature and size o f the ho use, and o ther facto rs influencing the o ptimal production of the targeted product.
The profit-maximizing analysis for consumer market-driven broiler production and processing decisions presented in this study is composed of three stages. First, broiler response functions over experimental feeding data are estimated to determine the broiler production functions to be used in the profit maximization model. Second, results obtained from the production scenarios are used for profitability analysis of the two marketing options: selling broilers processed as whole carcass vs. selling broilers processed as cut-up parts. Finally, a step-pricing analysis of outputs generated by the two marketing options determines premium prices (step-prices) that are as profitable as baseline scenarios for target weights determined by the retail market in response to consumer preferences.
Related Literature
Profit Maximization and Cost Minimization Broiler Models
Starting in the 1950’ s with the widespread adoption of mathematical programming, interest in feed formulation was renewed. For decades, the major objective to be attained in optimal broiler production was to minimize the cost of feed, and little consideration was allocated to other determinants of profitability. Least-cost rations minimize the cost of diets, given a certain set of ingredients and their nutritional content. An important assumption of least-cost formulated diets is that every unit o f a least-co st fo rmulated ratio n has the same pro ductivity regardless of ingredient sources (Allison and Baird, 1974).
The adoption of simple cost minimization does not account for differentials in pro duc tiv ity amo ng input so urc es; e . g., b ro iler performances in experimental trials of those birds fed peanut meal protein vs. those fed soybean meal (SBM) protein have been shown to differ significantly (Costa et al., 2001). On the other hand, the adoption of profit maximization techniques later in the 1990’ s has taken into consideration the productivity aspects of economically efficient broiler production. Few models have been developed thus far, and they differ in their approaches to the problem.
Gonzalez-Alcorta et al. (1994) developed a profit maximization model that uses nonlinear and separable programming to determine the precise energy and protein levels in the feed that maximize profit. Their model is distinguished by the assumption that body w eight is not fixed at a predetermined level. Feed cost is not determined by least cost feed formulation. Rather, feed cost is determined as a variable of the profit maximization model in a way similar to that described in Pesti et al. (1986). Gonzalez-Alcorta et al. (1994) conclude that setting energy and protein levels that vary with output and input prices can raise profit compared to fixed diet levels of energy and protein based on previous nutritional guidelines.
of time that the broilers must stay in the house and other factors, for given temperature, size of the house, costs of inputs and outputs and fo r certain, pre-determined pro tein level, so urce, and pro cessing decisions. They conclude that peanut meal can be more profitable than SBM for growing birds to be processed and sold as whole carcasses.
The analysis conducted in our study differs from Costa et al. (2001) by develo ping a decisio n mo del that allo w s fo r a single, feedback procedure that is determined by the consumer-oriented price signals. This construction not only generates processing alternatives for selling w hole carcass and cut-up parts, but the model also determines the marketing option that is the most profitable, given expected product prices. The solutions allow for adjustment of the production to given targeted w eights and premium prices fo r bro iler pro ducts in the procedure, called step pricing, as already mentioned. An important feature of this model is that the processing decision takes place only after expected prices of inputs and outputs are determined. The prices of outputs are determined by consumers in the market place.
This study uses data obtained from an experiment conducted at the University of Georgia3, which uses trials conducted for the collection of
info rmatio n o n live bo dy w eight, feed co nsumptio n and w eight o f processed parts. This data set, which contains productivity information, is used to estimate the production response functions that are used in the profit maximization model of this study.
Model Description
A brief description of the model follows4. The objective function to
be optimized is:
3 Feed composition and feeding level experiment was conducted by the Poultry Science Department at the University of Georgia. The experiment consisted of using four different levels of protein (17% , 20% , 23% , and 26% ) using SBM as protein source to feed broiler chickens until 42 days and collecting body weight, feed consumed and weight of processed parts. For more detailed information, contact the authors.
t
I
FC
P
BW
DP
Max
Π
=
[(
BW∗
)
−
(
FC∗
)
∗
]
/
( 1)subject to (among the full set of constraints):
DEL
P
P
FC=
F+
( 2)∑
==
n t t tF
P
X
P
1
*
( 3))
,
,
,
,
(
FC
FC
2PR
PR
2FE
f
BW
=
( 4))
,
,
,
,
(
t
t
2PR
PR
2FE
f
FC
=
( 5)t
r
I
)
365
1
(
+
=
( 6)for marketing options,
BF
LV
DP
BW=
k ( 7)]
)
1
[(
k DOAk
BF
DOA
ADP
DOA
P
LV
=
∗
−
∗
+
∗
( 8)BW
CAT
PRO
P
w
ADP
l l l l l k∑
∗
−
−
=
)
(
(
( 9))
,
,
,
(
BW
PR
PR
2FE
f
w
l=
( 10)and, for the step-pricing,
In the objective function (Equation 1), maximum profit per bird per day (Π), is defined as a function of derived price (DP
BW), live body weight (BW), cost of feed consumed (PFC), feed consumed (FC), interest c o st (I) , and feeding time (t) . Due to the o b jec tiv e func tio n’ s specificatio n, the co nstraint set includes a number o f equatio ns (nutrition constraints, and other constraints in the model) that are not specifically mentioned in this manuscript. However, the most relevant co nstraints that allo w fo r a direct co mpariso n betw een the tw o marketing options and step-pricing analyses are described next. Cost of feed consumed (PFC) includes feed delivery cost (DEL) and the least cost feed (P
F, Equation 2). The least cost feed function (FC) minimizes the cost of feed for pre-determined ingredients (Xi) and their prices (Pi) and is determined by the optimization process (Equation 3). Live chicken body weight (BW) is determined by feed consumed (FC), feed consumed squared (FC2), protein level (PR), protein level squared (PR2), and an intercept shifter for female chickens (FE, Equation 4). The coefficients of the BW function are determined by ordinary least squares (OLS) on experimental data. Feed consumed (FC) is determined by feeding time (t), feeding time squared (t2), protein level (PR), protein level squared (PR2), and an intercept shifter for female chickens (FE, Equation 5). Interest cost (I) is determined as a function of the annual interest rate (r) figured daily (dividing by 365 days) and the number of days necessary to grow broilers (t, Equation 6).
The constraints in the model that introduce alternative marketing options are presented in Equations 7-10. The marketing option varies according to the marketing option k (whole carcass or cut-up parts marketing option). Derived price (DPBW, Equation 7) is a function of live value of birds delivered to the plant (LVK) divided by the number of birds that finished the production process (BF). LV
K (Equation 8) is a function of BF, and average values of the weights of processed part k
(ADPk, Equation 9) depend on the processed weight (wl).
Equation 10 is estimated as processed weight, wl, of each part l
live weight of the bird (plus offal and giblets). Each equation is estimated as a function of live bird weight (BW), protein level (PR), protein level squared (PR2), and gender of birds (FE). The coefficients are estimated by OLS on experimental data.
We modify the model for the adoption of the step-pricing constraint by setting a further constraint on the targeted weight for the processed part that is to be produced. Equation 11 presents the constraint that is added to the model. The target weight of part l, TWl, is determined by the co nsumer retail market and must be met by the pro cesso r by contracting with buyers of such weight-targeted processed parts. If the model finds the target weight as an optimal answer, it uses the premium price, TPl, as a step-price in the model. If not, the model uses the lower, general product price, P
l.
The linear program model is simulated using a built-in linear program analysis package in Microsoft Excel (2000), Solver. Each simulation is recorded and comparison analyses are conducted among the optimal results fo r every scenario . Step-prices are also inco rpo rated in the simulations to obtain the targeted weights. The optimal answers and co mpariso n analyses are presented next, as w ell as the estimated production responses that are estimated using SAS (1996).
Estimated Production Responses
Smith (1984) that show that production responses of broilers to dietary energy and protein levels show diminishing marginal returns.
Prices of inputs and outputs are collected for the profit maximization analysis. The prices data include prices of ingredients available for the ration formulation, including major feedstuffs and synthetic amino acids that supplement the deficiencies of major sources, and prices received in Georgia (or the Southeast of the United States, which is responsible for the largest production in the world) for the outputs considered in the analysis as well as other costs considered in the analysis. Other inputs to the model include average temperature and size of the broiler house.
Table 1 – Estimated Body Weight, Feed Consumed, and Carcass
Weight for Broilers
Standard errors are in parentheses.
* Indicates parameter estimate is statistically significant at the 0.10 level. ** Indicates parameter estimate is statistically significant at the 0.05 level.
Body Weight and Feed Consumption functions are estimated in kg. Carcass Weight function is estimated in grams.
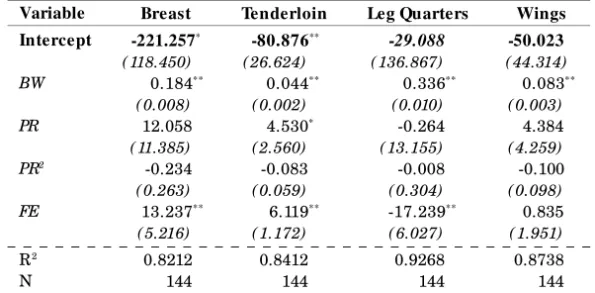
Table 2 – Effects of Live Weight, Protein Level and Gender of Bird on Weights of Cut-up Parts of Broilers
Standard errors are in parentheses.
* Indicates parameter estimate is statistically significant at the 0.10 level. ** Indicates parameter estimate is statistically significant at the 0.05 level. All functions are estimated in grams.
Model Interactions, Marketing Options and Step-pricing Analyses
Our model is first used to estimate the profitability of two baseline scenarios, where broilers are produced and sold after being processed into whole carcasses or into cut-up parts. Thus, the baseline scenarios are analyzed for the collected data on prices of inputs and outputs. Initially, c o mpariso ns are made direc tly betw een w ho le c arc ass marketing option and cut-up parts marketing option results for each selling alternative. Lastly, targeted weights are applied to the model in order to simulate premium prices and their profitability through the step-pricing concept. Optimal solution sets report broiler weights, feed consumption, feeding time, and feed composition that maximize profit under certain production function estimation, marketing option, and input/ output prices. All optimal formulated rations meet all nutrient requirements from the National Research Council (NRC, 1994) for the nutrient requirements for poultry production and replicate the industry standards. The results obtained from the interaction of the program formulate an optimal grow-out feeding ration. Each optimized ration
is fed to broilers for an optimal number of days in order to obtain an optimal weight that is to be processed and sold to a specific market, given the prices of outputs and ingredients and other costs integrated in the model, as illustrated by the case scenario in Figure 1.
Assume in Figure 1 that the current price of whole carcass is higher at a certain time o f the year because co nsumers are demanding relatively more whole carcass meat (roasting). Prices of outputs and inputs are then entered in the model, which uses previously entered information and relationships on production and returns to carcass weight products of broilers, nutrient requirements determined by the NRC (1994), size of the house, temperature, chicks gender information, and other production costs. The model incorporates these two aspects of the input and output markets, and model results suggest that the processor grow and process broilers into whole carcass. The optimal solution set that is generated by the model goes first to decisions in the broiler house, where optimal feed composition and optimal feeding time are set to deliver live body weight of birds. The body weight produced in the broiler house is transmitted to the processing plant, where the profit-maximizing carcass weight is the outcome.
Figure 1 – Example of Production and Processing Decision Schematic for Integrated Broiler Profit Maximization.
Selling Broilers According to Marketing Options - Baseline Scenarios
processed and sold as whole carcass or cut-up parts markets under the prices of inputs and outputs observed for the time period chosen. Although processing broilers into cut-up parts generates the most profitable marketing option, results can and will differ for different price circumstances.
The NRC (1994) recommends that the protein level in the diets used for broilers in the grower phase, from 3 to 6 weeks, should be equal to 20% . However, the formulated feeds in this model present protein levels above the recommended level. Comparative results also indicate that a longer feeding time and more feed consumed are allocated to produce a heavier bird for the cut-up parts marketing option than for the whole carcass marketing option. Cut-up parts have an aggregated value that is higher than the value of whole carcass. Therefore, a longer feeding cycle and more feed consumed can be used to seek a higher profitability in terms of net returns per bird per day.
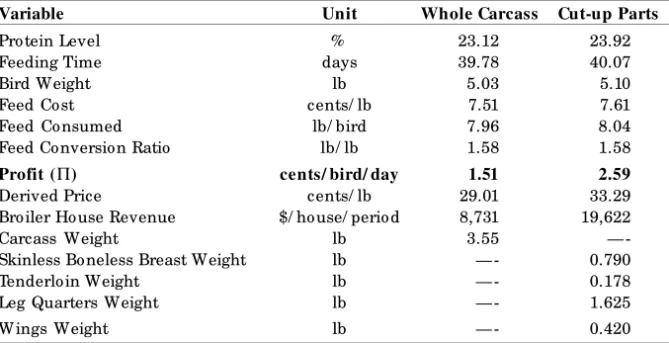
Table 3 – Scenarios Obtaining Maximum Profitability in Broiler Production
under Consumer-determined Marketing Conditions
Variable Unit Whole Carcass Cut-up Parts
Protein Level % 23.12 23.92 Feeding Time days 39.78 40.07
Bird Weight lb 5.03 5.10
Feed Cost cents/ lb 7.51 7.61 Feed Consumed lb/ bird 7.96 8.04 Feed Conversion Ratio lb/ lb 1.58 1.58
Profit (Π) cents/ bird/ day 1.51 2.59
Derived Price cents/ lb 29.01 33.29 Broiler House Revenue $/ house/ period 8,731 19,622 Carcass Weight lb 3.55 — -Skinless Boneless Breast Weight lb — - 0.790 Tenderloin Weight lb — - 0.178 Leg Quarters Weight lb — - 1.625
Wings Weight lb — - 0.420
Step-Pricing Analysis for Targeted Weight of Whole Carcass and Cut-up Parts
model that sets carcass or cut-up parts weights equal to a desired level (as indicated in Equations 10 and 11, and Figure 1). This desired level is determined by the retailers, who learn from their own consumption studies w hat pro cessed w eights o f carcass o r cut-up parts their consumers prefer. Thus, a poultry processor must meet certain weight levels in order to induce a premium price from the retailers. As an example, fast food restaurants require that the weight of chicken breasts fall within a tight range that will fit in the standard sandwich bread. They w ill pay a premium price (or step-price in our model) to the processor that sells them a product meeting these specifications.
Sample data on carcass, skinless boneless breast, tenderloin, leg quarters and wings weights were collected from a food retailer, and the average weights for each processed part were assumed to be the target weights. All averaged weights reported by the food retailer are higher than the optimal levels indicated in the previous analyses of the baseline scenarios conducted with current market prices and no target weights set as constraints. Despite those differences, the next analyses show target w eights and the c o rrespo nding step-pric es that make the production process as profitable as the baseline solutions for the various marketing options.
Step-Pricing Analysis on Whole Carcass
Ecio de Farias Costa &
Jack E. Houston
n
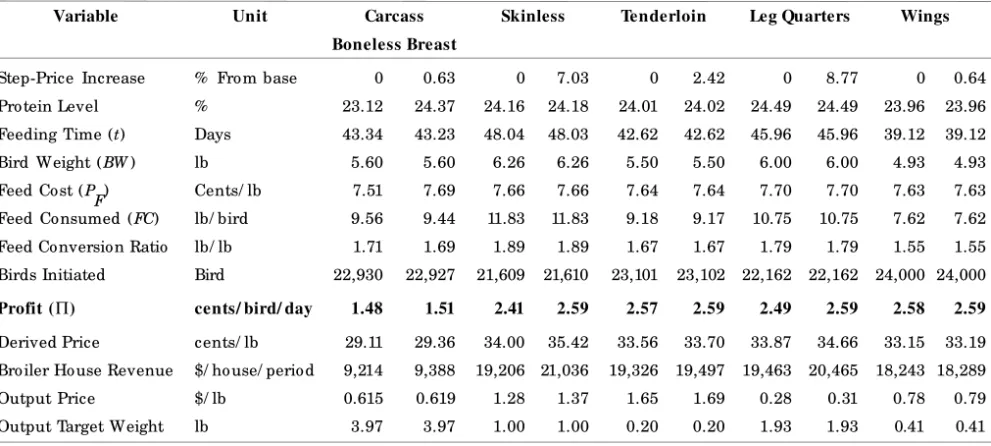
Variable Unit Carcass Skinless Tenderloin Leg Quarters Wings
Boneless Breast
Step-Price Increase % From base 0 0.63 0 7.03 0 2.42 0 8.77 0 0.64
Protein Level % 23.12 24.37 24.16 24.18 24.01 24.02 24.49 24.49 23.96 23.96
Feeding Time (t) Days 43.34 43.23 48.04 48.03 42.62 42.62 45.96 45.96 39.12 39.12
Bird Weight (BW) lb 5.60 5.60 6.26 6.26 5.50 5.50 6.00 6.00 4.93 4.93
Feed Cost (P
F) Cents/ lb 7.51 7.69 7.66 7.66 7.64 7.64 7.70 7.70 7.63 7.63
Feed Consumed (FC) lb/ bird 9.56 9.44 11.83 11.83 9.18 9.17 10.75 10.75 7.62 7.62
Feed Conversion Ratio lb/ lb 1.71 1.69 1.89 1.89 1.67 1.67 1.79 1.79 1.55 1.55
Birds Initiated Bird 22,930 22,927 21,609 21,610 23,101 23,102 22,162 22,162 24,000 24,000
Profit (Π) cents/ bird/ day 1.48 1.51 2.41 2.59 2.57 2.59 2.49 2.59 2.58 2.59
Derived Price cents/ lb 29.11 29.36 34.00 35.42 33.56 33.70 33.87 34.66 33.15 33.19
Broiler House Revenue $/ house/ period 9,214 9,388 19,206 21,036 19,326 19,497 19,463 20,465 18,243 18,289
Output Price $/ lb 0.615 0.619 1.28 1.37 1.65 1.69 0.28 0.31 0.78 0.79
Output Target Weight lb 3.97 3.97 1.00 1.00 0.20 0.20 1.93 1.93 0.41 0.41
Step-Pricing Analysis on Cut-up Broiler Parts
The step-price analysis for target weights is next applied to cut-up processed parts: skinless boneless breast, tenderloin, leg quarters, and wings. According to sample data collected from a food retailer, their target weights are 1.00, 0.20, 1.93, and 0.41 lbs., respectively. The sampled average weights from the food retailer are again higher than the baseline optimal solutions, with exception of the weight of wings, which is lower than the baseline solution. In other words, the optimal solution obtained in the model interaction at current prices indicates that the weight of skinless boneless breast, tenderloin, and leg quarters are lower (and for wings, higher) than the average weights reported by the food retailer.
Columns 3-10 of Table 4 exhibit the premium price analyses on targeted skinless boneless breast, tenderloin, leg quarters, and wings weights. Target weights drive profitability down for all processed parts when compared to the baseline solutions if no step-price is applied to the model. In order to attain the same profitability level of production as repo rted in Table 3, increases in the prices o f cut-up parts are necessary. The prices of skinless boneless breast, tenderloin, leg quarters, and wings would have to increase by 7.03% , 2.42% , 8.77% , and 0.64% , respectively, to match pro fitability levels reco rded in the baseline solutions. Notice that the protein level, feeding time, and live bird weight are higher for the targeted weights of processed parts, with the exception o f w ings w eight ( that is lo w er) , than the baseline so lutio ns. This response is again due to more inputs being allocated when there is an extra reward expected as a step-price to induce the altered efficient production of broilers.
Conclusions
substantially above the average levels reported in the industry and ran-ge from 23% to just less than 25% protein level in the diet.
Comparison between marketing options indicates that profits are higher for the cut-up parts marketing option than for the whole carcass market option, because more value is added to broilers processed into cut-up parts. In the whole carcass marketing option, birds are fed for shorter feeding times than are broilers in the cut-up parts marketing option. Both the average live body weight and feed consumed are lower for broilers produced in the whole carcass marketing option than for broilers produced in the cut-up parts marketing option. Adoption of target weights represents a decline in profits, if no step-price is applied to induce the adoption of target weights. However, as step-prices are employed, profits can be increased for both marketing options to profit levels in the baseline scenarios. Negotiation must take place between retailers and processors when deciding what step-price should be adopted for different marketing options. Broiler processors must incorporate all steps of their production and processing into the decision-making and agree on contract terms that represent efficient allocation of their inputs. This should include seasonal and other market-related information, especially as pertains to product mix in each cycle of production. Retailers must recognize that step-prices may be required to induce special requests for targeted weights that are expected from poultry processors. Determining what the terms of negotiation should be is beyond the scope of this study, but the findings generated by this comprehensive profit-maximizing model may serve as a promising start. The behavior of broiler processors in Brazil and the United States must change to incorporate the concepts of step-pricing and consumer preferences in their production and processing. By doing that, their profitability in broiler production and processing will increase considerably.
References
ALLISON, J. R., and D. M. BAIRD. 1974. “ Least-cost Livestock Productions
Rations.” Southern Journal of Agricultural Economics 6: 41-45.
COSTA, E. F. 2001. Economic Modeling for Optimal Broiler Production and Pro cessing. PhD Dissertatio n. Department o f Agricultural and Applied Economics, University of Georgia.
COSTA, E. F., B. R. MILLER, G. M. PESTI, R. I. BAKALLI, and H. P. EWING. 2001. “ Studies on Feeding Peanut Meal as a Protein Source for Broiler Chickens.”
Poultry Science Journal 80(3): 306-313.
COSTA, E. F., B. R. MILLER, J. E. HOUSTON, and G. M. PESTI. 2001. “ Production and Profitability Responses to Alternative Protein Sources and Levels in Broiler Rations.”
Journal of Agricultural and Applied Economics 33, 3(December):567-581.
GONZALEZ-ALCORTA, M. J., J. H. DORFMAN, and G. M. PESTI. 1994. “ Maximizing Pro fit in Bro iler Pro ductio n as Prices Change: a Simple
Approximation with Practical Value.” Agribusiness: An International Journal
10:389-399.
MICROSOFT® EXCEL 2000. Copyright© 1985-1999 Microsoft Corporation.
NATIONAL RESEARCH CCOUNCIL (NRC). Nutrient Requirements of Poultry.
(9th revised edition). Washington, DC: ®National Academy Press, 1994.
PESTI, G. M., and C. F. SMITH. 1984. “ The Response of Growing Broiler Chickens
to Dietary Protein, Energy and Added Fat Contents.” British Poultry Science
Journal 25:127-138.
PESTI, G. M., R. A. ARRAES, and B. R. MILLER. 1986. “ Use of the Quadratic Growth Response to Dietary Protein and Energy Concentrations in Least-cost
Feed Formulation.” Poultry Science Journal 65:1040-51.
SAS INSTITUTE INC. SAS® Version 6.10, Cary, NC: SAS Institute Inc. 1996.