THIS REPORT WAS PREPARED BYDANIELAGAMEIRO,AMASTERS INFINANCE STUDENT OF THENOVASCHOOL OFBUSINESS AND
ECONOMICS,EXCLUSIVELY FOR ACADEMIC PURPOSES. THIS REPORT WAS SUPERVISED BYROSÁRIOANDRÉ WHO REVIEWED THE VALUATION METHODOLOGY AND THE FINANCIAL MODEL. (SEEDISCLOSURES ANDDISCLAIMERS AT END OF DOCUMENT) EDP is currently increasing its installed capacity in
green energy sources. In Iberia, it is expected an increase of installed capacity in hydro from 3,627 MW in 2015 to 7,170 MW in 2019. In Brazil, we expect an increase of 29% during the same period. Additionally, EDPR has a plan to increase its portfolio of wind and solar of approximately 0.6 GW in the upcoming years.
PPA/CMEC’s stable gross profit is coming to an
end, shifting its operations to the liberalized market. It is expected that the EBITDA of the segment will decrease from€674 million to€118 million in the period 2014-2019.
Brazil – the drought that the country is going
through is abnormal, and we think that the situation will reverse, hence benefiting EDP’s new hydro projects.
Spain and Portugal’s officials are putting every
effort to reduce the tariff deficit in order to end with the situation in 2020 as it is expected by the European Commission.
Every operating segment has a positive NPV.
Company description
EDP is the largest utility company in Portugal and one of the largest energy operators in the Iberian market. EDP operates in the electricity and gas market through generation, distribution and supply. It also owns 77.5% of EDP Renewables and 51% of EDP Brazil operations through generation, distribution and supply of electricity.
EDP - E
NERGIAS DE PORTUGAL
C
OMPANY
R
EPORT
U
TILITIES
S
ECTOR
3 J
UNE2015
S
TUDENT
: D
ANIELA
G
AMEIRO
[email protected]
Recommendation: HOLD
Price Target FY15: 3.54€
Price (as of 29-May-15) 3.56€
Reuters: EDP.LS, Bloomberg: EDP.PL
52-week range (€) 3.04-3.75 Market Cap (€m) 12,999 Outstanding Shares (m) 3.657
Source: EDP
Source: Bloomberg
2014 2015E 2016F EBITDA (€m) 3,642 3,677 3,655 Net Profit (€m) 1,264 1,111 1,105 Net Debt/Equity 1.48 1.50 1.42 Net Debt/EBITDA 4.86 5.01 4.90 EPS 0.35 0.30 0.30 P/E 10.29 11.16 11.72 Dividend Yield (%) 5.20% 6.34% 5.58%
Source: Company Data and Analyst’s estimates
Reducing the Carbon Footprint
By becoming Greener and Greener every year…
0 50 100 150
fev-10 out-10 jun-11 fev-12 out-12 jun-13 fev-14 out-14
PSI20 Index
T
ABLE OF
C
ONTENTS
EDP OVERVIEW ... 3
COMPANYDESCRIPTION... 3
SHAREHOLDERS STRUCTURE... 5
BUSINESS FRAMEWORK... 6
MACROECONOMIC CONTEXT... 6
GLOBAL ENERGY TRENDS... 6
REGULATORYCONTEXT... 9
VALUATION PRINCIPLES...10
ELECTRICITY GENERATION IN IBERIA ...13
LONG- TERMCONTRACTEDGENERATION... 14
LIBERALISEDGENERATION(EXCLUDING WIND AND SOLAR)... 16
ELECTRICITY SUPPLY IN IBERIA...21
ELECTRICITY DISTRIBUTION IN IBERIA...23
GAS IN IBERIA ...26
BRAZILIAN OPERATIONS ...28
GENERATION ANDSUPPLY... 28
DISTRIBUTION... 32
NON-HYDRO RENEWABLES SECTOR ...33
FINAL CONCLUSIONS ...34
SUM-OF-THE-PARTS... 34
SENSITIVEANALYSIS... 34
APPENDIX ...35
Generation
Distribution
Supply Generation
EDP O
VERVIEW
C
OMPANYD
ESCRIPTIONEDP – Energias de Portugal was created in 1976 after the fusion of thirteen nationalized companies. The privatization process began in the year 1997 when the company made its IPO and since then, EDP has been listed in NYSE Euronext Lisbon.
EDP has established itself as a vertically integrated business, which owns diversified operations in major areas of the energy industry. The firm has its business structured in three main operating divisions, Iberia, EDP Renewables and EDP Brazil. The core business of the company is mainly based in the Iberian market where EDP operates in the generation, distribution, and supply of electricity and supply and distribution of gas. The firm also operates around the world through EDP Renewables which, similarly to EDP, is listed in NYSE Euronext Lisbon. EDP owns 77.5% of this company, which operations are tied to the generation of electricity in 11 different countries through the use ofrenewable sourcesof energy, such as the wind and the sun. Additionally, EDP owns 51% of EDP Brazil, which is listed in the New Market of the Stock Exchange of São Paulo. The firm has operated in this country since 1996 in the segments of generation, supply and distribution of electricity.
As it can be seen in figure 2, a large part of the EBITDA generated by EDP in 1Q2015 (€1,017 million) belongs to the regulated (31%) and renewables (31%) segments. These units have lower exposure to market risk, due to the fact that they operate under a business environment controlled by regulators, but they are subject to risks tied to possible unfavorable decisions taken by these external regulating entities. On the other hand, the liberalized segment is exposed to the market (having a 10% share of the total EBITDA of the company).
Currently, EDP is one of the major European energy operators, and is the largest Portuguese industrial group, having had a slow but steady growth over the past years as it can be seen in figure 3.
By looking at five of the most used financial ratios to financially evaluate companies, some conclusions can be taken regarding EDP and its “closest peers1”: i) EDP can be considered an attractive investment since its ROE is within 15-20%2, but it still has a ROE 10 percentage points lower than the one presented by Endesa; ii) its ability of using assets to generate earnings measured by the
1
More information regarding EDP’s peers in Appendix 1
2
In general, financial analysts consider an ROE in 15-20% range to represent attractive levels of investment quality –Source: Investopedia
Figure 1: Lines of Business
Figure 2: EBITDA Breakdown (%) – 1Q2015
Source: Company Data
15%
10%
31% 31%
12% -1%
LT Contracted Generation Liberalised Activities Iberia Regulated Networks Iberia Wind & Solar Power Brazil
Other
Table 1 – Operating Data
Financial Year 2014
Installed Capacity (MW) 22.469 Electricity Distributed (GWh) 79.428 Electricity Generation (GWh) 60.220 Gas Distributed (GWh) 53.846 Clients connected (th) 9.894 Employees 11.798
Source: Company Data EDP SA
EDP Renewables
Iberia EDP Brazil
Generation
Distribution
Supply
ROA is below the equivalent ability of its two most direct peers; iii) EDP has the highest EV/EBITDA, but also the lowest P/E.
Regarding leverage, EDP has defined as one of its strategic goals for the business cycle beginning in 2014 and ending in 2017 to undergo a financial deleveraging process so that it is able to improve credit ratios and mitigate business risk. As it can be seen, figure 4 shows a commitment to this objective. Despite the focus in improving its credit metrics, EDP’s ratings attributed by the three most important global rating agencies haven’t still improved significantly. The main reasons that have led these agencies to be reticent in upgrading EDP’s rating are tied to the current tariff deficit in Iberia3 as well as the economic recession that has affected Portugal and Spain in the past few years.
However, due to the latest debt policy which was undertaken by the company, EDP has been recently slightly upgraded into an “Investment Grade” status. The cause for the upgrade was also tied to the stabilization of the tariff deficit, the lower likelihood that more regulatory cuts will be needed, and the increasing diversification of the company’s operations.
Most of the EDP’s debt (72%) is in Euros, being the rest denominated in foreign currency. This debt allocation creates a dynamic, in which a higher foreign currency appreciation will reduce part of the euro value of the debt.
As part of its strategic plan, EDP is also basing a great chunk of its future growth on CO2-free technologies, namely wind and hydro. As it can be seen in figure 6, the growth capex is mainly focused on wind and hydro. Regarding wind and solar, EDP’s expansion is focused in markets with solid profitability and attractive fundamentals. The company is expected to expand its capacity at an average pace of 500MW per year during the period that begins on 2014 and ends in 2017. In Portugal, EDP has an ongoing expansion plan in new hydroelectric capacity,
3
See section “Business Framework” for further detail on this subject Figure 3 - EBITDA (million euros)
Source: Bloomberg
0 2,000 4,000 6,000 8,000
2010 2011 2012 2013 2014 Endesa Iberdrola EDP
Table 2: Financial Ratios – Average 2014
Endesa Iberdrola EDP ROE 22,94% 6,58% 12,15% ROA 7,70% 2,53% 2,45% EBITDA Margin 16,17% 22,89% 22,40% EV/EBITDA 8,48 8,74 9,11 P/E n.a. 13,29 11,93
Source: Bloomberg
Figure 5: EDP consolidated debt by currency (%) – 2014
Source: Company data
EUR 72% PLN
1% USD 22%
BRL 5%
Figure 4: Credit Metrics
Source: Company Data
60% 61% 60% 59% 58%
17%12% 15%11% 14%9% 14%10%
0% 50% 100%
2012 2013 2014 2015 1Q15 Leverage FFO/Net Debt
Table 3: S&P Rating vs. Peers
Company Country Rating
EDP Portugal BBB-Iberdrola Spain BBB Endesa Spain BBB E.On Germany A-EDF France A+ Centrica UK A-Enel Italy BBB
Figure 7: Shareholder Structure
Source: EDP (update 21-05-2015)
China Three Gorges
(CTG) 21%
Capital Group Compani
es, Inc. 15%
Oppidum 7% BlackRo
ck, Inc. 5% Senfora
BV 4% Remaini
ng sharehol
ders 48%
which includes an investment of€2.3 billion in 2.2 GW of new capacity allocated to this type of power generating assets.
S
HAREHOLDERS STRUCTURE4EDP’s share capital is composed by a total of 3.656.537.715 shares, with a nominal value of 1€each. Since its inception, the company’s shareholder structure has changed significantly, making a transition from a state-owned company to a company in which the state only has a minority interest. In order to reach its current composition, EDP had to undergo 8 privatization phases.
Currently, the company is mainly owned by foreign investors. As of 31 December 2014, only 14% of the company was owned by Portuguese entities and the main percentage of its shares (34%) belonged to European entities (excluding Iberia). In the most recent times (from 2014 onwards), the biggest changes in EDP’s shareholder structure were related with the Capital Group’s5 participation increase from 5% in 2013 to 15.10% in May 2015 and the sale of Iberdrola’s 6,66% stake in the company (partnership that existed since 1998). The decision by Iberdrola to decrease its position in EDP follows its discomfort regarding the ceiling of 5% of voting rights that penalized it during the decade that preceded the sale of EDP’s 21.35% by the Portuguese state to CTG.
The purchase by CTG occurred in December 2012 and the transaction amounted to €2.7 billion (€3.45 per share). The transaction was made at 53%6premium to its share price. Subsequent to the purchase, EDP’s share price increased in the following two weeks from€2.33 to€2.40.
Strategic Partnership with China Three Gorges
CTG is the largest clean energy group in China. As EDP, CTG is focusing its expansion plan on renewable energies, which means that there may exist synergies between the plans of the two coompanies. EDP and CTG entered in a strategic partnership where: i) CTG will invest €2 billion which will be spent on acquisitions of minority stakes and investments related with renewable projects; ii) find a Chinese financial institution to give a credit facility of€2 billion to EDP for up to 20 years; iii) develop new growth opportunities. Until the present moment CTG has already committed€1 billion to investments in renewable energy undertaken by EDP. These investments are tied to hydro in Brazil (São Manoel, Jari and Cachoeira- Caldeirão), and wind in Portugal (1st block and 2nd block).
4
Remaining shareholders include shareholders with ownership lower than 3%, such as Grupo BCP+Fundo Pensões do Grupo BCP (2,44%), Sonatrach (2,38%), Qatar Investment authority (2,27%), EDP (Treasury Stock) (0,62%)
5
Capital Group is one of the largest investment management companies worldwide with assets around USD 1 trillion
6
Bugge Axel. 2011.China Three Gorges buys EDP stake for 2.7 billion euros.Reuters Figure 6: 2015E-2017E Capacity Additions
(% new MW)
Source: Company Data
Wind PPA LatAm;
5% Wind others;
8%
Wind PPA USA; 36% Hydro
Portug al; 47%
Hydro PPA Brazil;
4%
Table 4: CTG’s Highlights - 2014 Installed Generation
Capacity - Hydro
46.3 GW
% China hydro capacity 15% Hydro projects under construction
28 GW
Moody's rating Aa3
Figure 8: Evolution in Iberia
Source:IMF, World DataBank
-4.00% -3.00% -2.00% -1.00% 0.00% 1.00% 2.00% 3.00%
Portugal
-2.00% -1.00% 0.00% 1.00% 2.00% 3.00%
Spain
GDP Growth (%) Population Growth (%)
B
USINESS
F
RAMEWORK
Before providing a segment by segment valuation of EDP’s activities, we will start by presenting an analysis of the overall market in which EDP operates. In order to perform this analysis, we will focus our interest in the macroeconomic environment surrounding the company, and also on the outlook for specific types of energy, which are tied to the operations of EDP. This analysis will provide a general overview, which will allow a better understanding of the assumptions used to value each of the segments.
M
ACROECONOMIC CONTEXTIn order to better understand the evolution of the demand for the energy produced by EDP, it is necessary to start by evaluating the growth of population and also the growth of GDP in the countries that are most important for EDP’s operations. These countries are respectively, Portugal, Spain, and Brazil. The United States of America (USA) may have an important role
related to the consumption of the energy produced by EDP Renewables, and hence, will also be included on our analysis.
As it can be seen in the figures 8 and 9, in the past three years, the GDP growth and the population growth was low for the countries in consideration, which is tied with the financial crisis that led to the decrease7 in energy demand.
However, for the future, we expect that this trend will change its direction as result of the expected population growth and economic growth. We expect that this increase will impact positively the energy demand produced by EDP.
G
LOBAL ENERGY TRENDSIn order to fully understand the external forces which will drive the demand, for the main types of energy produced by EDP, a brief overview of the issues, which may affect the consumption of each of these types of energy, will be given. In terms of
7
Electricity demand in OECD decreased by 4.9% on a YoY basis in the 1stquarter of 2009 and 3.5% in Brazil in the same period. (Source: IEA) Figure 9: Evolution in America
Source: IMF, World DataBank
0.00% 0.50% 1.00% 1.50% 2.00% 2.50% 3.00%
3.50% Brazil
0.00% 1.00% 2.00% 3.00%
4.00% USA
Figure 11: Evolution of EUA
Source: Bloomberg
0 5 10 15 20 25 30 35
€
/t
o
n
C
O
2
EDP’s installed capacity, the types of energy, which have a major relevance for the company, are hydro (34%) and non-hydro renewables (36%) as can be seen in figure 10. Although the use of energy through nuclear power by EDP being residual, this type of energy is also relevant to the company, due to the fact that it is used by some of its most important competitors, Iberdrola and Endesa. In this sense, the outlook for this energy is also going to be provided.
RENEWABLESSOURCES
Due to the recent awareness of companies in reducing the CO2 emissions, EDP
has been focusing a large percentage of its installed capacity mix in renewables sources of energy. However, we think that given the low CO2 prices8, the
producers will have fewer incentives to decrease their emissions, and hence slow down the path of emitting lower values of CO2advocated by the European Union.
The sharp decrease in CO2 prices (figure 11) from the past 7 years are the result
of structural surplus of allowances, mainly caused by the decrease in demand as result of the economic crisis. In order to solve this problem, the European Commission, expects that carbon prices will increase to €39/tC02 9in 2020, under
the “cost efficient” scenario for meeting the 2020 targets. We expect that this increase in CO2prices will lead the companies to increase its installed capacity in
renewable sources of energy. In this sense, we think that the supply of this type of energy will increase and EDP is no exception since it is now focusing most of its future growth in hydro and wind as will be explained further in detail in the next sections.
Despite the clear environmental advantage of this type of energy, the problem is that they are highly dependent on weather conditions. One cannot be indifferent to the significant drought that has been affecting Brazil for the past few months, already considered the worst that the country is facing in 84 years. The country’s hydro plants reservoirs levels reached in 2014 the worst index since the 2001’ rationing. This scenario negatively impacts the Brazilian electricity sector, namely generators and distributors. This scenario has been negatively affecting the EDP’s results as well. As it will be thoroughly discussed on the section dedicated to the valuation of the liberalized activities, this draught has a negative effect on the load factors10 of EDP, which will lead to an increase in the production costs of this energy, and penalize EDP’s sales. However, we think that this is a unique
8
The CO2 prices are represented by EU Allowances which is carbon credit or pollution permits traded in the EU Emissions Trading Scheme (ETS). Each EUA represents one ton of CO2 that the holder is allowed to emit.
9
“Cutting Carbon in Europe – The 2020 plans and the future of EU ETS” – Carbon Trust – page 22 10
ܮܨ= ௐ
ெௐ∗ଷହ∗ଶସ
.
Load factor is a measure of energy efficiency since it measures the percentage of real production over the maximum demand(peak load) over a period. Figure 10: EDP’s Installed Capacity (%) -2014
Source: Company Data
Hydro 34%
Coal
12% Cogeneration 0% CCGT
17% Nucle
ar 1%
Figure 13: EDP’s evolution of Electricity Generation using CCGT
Source: Company Data
0 1000 2000 3000 4000 5000 6000 7000 8000
20072008200920102011201220132014
G
W
h
Spain Portugal Figure 12: Global Coal demand by region
Source: World Energy Outlook.IEA.2014
0 500 1000 1500 2000 2500 3000 3500 4000 4500
2010 2015 2020 2025 2030 2035
M
T
o
e
EU USA China India Others World
situation and we think that will not perpetuate, hence the effect in EDP’s results are short-term.
COAL
The growth in the global demand for coal has been experiencing a deceleration, which has been essentially caused by lower gas prices that were originated by the revolution of shale gas (explained in detail below). This revolution led to a decrease in the use of coal in the United States (the second largest consumer in the world) and originated a surplus of gas in Europe. As it can be seen in figure 12 it is forecasted that the demand for coal will continue to decelerate until 2040. After observing the figure it is possible to conclude that the decrease in demand for coal is also going to exist in Portugal and Spain.
The fact that the demand for coal is going to decrease, can lead us to conclude that the energy produced through the use of this source is going to slowly lose relevance as other sources of power such as gas and renewable energies will continue to gain importance. However, this loss of relevance is going to happen slower than expected in Europe, due to the fact that currently, the prices of coal are decreasing (mainly as a result of the decrease in its demand).
NATURALGAS
Regarding natural gas, despite the fact that there are prospects of an increase11in its demand at a global level, the same cannot be said for Europe. The increase in the production of natural gas that has been observed during the last decade and which has led to a decrease in its price and consequent increase in popularity is being caused by the use of new technologies and by continuous drilling in shale12. In Europe, the demand for natural gas is not evolving as positively as expected due the fragile economic situation of this continent and to the growth in the use of renewable energies. As it can be seen in figure 13, the decrease in Europe follows the same trend of EDP’s generation of electricity using combined cycle and natural gas plants.
NUCLEAR
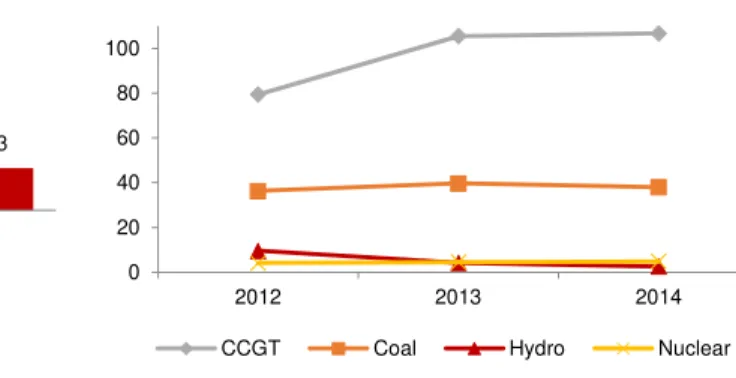
Despite EDP’s very low installed capacity in this type of energy (1%), this is one of the energy sources which provide the highest load factors (figure 14), since nuclear power plants only stop its operations for operating maintenance.
11
At a global level, the demand for natural gas is expected to increase more than 50% in the next few decades, according to “World Energy Outlook”, International Energy Agency, 12th November 2014
12
Figure 15: Crude Oil Futures (USD/bbl.)
Source: Investing 0.00 20.00 40.00 60.00 80.00 100.00 120.00 140.00 160.00
fe
v
-0
8
o
u
t-0
8
ju
n
-0
9
fe
v
-1
0
o
u
t-1
0
ju
n
-1
1
fe
v
-1
2
o
u
t-1
2
ju
n
-1
3
fe
v
-1
4
o
u
t-1
4
Figure 14: EDP’s Load Factors - 2014
Source: Company Data
0% 20% 40% 60% 80% 100% Hydro
Nuclear Coal CCGT Cogeneration Renewables
Additionally, nuclear and hydro energy sources are the ones which have the lowest generation costs due to the absence of CO2emissions.
One could say that EDP would benefit if it had more investments made in nuclear power plants, however we think that those investments will not happen. Firstly, EDP has already committed a substantial amount of funds to the expansion in hydro power plants, and a strategy shift does not look likely. Secondly, the cost of producing nuclear energy may be about to rise, as regulators are turning their attention to the possible environmental consequences of producing this type of energy (such as the ones that resulted from the accident at Fukushima).
OIL
In the most recent times, the oil market has been changing due to the volatility that social and political turmoil in the MENA region has created. Recent events in countries situated in this geographical area have created unstable geopolitical issues, which may, at any moment cause the price of the petroleum to rise. However, in the most recent months, Brent prices have been decreasing13 and have inclusively reached the levels that were only verified in 2009.
It is impossible to forecast, if the decrease in Brent prices caused by the decision of OPEC will persist in the near future. However, such low prices are definitely going to stimulate the demand for this source of energy, and will probably decelerate the current shift into cheaper and less polluting sources of energy (negative effect on the demand natural gas).
R
EGULATORYC
ONTEXTTARIFFDEFICIT
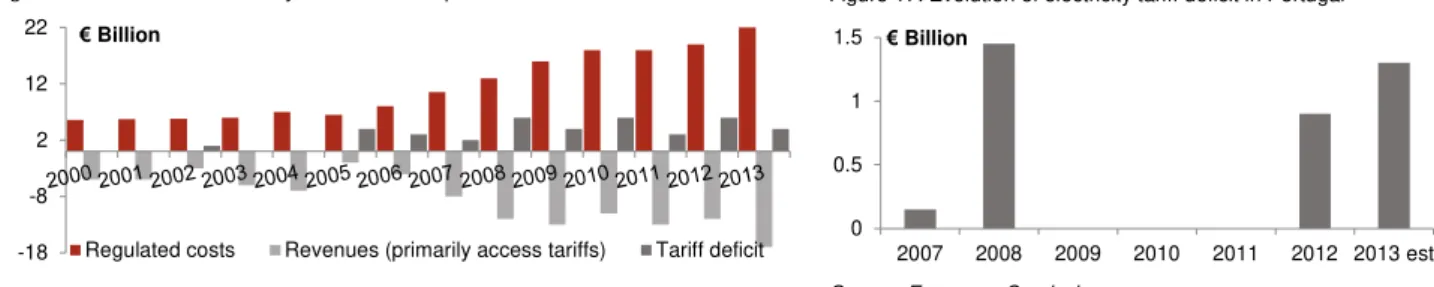
The major regulatory changes that are being made in the energy sector are related with the electricity tariff deficit14. The gap has been increasing since demand has remained flat/decreasing (lower revenues) and the tariffs have not been sufficient to cover the costs (as decided by the governments not to increase them). In 2013, Spain and Portugal faced a cumulative tariff deficit reaching 3% of their GDP and the economic crisis contributed to aggravate the situation.
13
The decrease has happened after OPEC’s decision (in November of 2014) to sustain a production of 30 million barrels a day, despite the oversupply of this fossil fuel.
14
Electricity tariff deficit emerged due to consumer tariffs being set below the corresponding costs borne by the energy companies. Figure 16: Evolution of electricity tariff deficit in Spain
Source: European Comission
-18 -8 2 12
22 €Billion
Regulated costs Revenues (primarily access tariffs) Tariff deficit
Figure 17: Evolution of electricity tariff deficit in Portugal
Source: European Comission
0 0.5 1 1.5
2007 2008 2009 2010 2011 2012 2013 est
Figure 18: The largest producers of C02 emissions worldwide in 2014 – (% of global C02 emission)
Source: Statisca
0% 5% 10% 15% 20% 25% China
USA India Russia Brazil Japan Indonesia Germany Korea Canada Iran
Since EDP has its core business in Portugal and Spain, changes in the regulatory framework will impact EDP’s results. In fact, in recent years, the introduction of several packages and modifications of the revenue model (cuts in remuneration rate, decrease in acceptable costs, etc.) have impacted the company, particularly in Portugal (as a result of EFAP15) and Spain (due to large imbalance of the tariff deficit). We think that this problem will continue to be relevant in the near future. However its impact will decrease as a result of the gradual stabilization of the macroeconomic environment in Iberia and reduction of the tariff deficit in this area.
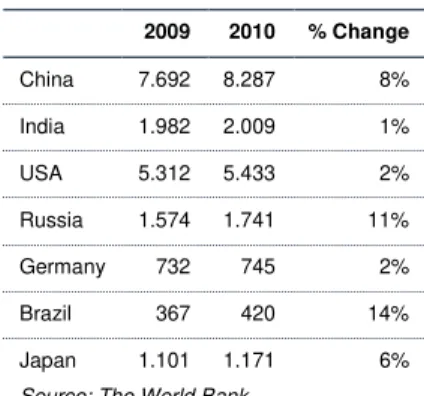
CO2Emissions
The governments of several countries have been gaining more awareness16of the impacts that the generation of energy from fossil fuels have in the environment. Despite the positive intentions of some governors, there are still countries that refuse to ratify the Kyoto Protocol and refuse to commit to decrease its CO2
emissions. On those countries are China, EUA and India, and this can be considered a serious problem since these countries are the ones with the highest percentage of global CO2 emissions as can be seen in figure 18. To add to this
problem, there are now countries that once belongedto the Kyoto Protocol which are leaving now, such as Canada, which came out very recently. Despite the
intention of the countries to achieve the goals proposed and despite the prices
imposed to those countries that pollute, it seems this is not being enough to
reduce the pollution generation by CO2emissions (table 5).
The non-ratification with the established norms and the increase of CO2
emissions, will lead to an increase of penalties imposed in the future, which will
harm companies and countries that use polluting sources of energy.
V
ALUATION
P
RINCIPLES
In order to determine the target price of EDP’s shares for the year-end of 2015 it was used the sum-of-the-parts (SOTP) approach, which has the ability to effectively take into account the fact that there exist different levels of risk inherent to each segment operated by the company. Besides the valuation that was performed to the operating segments, which will be described below, it was also considered that there were adjustments relative to the commercial activities that exist between the subsidiaries of the group (such as sales of one segment of EDP to other different segment), which had to be eliminated. These adjustments were
15
EFAP – Economic and Financial Assistance Program that was agreed between Portuguese authorities and the European Union and International Monetary Fund (IMF) in May 2011.
16
For example, in September of 2014, the Secretary-General of the United Nations held a summit named “UN Climate Summit” where he invited global leaders from various Governments, corporate businesses, and other members of civil society to discuss the measures that can be taken in order to keep global temperatures controlled and reduce the value of harmful emissions.
Table 5 - Evolution of Co2 emission (Thousands kt)
2009 2010 % Change
China 7.692 8.287 8% India 1.982 2.009 1% USA 5.312 5.433 2% Russia 1.574 1.741 11% Germany 732 745 2% Brazil 367 420 14% Japan 1.101 1.171 6%
Figure 19: Cost of equity
Source: Analyst’s estimates
6.96% 6.94%
6.32% 6.31% 10.94%
0.00% 2.00% 4.00% 6.00% 8.00% 10.00% 12.00%
Liberalized PT
Regulated PT
Brazilian Op.
allocated to a segment named “holding and other operating adjustments”, which also encompasses the activities of the holding firm (EDP S.A.).
Thevaluation methodused to value the operating segments was the Discounted Free Cash Flow (DCF), which takes into consideration the future operating free cash flows that will be received by the firm, and discounts them at an appropriate discount rate. The discount rate used, was the weighted average cost of capital (WACC17), which reflects the opportunity cost that EDP’ bondholders and shareholders will incur, weighted by the proportion of the enterprise value that each of these groups own. The only segment in which this approach was not used, was the segment exclusively tied to renewable energies. The value of EDP Renewables was obtained by directly observing its current market capitalization. Regarding the currency in which all thecash flowsare expressed, we assumed it to be the euro. For the operations in Brazil, the estimates of future cash flows were initially performed in Brazilian Reals, due to the fact that the information available to be analyzed was all denominated in local currency. After performing the estimates and before discounting the future cash flows obtained, we converted them into euros. Future FX rates were estimated by using the relative purchasing power parity principle18and IMF estimates (see Appendix 2).
In order to estimate the cost of equity(figure 19) inherent to each segment, we used the capital asset pricing model (CAPM)19. The market risk premium which was used in the performed computations, was the same for all the segments and corresponds to 5,27%20, (this value was taken from a recent empirical study). For the risk-free rate, which measures the highest return possible to be obtained by EDP’s investors in the absence of default and reinvestment risk, we considered the rate yielded by German 10-year government bonds. It is important to mention that instead of using a spot rate for the yield of these bonds, it was used a rate equal to the average of the values observed in the last 4 years. Recently, these bonds have registered the lowest historical yields not so much due to their risk profile, but more because of their relative safety when compared to other European bonds. Fundamentally, we believe that the recent sovereign debt crisis has led investors to lose confidence on economies located on the periphery of Europe, which led to a consequent “flight to quality”, in this case, a shift of funds into German bonds. The fact that in the most recent months, the ECB has resorted to the implementation of unconventional monetary policies in order to
17
ܹܣܥܥ=
ାா∗ݎௗ∗(1 −ݐ) + ா ାா∗ݎ
18
RPPP formula in this case:ܧܷܴܤܴܮ௧=൬ ଵାగಳೝೌ()
ଵାగುೝೠೌ()൰∗ܧܷܴܤܴܮ௧ିଵ
19
Capital Asset Pricing Model:ܥܣܲܯ=ݎ+ߚ∗ܯܴܲ
20
Figure 20: Segment Beta
Source: Analyst estimates
0.00 0.50 1.00 Generation and
Supply - Iberia Regulated -Iberia Brazilian Operations
address the threat of deflation has also lead to further distortions on the sovereign debt yields, including the yields of German bonds. The use of an average rate with a 4 year timespan mitigates the effect of these two events.
The risk free rate used to compute the cost of equity was the same for all of the company’s segments since all cash flows are denominated in euros. However, for the segments that are tied to operations in Brazil, we needed to take into consideration the fact that there exists a difference in inflation, which is considerably higher in this country when compared to Europe. In this sense, a country risk premium (CRP) of 2.85%21 was added to the risk free rate of segments located in Brazil.
In order to estimate thebetas, we calculated an individual beta for each of EDP’s different segments based on the average of the unlevered betas of comparable firms22 operating in similar conditions. The risk free rate chosen for the regressions that were ran in order to find the unlevered beta of comparable firms, was once again the yield of German 10-year government bonds, and the index used to recreate the global market, was the MSCI Europe, which effectively captures a large and middle capitalization representation across 15 stock markets located in Europe.
For the regulated activities of EDP, we used comparables that operate essentially in the distribution and transmission segment, as the systematic risk can be considered similar. For the generation and supply segments, we took into consideration comparables in which a large part of the income is generated from operations related with these two types of activities. The variables used to compute the cost of equity and cost of debt of the segment named “Holding and other operating segments”, were the same ones used in the Iberia segment since this segment is the one where the intracompany commercial activities are more relevant. As it can be seen in figure 20, the regulated beta is the lowest of the betas calculated, probably due to its lower dependence on the economic cycle and external free market forces.
Regarding EDP’s target capital structure23, we assumed that in the long-run it will tend to be equal to the structure used by comparable firms which is 0.84. Concerning the cost of debt24, corporate ratings given by the major credit analysts (table 6) were considered in order to help determine the market expectation of EDP’s implied cost of debt. EDP’s current credit rating yields an
21
Aswath Damodaran – “Country Default Spreads and Risk Premiums – January 2015
22
Comparalable companies in: i) liberalized segment in Iberia: Enel, Centrica, EDF, EON, GDF Suez, RWE, Endesa, Gas Natural e Iberdrola; ii) regulated segment in Iberia: Enagas, REE, REN, National Grid, Snam, Terna; iii) Brazilian operations: CIA Paranaense, CIA Energética MG, CPFL Energia, Tractebel Energia, CIA Energética SP
23
Measured in market values
24
ݎௗ=ݕ݈݅݁݀−ܲܦݔ(1 −ܴܴ)
Table 6: EDP’s credit rating
LT Rating Last Update
S&P BB+ 30-01-2015
Moody's Baa3 13-02-3015
Fitch BBB- 19-01-2015
Table 7: Cost of debt
Portugal Spain Brazil
Cost of debt
6,14% 6,14% 6,14%
Corporate tax
29,50% 30,00% 34,00%
After-tax cost of debt
4,33% 4,30% 4,05%
Source: Analyst’s estimates
Figure 21: Estimated nominal WACC
(implicit currency – EUR)
Source: Analyst’s estimates
5.76% 5.74% 5.41% 5.39% 7.79%
0.00% 1.00% 2.00% 3.00% 4.00% 5.00% 6.00% 7.00% 8.00% 9.00%
Figure 22: Electricity Generation in Iberia (GWh) in % - 2014
Source: Company Data
3%
52%
45%
0% 10% 20% 30% 40% 50% 60%
PPA/CMEC Special
Regime
Ordinary Regime
Ordinary Regime LT Contracted Generation Liberalised
Iberia
equivalent probability of default of 0.38% and a recovery rate equal to 62.20%, according to Moody’s25. In order to estimate the implicit yield, we used as a risk-free rate, the Portuguese 10 year bond, which is currently equal to 2,57%26, for all the segments and the average of the last 3 years of EDP’s 10Y CDS rates which were added to the risk-free rate. Through the use of the implicit yield, probability of default and recovery rate, it was possible to compute the cost of debt. In order to compute the after tax cost of debt for the different segments, we took into consideration each countries’ tax rate, which is presented in table 7.
Regarding the growth rate of the terminal value (g), of each of the computed cash flows, we think that EDP will have different long-term growths across each region. However, one common principle which we know about this variable is that it will have to be anchored between the long term inflation and real GDP growth27 of the country in which the subsidiary operates. If the segment is growing at a perpetuity growth rate lower than the long term inflation, than it is going to be consistently destroying its value and eventually lead the subsidiary into bankruptcy. However, if the segment is growing in perpetuity at a pace which is higher than the real GDP growth of the country, it will end up overtaking the country’s economy in terms of size and value, which also isn’t minimally realistic. Consequently, for the growth rate of operations situated in Iberia, it was considered the Eurozone target inflation which is 2% and for the Brazilian operations it was considered the long term inflation estimated by IMF equal to 4,75% (see Appendix 2).
The estimated nominal weighted average cost of capital derived for each segment through the use of the information depicted above can be consulted on figure 21.
E
LECTRICITY
G
ENERATION IN
I
BERIA
The electricity generation segment can be divided into two different parts, the ordinary regime (PRO) and the special regime (PRE). Under the ordinary regime, EDP sells electricity in the free market. On the other hand, the market tied to the special regime generation works through bilateral agreements between producers and last resort suppliers. Besides the division in ordinary and special regime, the electricity generation segment is also divided, in long term contracted generation and liberalised generation (figure 22) which will both be extensively analysed in the following sections.
25
Sharon Ou. February 2011.Corporate Default and Recovery Rates - 1920-2010. Moody’s Investors Service
26
Bloomberg at 29-05-2015
27
ܴ݈݁ܽܩܦܲ௪௧ =ൣ൫1 +݈ܰ݉݅݊ܽܩܦܲ௪௧൯∗ (1 +݂݈݅݊ܽݐ்݅݊)൧− 1
Table 8: EDP’s type of regimes – 2014
GWh % share
Ordinary Regime in Iberia
32.223 54%
Special Regime in Iberia
997 2%
Total EDP's Electricity Generation
60.220 100%
Figure 23
Source: Company Data
Figure 25 – Gross profit stability assured until 2017 (€Million)
Source: Company Data
0 200 400 600 800 1,000
L
ONG- T
ERMC
ONTRACTEDG
ENERATIONDuring many years, the generation of energy was performed under a strict regulatory framework which was characterized by the existence PPAs28. These agreements allowed the generation companies to have a steady flow of income, regardless of the volume of electricity which was produced. However, in the end of 2007 as the process of energy markets liberalisation began to accelerate, it was determined that the use of PPAs should come to an end. In order to compensate the generators, the Portuguese Government decided to create a new type of contract named CMEC mechanism29(see figure 23)
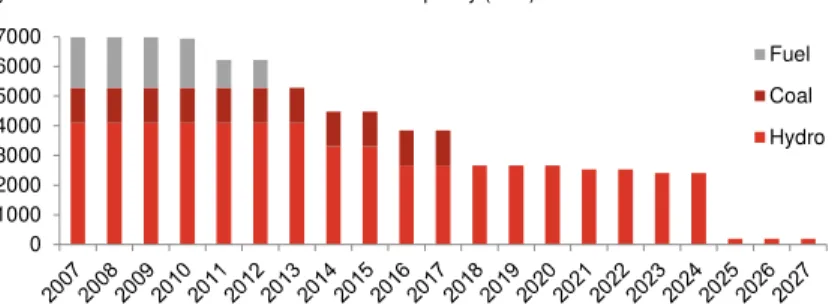
As the concessions working under this segment end, the power plants will be transferred to the liberalised generation segment. As it can be seen in figure 24, in the past years, the installed capacity in this segment has already started diminishing and in 2027 it will be residual (see more detail regarding the concession power plants in Appendix 3).
As it has been showed in the description of the compensation schemes, 2017 is the final period in which there is going to be an update of the variables used to calculate the remuneration generated by them. This means that between this year and 2027 there will not exist any revisions. In this sense, the remuneration scheme of this segment is going to be stable between 2017 and 2027, and 2017 is going to be a crucial year in terms of remuneration determination. The base CMEC has been revised downwards in €13 million30, changing the annual base CMEC from €81 million to €68 million from 2013 to 2027 as regards to the Memorandum of Understanding between IMF and the Portuguese authorities. This segment also includes the special regime generation. This regime corresponds to the generation of electricity through biomass, mini-hydro and
28
PPA – Power Purchase Agreement
29
CMEC – Cost with maintenance of contractual equilibrium
30
EDP Investor Day 2012. The decision was made since IMF believed that the market prices used in the contracts were too optimistic and did not reflect real market conditions.
Goal CMEC Mechanism
NPV of PPA is maintained
2 compensation schemes:
Annual GP revised from 2007-2017
Base CMEC=NPV PPA–NPV Market
GP in mkt >>
Forecasted ≠ Reality GP < Contract’s threshold ->
Reimbursment
GP > Contract’s threshold ->
Payment
In 2007
GP will be stable 2007-2017, however
No more adjustments to mkt from 2017 onwards
€0.8 billion
To be paid by all consumers until 2027
In 2017
update of market forecasts until 2027
Recalculation of additional CMEC
until 2027
Figure 24: PPA/CMEC: Evolution of Installed Capacity (MW) from 2007-2027
Source: “PPAs/CMECs Legislation Package”, Lisbon, February 16th, 2007 0
1000 2000 3000 4000 5000 6000 7000
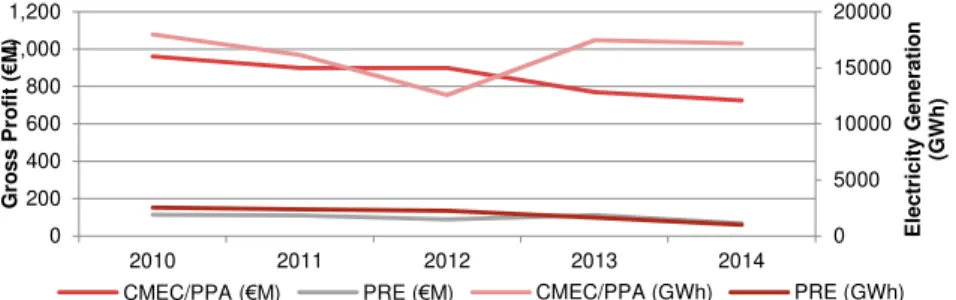
cogeneration31. The regulatory framework, which currently exists, allows this type of operators to sell electricity to last recourse suppliers that are obliged to purchase electricity from them and also to other suppliers in the market. As it can be seen in figure 26 this is not the sub-segment that gives the highest value, however it does not destroy it too. Hence, we think that it is not in PRE that EDP will tend to focus its growth.
As presented in “EDP Overview”, the EBITDA percentage of this segment was 15% in 1Q2015 but will decrease as the concessions will be transferred to other segment as will be shown below.
VALUATION
As it has already been mentioned in the previous section, as the concession contracts of the power plants operating end, they will be sequentially transferred to the liberalized generation segment. However, for valuation purposes of the segment it was assumed that from 2017 onwards, all the concessions will be transferred to the liberalized segment (since there will not exist any additional revisions of market conditions related to CMEC contracts). Since these concessions would still be receiving funds related with the CMEC base between 2017 and 2027, these funds were taken into account in the computation of the segment’s value.
The gross profit considered for the CMEC/PPA sub-segment was the one presented in figure 24 until 2017 and the base CMEC mentioned above until 2027. From 2017 onwards, the regulated generation segment will only be represented by the special regime. In order to estimate the gross profit of this segment, we took into consideration future load factors and installed capacity so that future Gross Profit/GWh could be estimated. Regarding the load factors, we believe that there is not any significant external factor, which may lead them to change
31
Biomass energy: by converting biomass into liquid fuels to produce combustible gases, or direct combustion produces heat. Cogeneration uses the heat of motor and power plants to generate electricity
Figure 26: Evolution of some metrics of the LT Contracted Generation segment
Source: EDP
0 5000 10000 15000 20000
0 200 400 600 800 1,000 1,200
2010 2011 2012 2013 2014
E
le
c
tr
ic
it
y
G
e
n
e
ra
ti
o
n
(G
W
h
)
G
ro
s
s
P
ro
fi
t
(
€
M
)
CMEC/PPA (€M) PRE (€M) CMEC/PPA (GWh) PRE (GWh)
Figure 27 – Evolution Gross profit with operating costs (€M)
Source: Company Data and Analyst’s estimates
-200 -180 -160 -140 -120 -100 -80 -60 -40 -20 0
0 200 400 600 800 1000 1200
Gross Profit Operating costs
Figure 28
Price is set
Absorve 1st PRE Production
MIBEL
Iberian Electricity Market
Producers in Iberia sell in the Iberian pool
Total Iberian demand
Total Demand satisfied??
YES NO
Energy sold ordered by marginal cost
Demand = Supply
Price is set
Source: Company Data
significantly due to the weight that PRE represents in EDP. For Gross Profit/GWh, we estimated them to be inflation updated for the future.
Regarding the operating costs32of the segment, since we are estimating them to be a percentage of the gross profit of the period, we assume that they will decrease from 2017 onwards, following the transference of power plants from this segment to the liberalized one (figure 27).
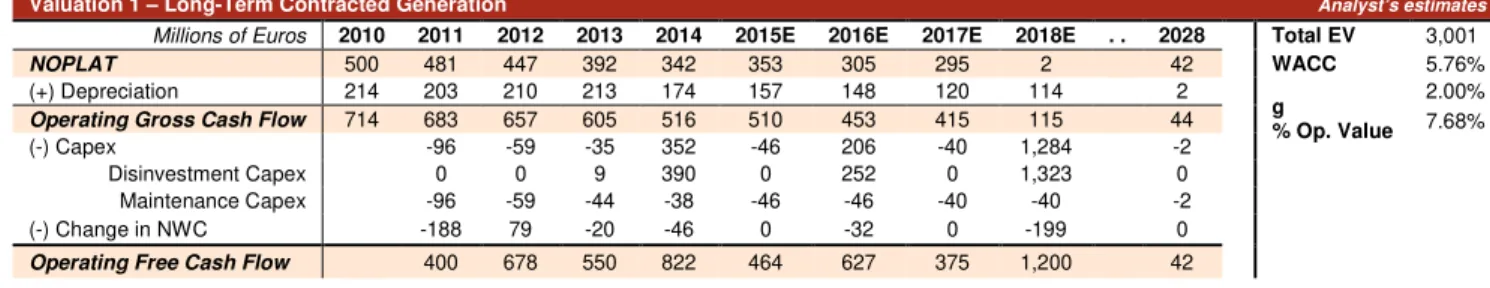
Regarding the level of capex, we estimated it to be essentially related to maintenance investments, which in the future will be lower as the installed capacity becomes lower (due to the power plants transference). Additionally, there will be disinvestments that correspond to “sales” to the liberalized segment that can be seen in detail in the segment valuation below:
Valuation 1 – Long-Term Contracted Generation Analyst’s estimates Millions of Euros 2010 2011 2012 2013 2014 2015E 2016E 2017E 2018E . . 2028 Total EV 3,001
NOPLAT 500 481 447 392 342 353 305 295 2 42 WACC 5.76%
(+) Depreciation 214 203 210 213 174 157 148 120 114 2
g
% Op. Value
2.00%
Operating Gross Cash Flow 714 683 657 605 516 510 453 415 115 44 7.68%
(-) Capex -96 -59 -35 352 -46 206 -40 1,284 -2 Disinvestment Capex 0 0 9 390 0 252 0 1,323 0 Maintenance Capex -96 -59 -44 -38 -46 -46 -40 -40 -2 (-) Change in NWC -188 79 -20 -46 0 -32 0 -199 0
Operating Free Cash Flow 400 678 550 822 464 627 375 1,200 42
L
IBERALISEDG
ENERATION(EXCLUDING WIND AND SOLAR)Out of all of EDP’s segments, the liberalized generation of electricity in Iberia excluding wind and solar is the one which has the highest growth in installed capacity. This growth is mainly focused on hydro-related projects and it is going to result on an installed capacity increase from 7,777 MW in 2014 to 13,705MW in 2018 in which hydro represents 52%. Looking at other segments of EDP it is possible to conclude that although Brazil has the second highest installed capacity (2.158MW in 2014) it is still not close from reaching the Iberia liberalized generation installed capacity. One of the main ideas behind the focus that is being given to hydro is to reap the benefits from low dependence on oil prices and also CO2emissions as already mentioned in the “Business Framework” section.
In the liberalized market, the price which producers receive is equal to a residual price and not an average market price (see figure 28).
As it can be seen in figure 29, in the past three years, variables costs33have been decreasing essentially due to decrease in generation costs34, which have decrease at a rate of 20% a year. The major energy source that has led to this decrease is the hydro generation costs that were €2.6/MWh followed directly by
32
In this report, when mentioning operating costs, we are referring to supplied and services, personnel costs, costs with social benefits and other operating costs (revenues)
33
Variable costs include fuel costs, CO2costs, hedging results, system costs 34
Figure 31 - Market shares in the Iberian Peninsula – Electricity Generation
Source: EDP
0% 10% 20% 30% 40% Endesa
Iberdrola EDP Gas Natural Others
2013 2012
low nuclear generation costs at€4.8/MWh. The nuclear and hydro energy sources are the ones which have the lowest generation costs due to the absence of CO2
emissions. These two sources of energy can be considered the most profitable ones contrary to CCGT and coal, which generation costs in 2014 were
€106.7/MWh and €38/MWh, respectively. Hence, if there is still demand to be satisfied in the pool, they are the last sources of energy to be called into. Additionally, it can be concluded that the average selling price35 of energy has been regular, which means that the gross profit has mainly been influenced by the generation costs. We will put more emphasis to this gross profit component.
Although EDP is currently increasing the installed capacity which is using to produce hydro energy, it is vital to analyze the load factor of this source of energy and compare it to load factor of other types of energy in order to understand the extent to which this capacity expansion can benefit the company. This variable varies, depending on the amount of load and the amount of time that the generator is operating, and it can be used as proxy to measure efficiency and generation costs.
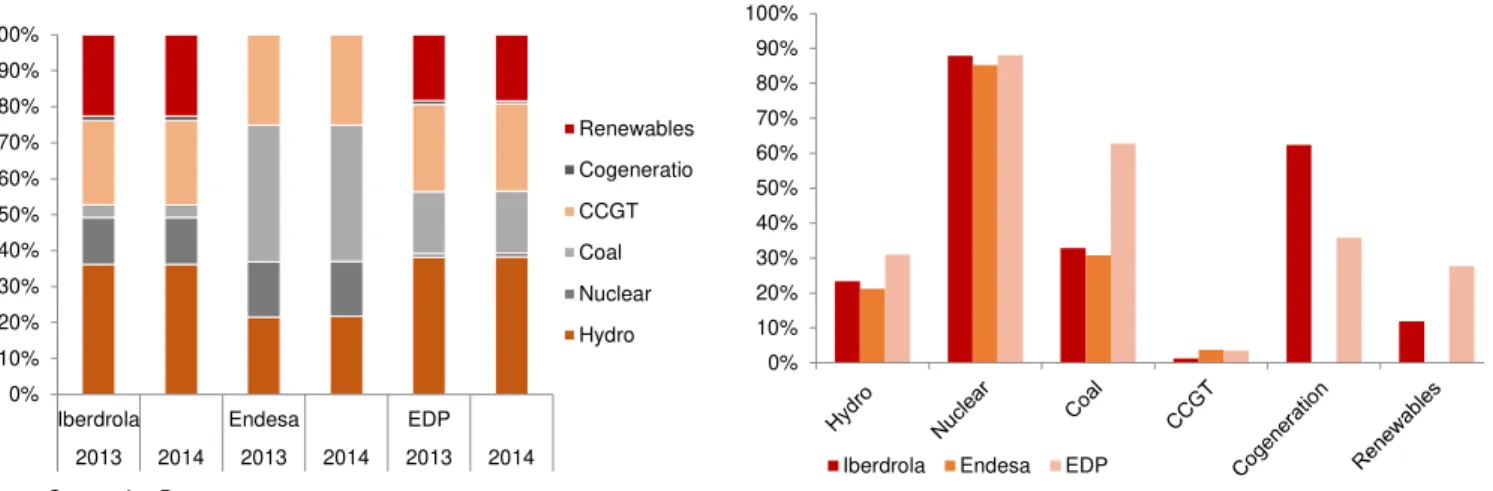
In order to understand how EDP’s investment in hydro can benefit the company (or not) in the near future, we think that it is necessary to make a comparison of load factors with its peers of the Iberian liberalized generation segment. In order to choose those peers, we looked for companies with similar relevance and market share in Iberia. The two chosen companies were Endesa and Iberdrola (figure 31). In the figures that are shown below (figure 32 and 33), it can be observed each company’s distribution of installed capacity over the different types of energy sources and also the value of the load factors for each type of energy. Only data from Portugal and Spain electricity generation was taken into consideration, both for EDP and its peers, since only the factors from the Iberia area can influence the generation of electricity of EDP in this area.
35
Average selling price includes selling price, ancillary services and others Figure 29 – Evolution of Gross Profit and its Components (€/MWh)
Source: Company Data
47.2 47.4 43.2
63 63.1 59.5
15.8 15.7 16.3
0 20 40 60
2012 2013 2014 Variable Cost Average Price Electricity Gross Profit Generation Output Electricity purchases Retail - final clients Wholesale market
Figure 30: Generation Costs
Source: Company Data
0 20 40 60 80 100
Figure 34: LCoE at 10% discount rate
Source: EIA
35 30 30 45 65 200
30 60 63
50
140 100
70
0 50 100 150 200 250
Minimum Maximum
Figure 35: Liberalized Generation in Iberia
Source: Company Data
0 5,000 10,000 15,000 20,000 25,000
0 200 400 600 800 1000
20102011201220132014
E
le
c
tr
ic
it
y
G
e
n
.
(G
W
h
)
E
B
IT
D
A
(
€
M
)
LT Contr. Gen. (GWh) Lib. Iberia (GWh) LT Contr. Gen. (€M) Lib. Iberia (€M)
As it can be seen in the figure, the energy source which has the highest load factor (independently of the installed capacity), is the energy produced in nuclear power plants. As it was already mentioned, this is due to the fact that nuclear power plants only stop its operations for operating maintenance. On the other hand, despite the high percentage of installed capacity of Iberdrola and EDP in hydro, the load factor achieved in 2014 was approximately 25%, mainly due to the dependence of these plants on weather conditions.
As already mentioned, EDP is focusing its growth in hydro capacity as it is going to be analyzed below in the valuation part. In order to conclude if EDP’s plan of future generation mix is optimal, we will make an analysis by looking at the levelized cost of energy (LCoE)36which can be used to conclude regarding future investments (figure 34). One could conclude looking at the results in the figure that coal, gas and nuclear are energy sources that EDP should invest into, however one cannot forget that the estimations are very sensitive to prices’ evolution (fuel inputs) and its components. Hence coal is the energy source that it is more sensitive to CO2and oil prices followed by gas. Consequently, the energy source
that will be optimal to use will vary over time. However, as it is going to be explained later, we do not think that oil prices will decrease more than what they have already reached, as well as CO2 costs will increase. In this perspective, we
think that in the future, EDP’s growth target in hydro technology will impact positively its results.
Finally, we can see that the liberalized generation segment is still below LT contracted generation segment’s EBITDA as well in electricity generation (figure 35) however it can also be seen the effect of transference of assets from one
36
LCoE give us the average unit cost/MWh that results in the ration between the PV of the total costs of a generation plant over the PV of the amount of electricity that is expected to the power plant to generate over its lifetime
Figure 33 – Iberian Load Factors of EDP and its Peers (2014) – Percentage
Source: Companies Data
0% 10% 20% 30% 40% 50% 60% 70% 80% 90% 100%
Iberdrola Endesa EDP Figure 32: Iberian Installed Capacity (MW) of EDP and its Peers (2013 and
2014) – IEnergy Source Percentage
Source: Companies Data
0% 10% 20% 30% 40% 50% 60% 70% 80% 90% 100%
Iberdrola Endesa EDP 2013 2014 2013 2014 2013 2014
Figure 36: Forecast of Crude Oil prices
Source: “Commodity Markets Outlook –
World Bank Group – January 2015 0
20 40 60 80 100 120
$
/b
b
l
Figure 37: EDP’s CCGT energy source
Source: Company Data
0% 10% 20% 30% 40% 50%
0 20 40 60 80 100 120 140
2009 2010 2011 2012 2013
%
€
/M
W
h
Load factor Generation cost
CO2 costs Oil price
Figure 38: EDP’s Coal energy source
Source: Company Data
0% 10% 20% 30% 40% 50% 60%
0 20 40 60 80 100 120 140
2009 2010 2011 2012 2013
%
€
/M
W
h
Load factor Generation cost
CO2 costs Oil price
segment to the other as the electricity generation and EBITDA is increasing in the liberalized segment and will continue to increase in the future as will be shown below.
VALUATION
In order to make a valuation of EDP’s liberalized generation segment, we need to take into consideration the following key drivers: load factors, generation costs (€/MWh), market selling price (€/MWh), future capex (both expansion and maintenance capex) and operating costs.
We will start by estimating generation costs since the results of the load factors will depend on the hierarchy of the various energy sources. Firstly, we think that hydro generation costs will only depend on inflation, since this energy source is CO2 free
and does not depend on oil prices. We considered the target inflation for the Eurozone, i.e. 2%. Regarding nuclear generation costs, we assumed not only that they will increase with inflation but as well as with an additional penalty in the future following the Fukushima event in 2011 (as it was already mentioned before). It is very likely that in the near future the Spanish government intends to include regulatory requirements for nuclear safety, which we estimate to negatively affect the cost of electricity generated from nuclear sources in 7%37.
Regarding coal and CCGT generation costs, we think that the factors that will influence this energy sources are the CO2 prices and oil costs. As EC predicts, we
expect carbon prices to rise to €39/tCO238 until 2028 as already mentioned.
Regarding oil prices, we took into consideration the percentage change in the forecasts of crude oil, average spot ($/bbl) (see figure 36). As it can be seen in figures 37 and 38, with the decrease in CO2 costs and oil prices, the coal’s
generation costs increased slowly and its load factors also increased. By contrast there was a sharp decrease in CCGT’s load factors and sharp increase in its generation costs. As we believe that oil and CO2costs will increase, we believe that
this tendency will reverse, hence we expect an increase in the load factors of CCGT and a decrease in the ones of coal compared from the past.
It is also necessary not only to look at the value of this variable for different types of energy sources but also to analyze new investments from other companies from the sector. As it was already seen, the energy source which creates a disadvantage for EDP is the nuclear energy. Although this energy has the highest load factor, EDP currently almost does not produce it, which means that if in the future its competitors increase the use of this type of energy, they could create a negative
37
Source: “Spain Power Report – Q2 2015” – Business Monitor International. Page 23
38
Table 9: EDP’s Hydroelectric structure
Power
plant Constr Start MW
Capex
(€M)
New hydro power plant
Baixo
Sabor 2008 2014 171 625,3
Ribeira dio Ermida
2010 2014 81 213,3
Foz
Tua 2011 2016 252 370
Repowering of existing hydro plants
Venda
Nova II 2009 2015 746 322,5
Salam
onde II 2010 2015 207 200
Source: info from
www.a-nossa-energia.edp.pt/
Figure 39: Segment’s evolution
Source: Analyst’s estimates
0 100 200 300 400 500 600 700 800 900
0 5,000 10,000 15,000 20,000 25,000 30,000
EBITDA (€M) MW GWh
impact for EDP. After analyzing the investment plans of Iberdrola and Endesa for the following years, we have come to the conclusion that neither of this companies intends to change the current profile of their installed capacity in Iberia. Iberdrola ended the ongoing projects in Spain and will be focusing its future growth in Mexico, namely, in the renewable sector. Likewise, Endesa is now channeling its growth investments into Latin America.
Regarding hydro and nuclear load factors, we believe that they will not have a significant variation in the future. In what concerns nuclear energy, due its low generation costs and high priority in the Iberian pool, a load factor of 88%, similar to the one which was observed in the past, was considered. Given the fact that in the near future, there are not relevant climatic changes predicted relatively to the weather in Iberia, for hydro, it was considered a load factor of 25% also in line with what was observed in the past.
As already mentioned in the “Macroeconomic Context” section, Spain and Portugal will experience an increase in its GDP and hence we think that for the Iberia market, selling price increase will be aligned with the target inflation for Eurozone, i.e 2%. The value of capex in the future was determined by taking into consideration the funds needed to construct new hydro plants plus the repowering and maintenance needs of older plants. EDP recently entered into 5 hydro projects in order to increase its hydro installed capacity. (See table 9).
Taking into consideration information relative to past hydro projects and data taken from peers, we reached an average capex of €2.59/MW for building new hydro plants, and €0.70/MW for the repowering of existing ones. Additionally, we estimated an average time for concluding the projects of 5 years, which results on a total capex of €1,972 million, different from the €1,731 million initially expected by EDP. Since the projects are in its final stage, we needed to take into consideration the money already spent in them, which is equal to €1,825 million by 2014. This means that a residual annual expansion capex of€74 million is going to be spent in 2015 and 2016. The maintenance capex was calculated by taking into consideration past costs of installed capacity increases or decreases. Additionally, in 2018, when all the assets from the PPA/CMEC system enter in the liberalized generation segment, we think that EDP will need to make an external maintenance capex in order to compensate for the seniority of most of the hydroelectric power plants (see Appendix 3). A hydroelectric power plant can have a useful life between 30 to 75 years39. We assumed that power plants with more than 35 years will be subject to an extra capex that have the same characteristics of repowering a hydro plant. This means that there is going to exist an annual capex of€207 million until 2022. From
39
2022 onwards, we estimate that maintenance capex will meet the annual depreciation.
Finally, we estimate the operating costs to increase accordingly to the gross profit, except for personnel costs which are going to be dependent on the number of employees. As the gross profit is somehow dependent on the installed capacity, the operating costs are evolving according to the unit’s total installed capacity.
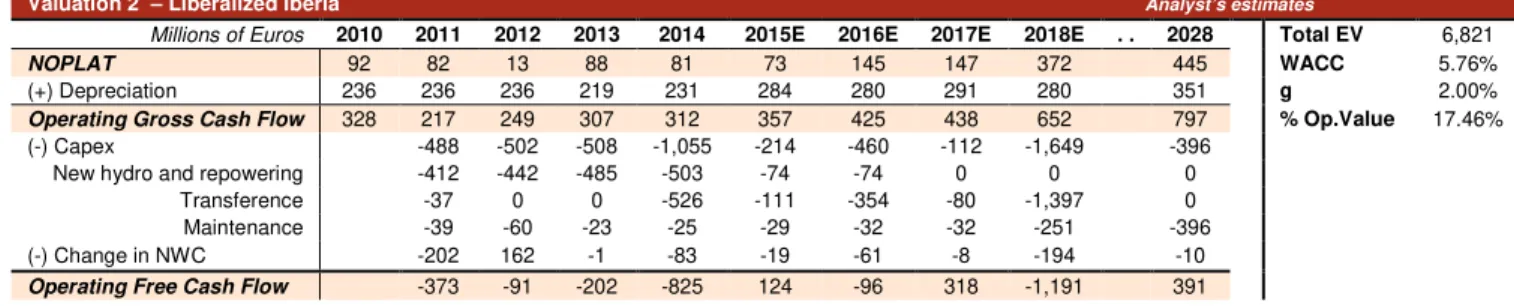
Valuation 2 – Liberalized Iberia Analyst’s estimates
Millions of Euros 2010 2011 2012 2013 2014 2015E 2016E 2017E 2018E . . 2028 Total EV 6,821
NOPLAT 92 82 13 88 81 73 145 147 372 445 WACC 5.76%
(+) Depreciation 236 236 236 219 231 284 280 291 280 351 g 2.00%
Operating Gross Cash Flow 328 217 249 307 312 357 425 438 652 797 % Op.Value 17.46% (-) Capex -488 -502 -508 -1,055 -214 -460 -112 -1,649 -396
New hydro and repowering -412 -442 -485 -503 -74 -74 0 0 0 Transference -37 0 0 -526 -111 -354 -80 -1,397 0 Maintenance -39 -60 -23 -25 -29 -32 -32 -251 -396 (-) Change in NWC -202 162 -1 -83 -19 -61 -8 -194 -10
Operating Free Cash Flow -373 -91 -202 -825 124 -96 318 -1,191 391
E
LECTRICITY
S
UPPLY IN
I
BERIA
EDP’s segment related with the supply of electricity is divided in two different sub--segments, last resource supply (LRS) which is regulated and liberalized supply. These operations are made both in Portugal and Spain. Figures 40 and 41 show the market share of the most important electricity supplying companies in Spain and Portugal, respectively. As it can be seen, in Spain, EDP has the fifth largest market share, and in Portugal it is the market leader followed by Endesa and Iberdrola.
In figure 42 it is possible to observe that out of the top 4 Iberian electricity supplying companies, EDP is the one in which the value of electricity supplied under the regulated regime is higher, when compared to the value of electricity supplied to the liberalized market. This can be seen as a direct result of the fact that in Portugal, the liberalization process is in an earlier stage when compared to Spain. However, the supply of energy under the LRS regime will not continue after the end of 2015, which means that in the near future, the value of electricity supplied under this regime will become residual.
The fact that the liberalization process is in a different stage in Portugal and Spain is accurately illustrated by figure 43.
Figure 42: Iberian supply of electricity (liberalized vs. regulated) among EDP and its competitors - 2013
Source: EDP
0% 10% 20% 30% 40% Endesa
Iberdrola EDP Gas Natural Fenosa
Other Electricity Free Retail Electricity Regulated Retail
Figure 41: Market share of electricity supply – Portugal – 2014
Source: ERSE
EDP. Com 46%
Endes a 19% Iberdr
ola 16%
Others 12%
Galp 7%
Figure 40: Market share of electricity supply – Spain - 2014
Source: CEER
Endesa 32%
Iberdrol a 20% Others
20% GNF 17%
EDP 8%
E.ON 3%
Figure 43: Market Share of electricity supply
Source: EDP
0% 20% 40% 60% 80%
Figure 44: Behavior of electricity sold and of nº of clients – Portugal
Source: EDP
0 500 1000 1500 2000 2500 3000 3500
0 5000 10000 15000 20000
2009 2010 2011 2012 2013 2014 Volume sold (GWh) Clients (th)
Figure 45: Behavior of electricity sold and of nº of clients – Spain
Source: EDP
0 200 400 600 800 1,000
0 5,000 10,000 15,000 20,000 25,000
200920102011201220132014 Volume sold (GWh) Clients (th)
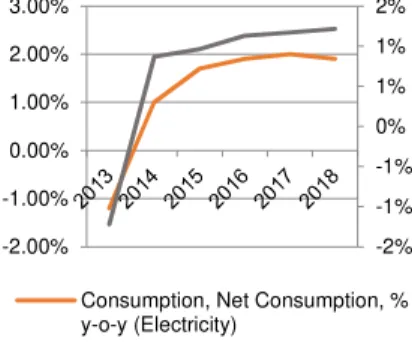
Figure 46: Behavior of electricity consumption with GDP growth
Source: GDP growth (by IMF); Consumption growth(by “Spain Power Report Q2 2015 – BMI
-2% -1% -1% 0% 1% 1% 2%
-2.00% -1.00% 0.00% 1.00% 2.00% 3.00%
Consumption, Net Consumption, % y-o-y (Electricity)
GDP growth
As it can be observed, the market share of EDP in Spain has been fairly stable in this country for the past 5 years, due to the fact that the market is already mature. In contrast, in 2010 and 2011, EDP’s Portuguese market share suffered a significant decrease, which was caused by the acceleration of the liberalization process. In this country, as costumers started to make their transition from the regulated market to the liberalized one, they became much more sensitive to the price and in many cases opted to change their supplier of electricity.
It is interesting to note that the evolution of the number of clients in Spain and Portugal follows a very similar behavior exhibited by the evolution of volume sold. By observing figures 44 and 45, which shows the evolution of these variables in the liberalized market, it is possible to conclude once again that the supply of electricity under this regime is considerable more mature in the Spain (less volatility).
VALUATION
In order to perform the valuation of this segment, the following key drivers were taken into account: market share, electricity demand growth, Gross Profit/MWh and capex.
Regarding the market share, electricity supply in Spain has an historic market share which is close to 10%. As it has already been seen, the segment in this country can be considered mature, which means that in the future there will not exist relevant changes on this variable. For Portugal, although the market share of EDP has decreased significantly since 2009, we believe that there has been stabilization around 44% in the past two years, which will be maintained in the future as most of the costumers, which wanted to change from EDP to other operators, probably have already done so between 2010 and 2012 (see figure 44). Concerning electricity demand for the future, we can see in figure 46 that the estimates made for this variable are positively correlated with the GDP growth. In this sense, to determine the Portuguese demand for electricity in the future we use the estimates of GDP growth published by IMF for this country (Appendix 2). We used these estimates for Portugal, due to the fact that it was not possible to find reliable estimates of electricity demand growth in the future. Regarding Spain, the future demand for electricity was taken from a report published by Business Monitor, which analyzes the future electricity consumption in this country.
RoRAB =
WACC(pre-tax)
. CPI measured by inflation
. Efficiency factor set by regulators
Updated each year by a price cap mechanism
(CPI – X):
Allowed Return Controllable costs Regulated Revenues
Depreciation + OPEX RAB x RoRAB
was to update them to inflation for the future years. The gross margins observed in past periods have been regular and situated around €12/MWh in Portugal and
€6/MWh in Spain.
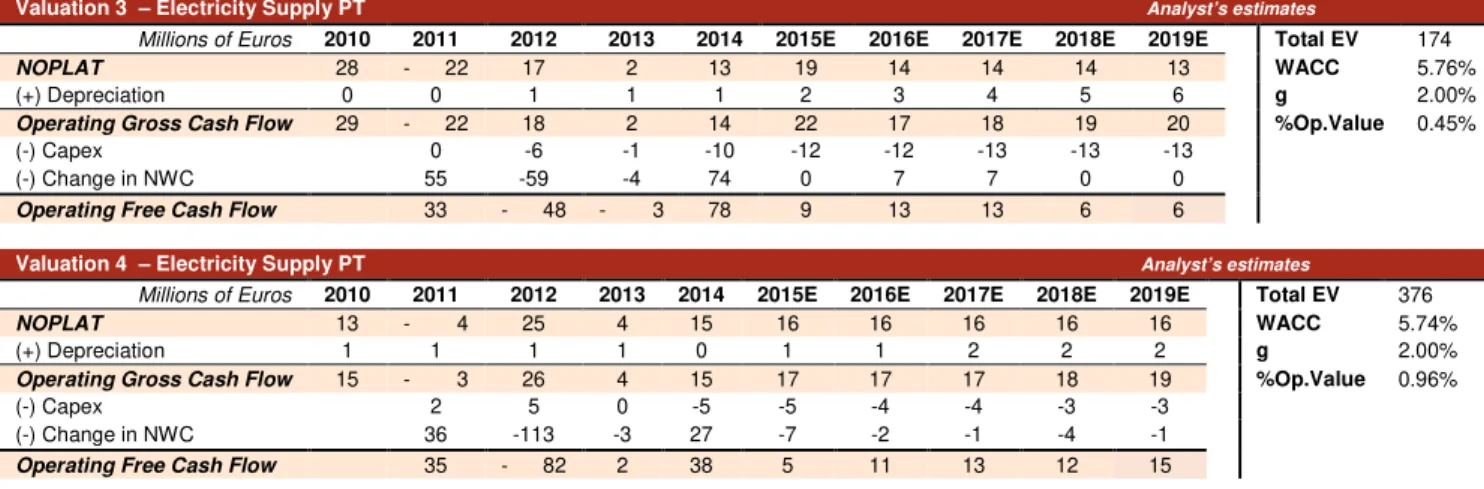
Regarding the Capex, we do not expect major investments since this is not a capital intensive segment, and its investments are essentially allocated to devices used to measure electricity. We expect this variable to be represented only by maintenance capex. As it can be seen by the result yielded by the valuation, this segment is the one which has the lowest contribution to EDP’s overall value.
Valuation 3 – Electricity Supply PT Analyst’s estimates
Millions of Euros 2010 2011 2012 2013 2014 2015E 2016E 2017E 2018E 2019E Total EV 174
NOPLAT 28 - 22 17 2 13 19 14 14 14 13 WACC 5.76%
(+) Depreciation 0 0 1 1 1 2 3 4 5 6 g 2.00%
Operating Gross Cash Flow 29 - 22 18 2 14 22 17 18 19 20 %Op.Value 0.45%
(-) Capex 0 -6 -1 -10 -12 -12 -13 -13 -13 (-) Change in NWC 55 -59 -4 74 0 7 7 0 0
Operating Free Cash Flow 33 - 48 - 3 78 9 13 13 6 6
Valuation 4 – Electricity Supply PT Analyst’s estimates
Millions of Euros 2010 2011 2012 2013 2014 2015E 2016E 2017E 2018E 2019E Total EV 376
NOPLAT 13 - 4 25 4 15 16 16 16 16 16 WACC 5.74%
(+) Depreciation 1 1 1 1 0 1 1 2 2 2 g 2.00%
Operating Gross Cash Flow 15 - 3 26 4 15 17 17 17 18 19 %Op.Value 0.96%
(-) Capex 2 5 0 -5 -5 -4 -4 -3 -3 (-) Change in NWC 36 -113 -3 27 -7 -2 -1 -4 -1
Operating Free Cash Flow 35 - 82 2 38 5 11 13 12 15
E
LECTRICITY
D
ISTRIBUTION IN
I
BERIA
This segment is responsible for the distribution of electricity under the regulated market in Portugal and Spain and its impact on EBITDA in 2014 was 19% and 3% respectively. In Portugal, EDPD40 owns approximately 99% of the electricity distribution network in the mainland (223,523 Km in 2014), and is regulated by ERSE41. In Spain, HC Energía 42 owns a network of 23,395 Km (data for 2014) and distributes electricity mainly to Asturias and, to a lower length, also to Madrid, Valencia, Alicante, Huesca, Zaragoza, and Barcelona. The regulation of electricity distribution in this country is performed by CNE43.
The remuneration of EDP’s distributing activities is dependent on two relevant factors (see figure 47). The return on the regulatory asset base (RoRAB) is established by ERSE and CNE and is applied in the assets that EDP employs to distribute electricity (RAB). The return is established for periods of three years for Portugal and four years for Spain. The most recent regulatory period starts in 2015 and is going to end on 2017 for Portugal and in Spain we are in the middle of the regulatory period 2013-2016.
40
EDPD – EDP Distribuição is responsible for electricity distribution in Portugal.
41
ERSE is responsible for defining the tariffs, parameters and prices of electricity while at the same time safeguarding the levels of quality and service required by DGGE - Direcção Geral de Geoglogia e Energia.
42
HC Energía is the responsible for the distribution of electricity in the regulated and unregulated market in Spain.
43
CNE, as in the case of ERSE is also responsible for defining the main parameters that rule the distribution activities but in this case for Spain. Figure 47: RAB-based regulatory formula