Inclusion of South American samples reveals new population structuring
of the blacktip shark (
Carcharhinus limbatus
) in the western Atlantic
Davidson Sodré
1, Luis F.S. Rodrigues-Filho
1, Rosália F.C. Souza
2, Péricles S. Rêgo
1, Horacio Schneider
1,
Iracilda Sampaio
1and Marcelo Vallinoto
1,31
Laboratório de Genética e Biologia Molecular, Instituto de Estudos Costeiros,
Universidade Federal do Pará, Bragança, PA, Brazil.
2Universidade Federal Rural do Pará, Belém, PA, Brazil.
3
Centro de Investigação em Biodiversidade e Recursos Genéticos, Universidade do Porto, Vairão, Portugal.
Abstract
Carcharhinus limbatus has a cosmopolitan distribution and marked genetic structuring, mainly because of its philopatric behavior. However, analysis of this structuring has not previously included South American populations. In the present study, we analyzed a sample of adult individuals collected on the northern coast of Brazil and com-pared the sequences of the mitochondrial control region with those of populations already genotyped. Relatively high haplotype diversity (12 haplotypes, genetic diversity of 0.796) was observed, similar to that in other populations but with a much larger number of private alleles. In contrast to populations studied previously, which were represented by neonates, the pronounced allelic variability found in the South American individuals may have resulted from mi-grations from other populations in the region that have yet to be genotyped. This population was also genetically dis-tinct from the other Atlantic populations (Fst> 0.8), probably because of female philopatry, and apparently separated from the northwestern Atlantic group 1.39 million years ago. These findings indicate that theC. limbatus population from northern Brazil is genetically distinct from all other populations and should be considered as a different manage-ment unit for the protection of stocks.
Key words: Carcharhinus limbatus, control region, fishery stocks, mitochondrial DNA, population genetics.
Received: January 13, 2012; Accepted: May 24, 2012.
Introduction
Sharks are vulnerable to overexploitation by fisheries because of their low fecundity and slow maturation (Mu-sicket al., 2000; Myers and Worm, 2005; Tsaiet al., 2010; Tillettet al., 2011) and their limited potential for recruit-ment. This combination of traits has resulted in a sharp de-cline in populations in many parts of the world (Baum and Myers, 2004; Bradshawet al., 2008; Ferrettiet al., 2010). Given these considerations, the effective management of shark species should also consider good knowledge of the ecological characteristics and population structure of cur-rent stocks (Vaudo and Heithaus, 2009). Identification of the genetic structuring of populations is fundamental for determining whether and to what degree reproductive isola-tion exists, and can identify subpopulaisola-tions that need to be treated as separate management units (Palsboll et al., 2007). The lack of information on the migration and disper-sion patterns of sharks and the difficulties in obtaining an
adequate sample of the distribution of a species hinder the evaluation of fishery stocks and potentially contribute to the application of management policies that are incompati-ble with the biological characteristics of each species, lead-ing to possible overexploitation of stocks (Feldheimet al., 2001; Hueteret al., 2004; Goreet al., 2008).
The large populations, ample geographic distribution and dispersal capacity of many marine species, together with the general lack of physical barriers to dispersion in the world’s oceans, all contribute to long-distance gene flow, characterized by a reduced genetic structuring of pop-ulations (Palumbi, 1994; Wardet al., 1994; Rosenbaumet al., 2009). This is emphasized by the fact that only a few migrants are needed per generation to avoid the effects of genetic drift, which results in segregation of the genetic characteristics of populations at different localities (Wa-ples, 1998). On the other hand, traits such as the lack of mo-bile larvae or philopatric behavior may limit gene flow and result in the genetic divergence of populations of marine or-ganisms, even when they have a continuous distribution (Meylanet al., 1990).
Genetics and Molecular Biology, 35, 4, 752-760 (2012)
Copyright © 2012, Sociedade Brasileira de Genética. Printed in Brazil www.sbg.org.br
Send correspondence to Marcelo Vallinoto. Laboratório de Gené-tica e Biologia Molecular, Instituto de Estudos Costeiros, Univer-sidade Federal do Pará, Al. Leandro Ribeiro s/n, 68600-000 Bra-gança, PA, Brazil. E-mail: [email protected].
The blacktip shark,Carcharhinus limbatus, has a cos-mopolitan distribution, and is typically found in tropical and subtropical coastal waters (Compagnoet al., 2005). In the western Atlantic, the species is found from Massachu-setts to southern Brazil (Compagno, 1984). This shark is highly mobile, being able to travel distances of over 2,000 km, and migrates seasonally (Kohleret al., 1998; Carlson and Brusher, 1999).
The blacktip shark uses shallow coastal waters as nurseries where the juveniles spend the first few months of their lives (Hueteret al., 2005). These areas are normally relatively productive, with abundant dietary resources, and are also well protected from predators (Simpfendorfer and Milward, 1993; Heupelet al., 2004; Heupelet al., 2007; Faunce and Layman, 2009; Heupel and Simpfendorfer, 2011). An analysis of the genetic structure of different nurs-eries of C.limbatus in North America revealed that the females do not disperse randomly but are philopatric, re-turning to reproduce in the nurseries where they were born. This behavior can lead to marked genetic heterogeneity among nurseries (Keeneyet al., 2003).
Genetic structuring has been recorded among nurser-ies ofC. limbatusin North America, the Gulf of Mexico and the Caribbean (Keeney et al., 2005). These authors concluded that females copulate with males from different regions and then return to their natal nurseries to breed. In addition to this local structuring, a global analysis by Kee-ney and Heist (2006), which included new samples from Africa and the Indo-Pacific region, demonstrated pro-nounced structuring between these populations and those
of the eastern Atlantic. However, this analysis did not in-clude any South American populations.
AlthoughC. limbatusis common along the coast of Brazil, little is known about its population structure or re-productive behavior in this region. The occurrence of preg-nant females and juveniles off the coast of the Brazilian states of Rio Grande do Norte and Paraná indicates that nurseries exist in these areas (Yokota and Lessa, 2006; Bornatowski, 2008).
In the present study, sequences of the control region of mitochondrial DNA were analyzed to evaluate the ge-netic variability in C.limbatus on the northern coast of Brazil. The data were also used to assess the degree of di-vergence in relation to other populations (Keeney et al., 2003, 2005) and the possible existence of distinct genetic lineages within the geographic distribution of the species.
Materials and Methods
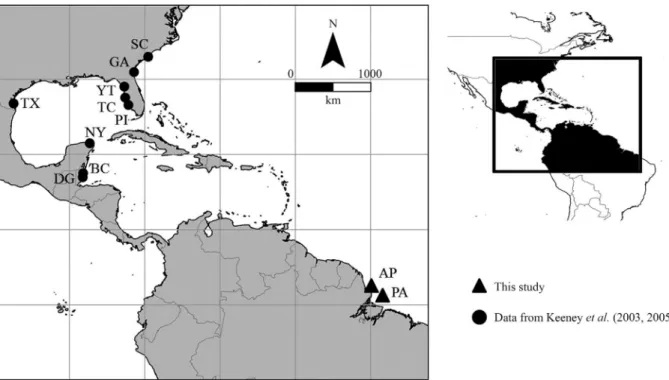
The specimens of C. limbatus analyzed were all adults collected during a boat expedition on the coast of the Brazilian states of Pará (0°28’38.82” N, 48°18’55.38” W) and Amapá (01°31’56.8” N, 49°42’14.1” W) and were identified based on Compagno (1984) (Figure 1). A sample of muscle tissue was extracted from each specimen and stored in 95% ethanol at -20 °C. Total DNA was extracted using a standard protocol (Sambrooket al., 1989) in which the tissue was digested with ribonucleases for 40 min at 37 °C and then dissolved in a solution of SDS and pro-teinase K at 55 °C. The material was subsequently washed
in phenol-chloroform and precipitated with sodium acetate and isopropanol. The resulting total DNA was hydrated and frozen.
The control region of the mitochondrial DNA of 25 specimens ofC.limbatuswas amplified using the polymer-ase chain reaction (PCR). The primers and the amplifica-tion protocol used were described by Keeneyet al.(2003). The PCR products were purified using an ExoSAP-IT kit (Amersham Pharmacia Biotech. Inc., UK) and then se-quenced using the dideoxynucleotide method (Sanger et al., 1977) with a Big Dye reagent kit (ABI PrismTM Dye Terminator Cycle Sequencing Ready Reaction; Applied Biosystems, Foster City, CA, USA). The sequences were aligned automatically with CLUSTAL W (Larkinet al., 2007) run in the BIOEDIT sequence editor (Hall, 1999), for visual inspection and possible corrections. The nucleotide composition, number of transitions and transversions were calculated using MEGA 4.0 (Tamuraet al., 2007).
Genetic (H) and nucleotide (p) diversity indices were determined with ARLEQUIN 3.1 (Excoffieret al., 2005). Pairwise genetic divergence between populations was esti-mated by Fst(Excoffieret al., 1992), with the significance being tested by 1000 permutations. Analysis of molecular variance (AMOVA), run in ARLEQUIN 3.1, was used to assess the genetic variability among populations. For this, the data provided by Keeneyet al.(2003, 2005) and Kee-ney and Heist (2006) were added to those collected during this study. The data from previous studies were grouped into seven populations [BC – Belize City, Belize; DG – Dangriga, Belize; EA/IP – eastern Atlantic/Indo-Pacific (Africa, India, Australia, Philippines, Hawaii, USA); EG – eastern Gulf of Mexico (Pine Island, Terra Ceia and Yan-keetown, USA); NA – northwestern Atlantic (South Caro-lina and Georgia; USA); NY – northern Yucatan (Laguna Yalahau northern Yucatan; Mexico); WG – western Gulf of Mexico (Padre Island, USA)], in addition to the northern Brazilian samples (Table 1). The haplotype network was constructed using the median joining (MJ) method in the NETWORK program, version 4.0 (Bandeltet al., 1999).
Fu’s Fs neutrality test (Fu, 1996) was applied in ARLEQUIN 3.1 to assess possible deviations from neutral-ity and provide inferences on the demographic history of the samples analyzed. The mismatch distribution (Rogers and Harpending, 1992) was constructed in DNAsp 5.0 (Librado and Rozas, 2009). The coalescence approach available in LAMARC 2.0 (Kuhner, 2006) was used to esti-mate demographic parameters such as the exponential growth rate (g) and theqparameter. The estimates were based on runs of 2,000,000 steps, sampled at every 100 gen-erations, with 10% of the samples discarded as burn-in. The results were evaluated using TRACER v. 1.4 (Rambaut and Drummond, 2007).
Divergence between populations was estimated using PAUP*, version 4.0b10 (Swofford, 2003), based on the evolutionary model chosen according to the Akaike
crite-rion, as determined by jModelTest (Posada, 2008). To esti-mate the divergence time between samples, we followed the approach of Keeney and Heist (2006), who assumed that the eastern Atlantic/Indo-Pacific and northwestern At-lantic were isolated from one another by the rise of the Isth-mus of Panama (3.2 million years ago – Mya) to arrive at a mutation rate of 0.43% per million years.
Results
Sequences of the control region 1067-1070 base pairs in length were obtained for 25 specimens ofC.limbatus. Thirteen polymorphic sites were identified, nine of which were transitions, with one transversion and three dele-tions/insertions that resulted in 12 haplotypes (GenBank access number JX025760-71); the most common haplotype was found in 11 individuals (Table 1). Haplotype diversity was relatively high (H = 0.7967), whereas nucleotide diver-sity was low (p = 0.0021). These values were consistent with those reported for other populations and nurseries of
C.limbatusand other shark species (Table 2).
With regard to population structuring, the Fstvalues (data not shown) between the western Atlantic populations analyzed by Keeneyet al.(2005) and the Brazilian samples were high (> 0.80) and significant, effectively the largest observed. The arrangement that included the six western Atlantic groups analyzed by Keeneyet al.(2005) (northern Atlantic, eastern Gulf of Mexico, western Gulf of Mexico, northern Yucatan, Belize City and Dangriga) and the Bra-zilian samples was tested using AMOVA (only samples from the western Atlantic were used here because of the small number of individuals in the samples from the other populations). This analysis indicated that around 60% of the total variation (Fct= 0.6064, p < 0.05) derived from that between groups, while the remaining 40% (Fst= 0.6008, p < 0.05) resulted from variation within populations. Varia-tion between populaVaria-tions of the same group was not signifi-cant (Fsc= -0.0143, p > 0.05).
A plot of the mismatch distribution that included all of the samples genotyped worldwide (Keeneyet al., 2003, 2005; Keeney and Heist, 2006) and the Brazilian samples resulted in a multimodal curve (Figure 2A) that could be ac-counted for by structuring of the different groups of haplo-types. However, when only the western Atlantic samples were included, the curve was bimodal (Figure 2B), indicat-ing the existence of two groups of haplotypes that corre-sponded to the populations genotyped by Keeney et al.
(2003, 2005) and the Brazilian samples, respectively. This finding further emphasized the differentiation of these two groups.
The unimodal curve obtained for the Brazilian sam-ples (Figure 2C) suggested a process of expansion (Slatkin and Hudson, 1991; Rogers and Harpending, 1992). This conclusion was supported by the sum of the squared devia-tions, which did not reject this hypothesis (0.0117,
et
al.
755
haplotype was observed. Nucleotides identical to haplotype 1 are indicated by dots (BC – Belize City; BR – northern Brazil; DG – Dangriga; EA/IP – eastern Atlantic/Indo-Pacific; EG – eastern Gulf of Mexico (Pine Island, Terra Ceia and Yankeetown); NY – northern Yucatan (Laguna Yalahau northern Yucatan); WA – western Atlantic (Bulls Bay and Georgia); WG – western Gulf of Mexico (Padre Island)). Note that the different haplotype groups are shaded in different tones of gray.
Hap Nucleotide position N Population
1 2 3 5 8 1 1 1 2 2 3 3 3 3 3 3 4 4 5 5 5 5 6 6 7 7 7 7 8 8 9 1 1
8 5 7 3 8 3 4 5 0 8 0 2 4 6 7 7 7 7 4 5 7 9 2 8 5 5 6 7 2 4 1 0 0
9 4 0 8 0 6 4 5 8 8 9 2 3 9 0 3 3 7 6 6 7 0 7 6 5 1 5 5
4 5 WA EG WG NY BC DG EA/IP BR
H1 T C A T T T C A C A T G T A T A C G G A A - C A A G A T G T A - A 125 35 53 14 23
H2 . . . C . . . . - . . . C . - . 52 12 34 6
H3 . . . C . . . . - . . . C . - G 21 15 6
H4 . . . C . . . C . . . . - . . . C . - . 1 1
H5 . . . C . . . . - . . . C - - . 29 11 13 5
H6 . . . T . . . C . . . . - . . . C - - . 17 4 7 6
H7 . . . A . . . C . . . . - . . . - . 3 3
H8 . . . . C . . . C . . . . - . . . C - - . 1 1
H9 . . . C . . G . - . . . - . 4 4
H10 . . . C . . G . - . . . C . - G 13 2 11
H11 . . . A . . . . C . . . . - . . . - . 2 2
H12 . . . C . . . . - . . . C . C . - G 3 3
H13 . . . C . . . . - . . . - G 2 2
H14 . . . T . . . C . . . . G . . . C . - . 1 1
H15 . . . A . C . . . . G . . . C . TA G 9 8 1
H16 . . . T . . . A . C . . . . G . . . C . TA G 5 5
H17 . . . T . . G . . . C . . . . G . . . C - - . 1 1
H18 . . . C . . G . G . . . - G 1 1
H19 . . . T . . . C . . G . G . . . C - - . 1 1
H20 . T . . . C . . . . G . . . C - - . 1 1
H21 . . . A . C . . . . G . . . TA G 16 7 9
H22 . . . T . . . A . C . . . . G . . . TA G 12 2 10
H23 . . . A . C . . G . G . . . TA G 3 3
H24 C . - C . . . G T . C . . G A . C . . T . G . C G . . . . C . - . 20 20
H25 C . - C . . . G . . C . . G A . C . . T . G . C G . . . . C . - . 1 1
H26 C . - C . . . G T . C . . G A . C . . T . G . C G . . . - . 1 1
H27 C . - C . . . G T . C . . G A . C . . T . G T C G . . . . C . - . 2 2
H28 C . . C . . . G T . C . . G A . C . . T . G . C G . . . . C . - . 2 2
H29 C . . C C . . G T . C . . G A . C . . T . G . C G . . . . C . - . 1 1
H30 C . . C C . . G T G C . . G A . C . . T . G . C G . . . . C . - . 1 1
H31 C . - C . . . G T . C A . G A . C . . T . G . C G . . . - . 1 1
H32 C . - C . . . G T G C . . G A . C . . T . G . C G . . . . C . - . 1 1
H33 C . - C . . . G T . C . . G A . C . A T . G . C G A . . . C . - . 5 5
H34 C . - C . . . G T G C A . G A . C . A T . G . C G A . . A . . - . 2 2
H35 C . - C . . . G T . C . . G A . C . . T . G . C G A . . . C . - . 1 1
H36 C . - C . . . G . . C . . G A . C . A T . G . C G A C . A C . - . 1 1
H37 C . . C . . . G T . C A . G A . C . A T . G . C G A . . A C . - . 2 2
H38 . . . A T . . . C . . . T A . . . G . . G . . . . C . - . 1 1
H39 C . . . . A T . T G C . C . . . T A . . . G . . . C - - . 1 1
H40 C . . . . A T . T G C . . . T A . . . G . . . C - - . 1 1
H41 . . . A T . . G C . . . T A . . . G . . G . . . . C . - . 11 11
H42 . . . A T . . G C . . . . G T A . . . G . . G . . . - . 1 1
H43 . . . A T . . G C . . . A . T A . . . G . . G . . . . C . - . 1 1
H44 C . . . . A T . T G C . C . . . T A . . . G . . G . . . . C - - . 1 1
H45 . . . A T . . G C . . . T A . . G G . . G . . . . C . - . 4 4
H46 . . . A T . . G C . . . T A . . G G . . G . . . . C . TA G 1 1
H47 C . . . . A T . T G C . . . T A . . . G . . G . . . . C - - . 1 1
H48 . . . A T . T G C . . . . G T A . . . G . . G . . . . C - - . 1 1
p = 0.707), and by Fu’sFsvalue, which indicated a signifi-cant deviation from neutrality (Fs = -5.7438, p = 0.001). Since these results supported a population expansion model, the coalescent model with constant exponential population growth provided by LAMARC 2.0 was chosen to estimate the demographic parameters of the Brazilian samples. The value of theta (q) was 0.005859 and the expo-nential growth rate (g) was 606.02, indicating a relatively high rate of demographic growth.
The divergence among the haplotypes recorded in the northwestern Atlantic, northern Brazil and eastern Atlan-tic/Indo-Pacific was evaluated using the model (HKY+I+G: Lset Base = (0.3178 0.2024 0.1352) Nst = 2 TRatio = 8.1339 Rates = gamma, Shape = 0.5869 Pinvar = 0.9469) selected by jModelTest. The mean corrected diver-gence values for the three comparisons were 1.47% (0.6-2.7%) for northwestern Atlantic vs.northern Brazil, 2.62% (1.4-4.4%) for northwestern Atlanticvs.eastern At-lantic/Indo-Pacific and 3.68% (2.2-5.7%) for northern Bra-zil vs. eastern Atlantic/Indo-Pacific. The mean within-group divergence among the haplotypes was similar in the three groups, at 0.3% in the northwestern Atlantic and northern Brazil and 0.37% in the eastern Atlantic/Indo-Pacific.
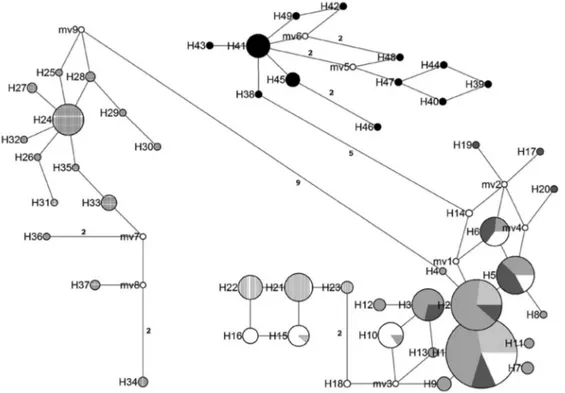
The haplotype network analysis revealed a clear sepa-ration of the Brazilian samples from the other populations of C. limbatus (Figure 3), given both the lack of shared haplotypes and the large number of mutations that typically separated the Brazilian haplotypes from those of other pop-ulations (five mutation steps from other western Atlantic populations). Based on the rate of 0.43% per million years,
the most conservative estimate for the separation of the Brazilian and northwestern Atlantic populations would be 1.38 Mya.
Discussion
Despite the intense exploitation of stocks throughout the world and the relative vulnerability of the sharks to such pressure (Baum and Myers, 2004; Myerset al., 2007), stud-ies of many populations worldwide, including those ofC.
limbatusanalyzed here, have found relatively high levels of haplotypic diversity. Furthermore, the number of haplo-types recorded in the northern Brazilian sample was rela-tively large when compared with the populations analyzed by Keeneyet al.(2003, 2005), which could be accounted for by a process of expansion. However, as only one Brazil-ian population was genotyped, it is possible that the large number of unique haplotypes resulted from migrations among different South American populations not yet sam-pled but distinct from those samsam-pled by Keeney et al.
(2003, 2005). New data, including new sampling strategies and nuclear markers, would be necessary to test this hy-pothesis.
In contrast to the results of this study, recent analyses of shark populations from the coastal regions of Southern and Central America have not detected any differentiation between these areas (Mendonçaet al., 2011; Karlet al., 2012). Mendonçaet al.(2011) found no evidence of popu-lation structure inRhizopriodon porosusfrom the Carib-bean and northern Brazil. According to these authors, this lack of structuring may be related to the high migration rates across this region, particularly the high rates of
pri-756 Population structuring ofCarcharhinus limbatus
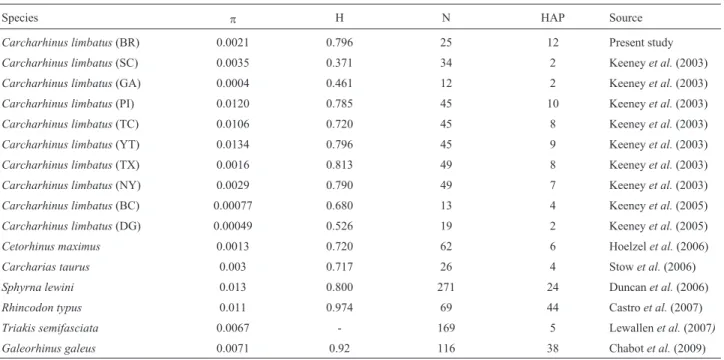
Table 2- Diversity indices for the mitochondrial control region in different populations ofC. limbatusand other shark species:p= nucleotide diversity, H = haplotype diversity, N = sample size (individuals) and HAP = number of haplotypes recorded.Note that samples from the eastern Atlantic and Indo-Pacific are excluded here because of their small size. Localities are coded as in Figure 1 and Table 1.
Species p H N HAP Source
Carcharhinus limbatus(BR) 0.0021 0.796 25 12 Present study
Carcharhinus limbatus(SC) 0.0035 0.371 34 2 Keeneyet al.(2003)
Carcharhinus limbatus(GA) 0.0004 0.461 12 2 Keeneyet al.(2003)
Carcharhinus limbatus(PI) 0.0120 0.785 45 10 Keeneyet al.(2003)
Carcharhinus limbatus(TC) 0.0106 0.720 45 8 Keeneyet al.(2003)
Carcharhinus limbatus(YT) 0.0134 0.796 45 9 Keeneyet al.(2003)
Carcharhinus limbatus(TX) 0.0016 0.813 49 8 Keeneyet al.(2003)
Carcharhinus limbatus(NY) 0.0029 0.790 49 7 Keeneyet al.(2003)
Carcharhinus limbatus(BC) 0.00077 0.680 13 4 Keeneyet al.(2005)
Carcharhinus limbatus(DG) 0.00049 0.526 19 2 Keeneyet al.(2005)
Cetorhinus maximus 0.0013 0.720 62 6 Hoelzelet al.(2006)
Carcharias taurus 0.003 0.717 26 4 Stowet al.(2006)
Sphyrna lewini 0.013 0.800 271 24 Duncanet al.(2006)
Rhincodon typus 0.011 0.974 69 44 Castroet al.(2007)
Triakis semifasciata 0.0067 - 169 5 Lewallenet al.(2007)
mary production in the delta of the Amazon River, which attracts the sharks to this area.
This interpretation is supported by the fact that, in contrast to the studies of Keeneyet al.(2003, 2005), the sample analyzed in the present study consisted of adults and is thus likely to have included potential migrants. Given this situation, a more reliable evaluation of this ques-tion will depend on the genotyping of other populaques-tions from South and Central America and the inclusion of juve-niles from nursery grounds.
Obviously, it is difficult to sample the full geographic variation of cosmopolitan marine species such as the blacktip shark, so the inclusion of the present samples from Brazil is an important contribution to understanding the
level of structuring that currently exists among populations of the western Atlantic. Keeneyet al.(2003, 2005) investi-gated the genetic structuring ofC.limbatusfrom the north-western Atlantic, Gulf of Mexico and Caribbean by analyz-ing mitochondrial (control region) and nuclear (microsatellite) markers in neonates and found significant heterogeneity among nurseries. The differences observed in the frequency of mitochondrial haplotypes and microsatellites indicated the existence of philopatric behav-ior in the females, given the greater differentiation in mater-nally-mediated genetic traits in comparison with biparental traits.
An analysis of a wider spread of samples, including the Pacific, concluded that the subdivision found in the At-lantic was not repeated in the Pacific. In addition, shallow population structuring was found between the lineages of the eastern Atlantic and the Pacific. The addition of new At-lantic populations, such as the samples from northern Bra-zil, revealed additional structuring, as demonstrated by AMOVA, although these samples were genetically more divergent than those genotyped by Keeneyet al. (2003, 2005). This was clearly shown by the mismatch plots in which the general multimodal curve was replaced by a bi-modal arrangement when only the western Atlantic sam-ples were included. Despite the relative differentiation of the Caribbean populations (Belize City and Dangriga) in relation to the other northwestern Atlantic samples (as em-phasized by the haplotype network), these populations were still part of the northwestern Atlantic mismatch curve and shared common haplotypes. This observation con-firmed that the samples from northern Brazil represent a diverse (separated by five mutations) and completely inde-pendent unit in relation to the remaining Atlantic popula-tions, probably as a consequence of philopatric behavior, as previously noted in literature (Keeneyet al., 2003, 2005; Hueteret al., 2004, 2005; Keeney and Heist, 2006).
The divergence time between the northeastern Brazil-ian and northwestern Atlantic populations was estimated at 1.38 Mya. However, as the mutation rate of the control re-gion ofC. limbatusis still unknown and since this value was based on the proposition of Keeney and Heist (2006), this divergence time may have been underestimated. The data nevertheless indicate that at least one separation event has occurred between northern and southern Atlantic popu-lations since the formation of the Isthmus of Panama (3.3 Mya). AsC. limbatus is adapted to warmer tropical and subtropical waters, shifts in ocean temperatures during the Pleistocene may have contributed to the isolation of popu-lations (Keeney and Heist, 2006). The possibility of contact between the eastern and western Atlantic populations through a southern corridor, including the Brazilian coast, is not supported by the data presented here.
The ability of sharks to travel long distances and the fact that the marine environment has few physical barriers to dispersal (Palumbi, 1994; Whiteet al., 2009) make it
tremely difficult to define the limits of a species geographic distribution. As shown here, althoughC.limbatuscan dis-perse over distances > 2,000 km (Carlson and Brusher, 1999), its populations can be genetically highly differenti-ated. The samples analyzed here were taken from a stock distinct from those examined in previous studies and the differentiation can be accounted for not only by the migra-tory behavior of the females but also by their fidelity to breeding sites, a pattern confirmed in other studies.
The results of this study emphasize the marked vari-ability of the Brazilian samples, which is characteristic of a population in expansion, as well as considerable differ-ences in comparison with other populations of the western Atlantic. This suggests that the Brazilian population should be treated as a distinct management unit, although such conclusions should be considered tentative given the fact that the study was based on a single molecular marker and only one population. Obviously, more representative sam-pling and the analysis of additional markers would provide more conclusive evidence on the genetic characteristics of the South American populations ofC.limbatus.
Acknowledgments
This research was supported by Fundação de Amparo à Pesquisa do Estado do Pará (FAPESPA) through a schol-arship to D.S. We also thank to Conselho Nacional de
Desenvolvimento Científico e Tecnológico (CNPq)- Edital Universal and the Research Fellowship to M.V.
References
Bandelt HJ, Forster P and Röhl A (1999) Median-joining net-works for inferring intraspecific phylogenies. Mol Biol Evol 16:37-48.
Baum J and Myers R (2004) Shifting baselines and the decline of pelagic sharks in the Gulf of Mexico. Ecol Lett 7:135-145.
Bornatowski H (2008) A parturition and nursery area for
Carcharhinus limbatus (Elasmobranchii, Carcharhinidae) off the coast of Paraná, Brazil. Braz J Oceanogr 56:317-319.
Bradshaw C, Fitzpatrick B, Steinberg C, Brook B and Meekan M (2008) Decline in whale shark size and abundance at Nin-galoo Reef over the past decade: The world’s largest fish is getting smaller. Biol Conserv 141:1894-1905.
Carlson J and Brusher J (1999) An index of abundance for coastal species of juvenile sharks from the northeast Gulf of Mex-ico. Mar Fish Rev 61:37-45.
Castro AL, Stewart S, Wilson G, Hueter RE, Meekan MG, Motta PJ, Bowen BW and Karl S (2007) Population genetic struc-ture of Earth’s largest fish, the whale shark (Rhincodon typus). Mol Ecol 16:5183-5192.
Chabot CL and Allen LG (2009) Global population structure of the tope (Galeorhinus galeus) inferred by mitochondrial control region sequence data. Mol Ecol 18:545-552.
758 Population structuring ofCarcharhinus limbatus
Compagno LJV (1984) Sharks of the World. An annotated and il-lustrated catalogue of shark species known to date. FAO Fish Synopsis 4:251-655.
Compagno L, Dando M and Fowler S (2005) A field Guide to the Sharks of the World. Harper-Collins, London, 368 pp. Duncan K, Martin A, Bowen B and De Couet H (2006) Global
phylogeography of the scalloped hammerhead shark (Sphyrna lewini). Mol Ecol 15:2239-2251.
Excoffier L, Smouse PE and Quattro JM (1992) Analysis of mo-lecular variance inferred from metric distances among DNA haplotypes: Application to human mitochondrial DNA re-striction data. Genetics 131:479-491.
Excoffier L, Laval G and Schneider S (2005) Arlequin, ver. 3.0: An integrated software package for population genetics data analysis. Evol Bioinform Online 1:47-50.
Faunce CH and Layman CA (2009) Sources of variation that af-fect perceived nursery function of mangroves. In: Nagel-kerken I (ed) Ecological Connectivity Among Tropical Coastal Ecosystems. Springer, the Hague, pp 401-421. Feldheim K, Gruber S and Ashley M (2001) Population genetic
structure of the lemon shark (Negaprion brevirostris) in the western Atlantic: DNA microsatellite variation. Mol Ecol 10:295-303.
Ferretti F, Worm B, Britten GL, Heithaus MR and Lotze HK (2010) Patterns and ecosystem consequences of shark de-clines in the ocean. Ecol Lett 13:1055-1071.
Fu YX (1996) New statistical tests of neutrality for DNA samples from a population. Genetics 143:557-570.
Gore M, Rowat D, Hall J, Gell F and Ormond R (2008) Transat-lantic migration and deep mid-ocean diving by basking shark. Biol Lett 4:395-398.
Hall TA (1999) BioEdit: A user-friendly biological sequence alignment editor and analysis program for Windows 95/98/NT. Nucleic Acids Symp Ser 41:95-98.
Heupel MR and Simpfendorfer CA (2011) Estuarine nursery ar-eas provide a low-mortality environment for young bull sharksCarcharhinus leucas. Mar Ecol Progr Ser 433:237-244.
Heupel MR, Simpfendorfer CA and Hueter RE (2004) Estimation of shark home ranges using passive monitoring techniques. Environ Biol Fishes 71:135-142.
Heupel MR, Carlson JK and Simpfendorfer CA (2007) Shark nursery areas: Concepts, definition, characterization and as-sumptions. Mar Ecol Prog Ser 337:287-297.
Hoelzel A, Shivji M, Magnussen J and Francis M (2006) Low
worldwide genetic diversity in the basking shark
(Cetorhinus maximus). Biol Lett 2:639-642.
Hueter R, Heupel M, Heist E and Keeney D (2004) The implica-tions of philopatry in sharks for the management of shark fisheries. J Northwest Atl Fish Sci 35:239-247.
Hueter R, Heupel M, Heist E and Keeney D (2005) Evidence of philopatry in sharks and implications for the management of shark fisheries. J Northwest Atl Fish Sci 35:239-247. Karl SA, Castro ALF and Garla RC (2012) Population genetics of
the nurse shark (Ginglymostoma cirratum) in the western Atlantic. Mar Biol 159:489-498.
Keeney D and Heist E (2006) Worldwide phylogeography of the blacktip shark (Carcharhinus limbatus) inferred from mito-chondrial DNA reveals isolation of western Atlantic popula-tions coupled with recent Pacific dispersal. Mol Ecol 15:3669-3679.
Keeney D, Heupel M, Hueter R and Heist E (2003) Genetic heter-ogeneity among blacktip shark, Carcharhinus limbatus, continental nurseries along the US Atlantic and Gulf of Mexico. Mar Biol 143:1039-1046.
Keeney D, Heupel M, Hueter R and Heist E (2005) Microsatellite and mitochondrial DNA analyses of the genetic structure of blacktip shark (Carcharhinus limbatus) nurseries in the northwestern Atlantic, Gulf of Mexico, and Caribbean Sea. Mol Ecol 14:1911-1923.
Kohler N, Casey J and Turner P (1998) NMFS Cooperative Shark Tagging Program, 1962-93: An atlas of shark tag and recap-ture data. Mar Fish Rev 60:1-87.
Kuhner MK (2006) LAMARC 2.0: Maximum likelihood and Bayesian estimation of population parameters. Bioinfor-matics 22:768.
Larkin M, Blackshields G, Brown N, Chenna R, McGettigan P, McWilliam H, Valentin F, Wallace I, Wilm A and Lopez R (2007) Clustal W and Clustal X ver. 2.0. Bioinformatics 23:2947-2948.
Lewallen EA, Anderson TW and Bohonak AJ (2007) Genetic structure of leopard shark (Triakis semifasciata) populations in California waters. Mar Biol 152:599-609.
Librado P and Rozas J (2009) DnaSP, ver. 5: A software for com-prehensive analysis of DNA polymorphism data. Bioin-formatics 25:1451-1452.
Mendonça FF, Oliveira C, Gadig OBF and Foresti F (2011) Phylogeography and genetic population structure of Carib-bean sharpnose shark Rhizoprionodon porosus. Rev Fish Biol Fish 21:799-814.
Meylan A, Bowen B and Avise J (1990) A genetic test of the natal homing versus social facilitation models for green turtle mi-gration. Science 248:724-727.
Musick J, Burgess G, Cailliet G, Camhi M and Fordham S (2000) Management of sharks and their relatives (Elasmobranchii). Fisheries 25:9-13.
Myers R and Worm B (2005) Extinction, survival or recovery of large predatory fishes. Philos Trans R Soc Lond B Biol Sci 360:13-20.
Myers RA, Baum JK, Shepherd TD, Powers SP and Peterson CH (2007) Cascading effects of the loss of apex predatory sharks from a coastal ocean. Science 315:1846-1850. Palsboll PJ, Berube M and Allendorf FW (2007) Identification of
management units using population genetic data. Trends Ecol Evol 22:11-16.
Palumbi S (1994) Genetic divergence, reproductive isolation, and marine speciation. Annu Rev Ecol Syst 25:547-572. Posada D (2008) jModelTest: Phylogenetic model averaging. Mol
Biol Evol 25:1253-1256.
Rambaut A and Drummond A (2007) Tracer ver. 1. 4. University of Oxford, Oxford.
Rogers AR and Harpending H (1992) Population growth makes waves in the distribution of pairwise genetic differences. Mol Biol Evol 9:552-569.
Rosenbaum H, Pomilla C, Mendez M, Leslie M, Best P, Findlay K, Minton G, Ersts P, Collins T and Engel M (2009) Popula-tion structure of humpback whales from their breeding grounds in the South Atlantic and Indian oceans. PLoS One 4:e7318.
Sanger F, Nicklen S and Coulson AR (1977) DNA sequencing with chain-terminating inhibitors. Proc Natl Acad Sci USA 74:5463-5467.
Simpfendorfer C and Milward N (1993) Utilisation of a tropical bay as a nursery area by sharks of the families Carchar-hinidae and Sphyrnidae. Environ Biol Fishes 37:337-345. Slatkin M and Hudson RR (1991) Pairwise comparisons of
mito-chondrial DNA sequences in stable and exponentially grow-ing populations. Genetics 129:555-562.
Stow A, Zenger K, Briscoe D, Gillins M, Peddemors V, Otaway N and Harcourt R (2006) Isolation and genetic diversity of en-dangered grey nurse shark (Carcharias taurus) populations. Biol Lett 2:308-311.
Swofford DL (2003) PAUP*: Phylogenetic analysis using parsi-mony (*and other methods), ver. 4.0 b10. Sinauer Associ-ates Inc., Publishers, Sunderland.
Tamura K, Dudley J, Nei M and Kumar S (2007) MEGA4: Molec-ular evolutionary genetics analysis (MEGA) software ver. 4.0. Mol Biol Evol 24:1596-1599.
Tillett BJ, Meekan MG, Field IC, Hua Q and Bradshaw CJA (2011) Similar life history traits in bull (Carcharhinus leucas) and pig-eye (C. amboinensis) sharks. Mar Freshw Res 62:850-860.
Tsai WP, Liu KM and Joung SJ (2010) Demographic analysis of the pelagic thresher shark,Alopias pelagicus, in the north-western Pacific using a stochastic stage-based model. Mar Freshw Res 61:1056-1066.
Vaudo J and Heithaus M (2009) Spatiotemporal variability in a sandflat elasmobranch fauna in Shark Bay, Australia. Mar Biol 156:2579-2590.
Waples R (1998) Separating the wheat from the chaff: Patterns of genetic differentiation in high gene flow species. J Hered 89:438-450.
Ward R, Woodwark M and Skibinski D (1994) A comparison of genetic diversity levels in marine, freshwater, and anadro-mous fishes. J Fish Biol 44:213-232.
White TA, Stefanni S, Stamford J and Hoelzel A (2009) Unex-pected panmixia in a long-lived, deep-sea fish with well-defined spawning habitat and relatively low fecundity. Mol Ecol 18:2563-2573.
Yokota L and Lessa RP (2006) A nursery area for sharks and rays in northeastern Brazil. Environ Biol Fishes 75:349-360.
Associate Editor: Fausto Foresti
License information: This is an open-access article distributed under the terms of the Creative Commons Attribution License, which permits unrestricted use, distribution, and reproduction in any medium, provided the original work is properly cited.