http://www.uem.br/acta ISSN printed: 1679-9275 ISSN on-line: 1807-8621
Doi: 10.4025/actasciagron.v39i4.32947
Genetic admixture in species of
Conyza
(Asteraceae) as revealed by
microsatellite markers
Carlos Alexandre Marochio1, Maycon Rodrigo Ruiz Bevilaqua2, Hudson Kagueyama Takano1*, Claudete Aparecida Mangolim3, Rubem Silvério de Oliveira Junior1 and Maria de Fátima Pires Silva Machado1
1
Programa de Pós-graduação em Agronomia, Universidade Estadual de Maringá, Av. Colombo, 5790, 87020-900, Maringá, Paraná, Brazil. 2
Programa de Pós-graduação em Biologia Comparada, Universidade Estadual de Maringá, Maringá, Paraná, Brazil. 3
Programa de Pós-graduação em Genética e Melhoramento, Universidade Estadual de Maringá, Maringá, Paraná, Brazil. *Author for correspondence. E-mail: [email protected]
ABSTRACT. The distinction among Conyza canadensis, C. bonariensis, and C. sumatrensis is a challenge for weed science. In the current study, primers for microsatellite (SSR) loci were used to investigate the molecular divergence among the three species, the genetic structure of the populations at the molecular level and the level of genetic admixture among Conyza plants from southern Brazil. Twelve primers amplified well-defined DNA segments for all 88 samples of the three Conyza species. The estimated proportion of SSR polymorphic loci, number of alleles, and mean expected heterozygosity were higher in samples of C. bonariensis than in samples of C. sumatrensis or C. canadensis. Conyza canadensis was the species with the lowest molecular diversity. High genetic divergence was observed among the three species. The well-defined ancestral groups for each species led to the identification of samples of Conyza with ancestral genomes from the three species. Hybridization events between pairs of these species may have occurred in crop fields from southern Brazil. The high molecular diversity in resistant biotypes of C. sumatrensis
indicated that these biotypes have a high potential to colonize new areas, which increases its potential as a weed.
Keywords: horseweed, molecular divergence, SSR loci.
Mistura genética em espécies de
Conyza
(Asteraceae) reveladas por marcadores
microsatélites
RESUMO. A identificação das espécies Conyza canadensis, C. bonariensis e C. sumatrensis tem sido desafiadora para a ciência das plantas daninhas. No presente estudo, primers para locos microssatélites (SSR) foram utilizados para investigar a divergência molecular entre as três espécies; mostrar como as populações estão geneticamente estruturadas em nível molecular e avaliar o nível de mistura genética entre as plantas de Conyza no Sul do Brazil. Doze primers amplificaram segmentos de DNA bem definidos em todas as 88 amostras das três espécies. A proporção estimada de locos SSR polimórficos, o número de alelos, e a heterozigosidade média esperada foram mais altos nas amostras de C. banariensis do que nas demais. C. canadensis foi a espécie com menor diversidade molecular. Divergência genética alta foi observada entre as três espécies. A formação de grupos ancestrais bem definidos para cada espécie levou à identificação de amostras de Conyza com genoma ancestral das três espécies. A ocorrência de hibridização entre as três espécies pode ter ocorrido nas lavouras do Sul do Brasil. A diversidade molecular alta em biótipos resistentes de C. sumatrensis indicou que estes biótipos têm um alto potencial para colonizar novas áreas, o que agrava seu potencial como planta daninha.
Palavras-chave: buva, divergência molecular, locos SSR.
Introduction
Some species of the genus Conyza are important
weeds as they cause serious economic losses in agriculture (Thebaud & Abbott, 1995; Bossdorf et al.,
2005). The species C. canadensis (L.) Cronquist
(horseweed), C. bonariensis (L.) Cronquist (hairy
fleabane) and C. sumatrensis (Retz.) E. Walker
(Sumatran fleabane) are examples of weeds that occur
in orchards; vineyards; corn, soybean, cotton, and forage crops; pastures, and fallow areas (Lazaroto,
Fleck, & Vidal, 2008). Conyza canadensis is native to
North America, whereas C. bonariensis and C.
sumatrensis are native to South America. Among these
three species, C. canadensis and C. sumatrensis are the
The increase in the economic relevance of these weeds is related to two main factors. One factor is the very efficient seed dispersal of these species and their prolific seed production, estimated at over
148,000 m-2 (Steckel & Gwathmey, 2009). The
second factor is the intense use of chemical options for their control, which has led to the selection of biotypes that are resistant to several herbicide mechanisms of action. To date, resistance to EPSPS inhibitors, ALS inhibitors and Photosystem I (PSI) and II (PSII) inhibitors individually, and multiple resistance to PSI + EPSPS, ALS + EPSPS or ALS + PSII have been reported (Matzraf, Lazar, Sibony, & Rubin, 2015). Among all three species, cases of resistance to herbicides have been reported in 35 countries (Heap, 2016).
Conyza bonariensis and C. sumatrensis are common
in Southern, Southeast and Midwestern of Brazil
(Santos et al., 2014b). In contrast, C. canadensis
occurs only in the Southern Region, particularly in Rio Grande do Sul State (Lazaroto et al., 2008). Identification keys (Pruski & Sancho, 2006) typically define characteristics that can be used to
differentiate the three Conyza species. In C.
canadensis, the leaves are yellowish green and
glabrous, whereas in C. bonariensis and C. sumatrensis, they are greyish green and very hairy. The species
vary in height and branching habit. Conyza canadensis
branches from the middle of the main stem, C.
bonariensis has branches that are taller than the main
stem, and C. sumatrensis has branching towards the
top of the main stem (Sansom, Saborido, & Dubois, 2013). However, in South America, definite identification of and distinction among the three species of important weeds is difficult due to morphological variability within species, the occurrence of varieties within some species, and hybridization between species (Thebaud & Abbott, 1995).
Herbicide susceptibility varies among these species (Gonzalez-Torralva et al., 2010; Zheng et al., 2011); however, due to the difficulty in their identification, reports of unsuccessful control might involve weed misidentification. Developing a deeper understanding of the genetic structure of these species may help scientists to develop more precise identification tools and effective strategies for control.
In contrast to the several studies on the characteristics of resistant biotypes in other weeds (Yamauti et al., 2010; Xiao-Ling et al., 2011; Santos et al., 2014a), few studies have addressed how the
populations of C. canadensis, C. bonariensis and C.
sumatrensis are genetically structured at the molecular
level. Molecular analysis techniques allow us to
estimate the genetic variability within and between species. They can also be used to search for specific unique molecular markers (alleles) of one or more
species of Conyza; if found, such markers could be
used to support the identification of and distinction among species. Differential allele frequencies could also be useful for species identification.
Simple sequences repeated of genomic DNA (SSR loci, also known as microsatellite loci) are efficient molecular markers to estimate genetic divergence and to reveal population structure in
many plant species. In Conyza species, SSR loci have
been used as molecular markers to investigate the evolution and spread of glyphosate resistance in
C. canadensis in California (Yuan et al., 2010; Okada
et al., 2013).
Invasive species that grow under strong selection pressure from herbicide application usually show significant genetic differentiation. Moreover, less genetic diversity is expected in samples of resistant biotypes that have been under selection due to the recurrent use of herbicides. In the current study, SSR loci were used to investigate the molecular
divergence among the three species (C. canadensis, C.
bonariensis, and C. sumatrensis) and to evaluate the
level of genetic admixture among Conyza plants
from southern Brazil.
Material and methods
The seeds of C. sumatrensis were collected from
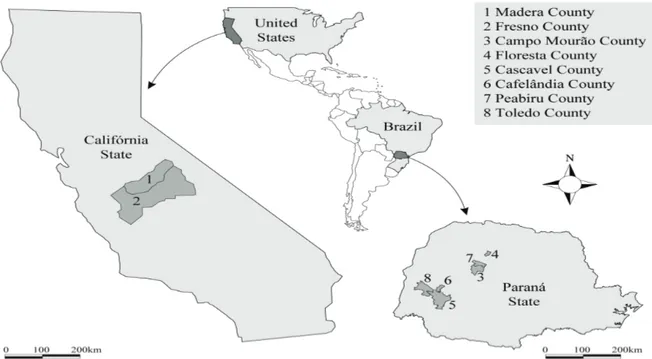
several plants in Campo Mourão, Floresta, Cascavel, Cafelândia, Peabiru, and Toledo in Paraná State, Brazil, in January 2011 (Figure 1; Table 1). Seeds were collected from plants in fields of glyphosate-resistant (GR) soybeans with a history of glyphosate applications of at least four years and for which farmers reported decreasing levels of control over repeated glyphosate applications. The seeds from each collection site were individually placed in paper bags to prevent the mixture of seeds from different collection sites.
Seeds from each site were randomly distributed for germination in separated 500-mL pots containing sterile soil. Plants obtained from germinated seeds were maintained at room temperature in the greenhouse at the State University of Maringá (latitude 23°23'44.91"S and longitude 51°57'3.13"W, altitude 510 m), irrigated daily, and used for the experiments. A sample consisting of young leaves collected from 43 plants
of C. sumatrensis was used for DNA extraction. The
Figure 1. Distribution of the Conyza plants from which seeds were germinated to form samples representative of C. sumatrensis from Campo Mourão, Floresta, Cascavel, Cafelândia, Peabiru, and Toledo in Paraná State, Brazil, and of C. canadensis and C. bonariensis from the Central Valley of the State of California, United States.
(Uberlandense Herbarium) at the Federal University of Uberlândia (Minas Gerais State, Brazil), where they
were cataloged and classified as Conyza sumatrensis
(Retz.) E. Walker. The plants of C. sumatrensis were
analyzed for possible resistance to glyphosate, which was applied at different stages of development according to procedures described by Santos et al. (2014b). The samples from Cascavel and Toledo were recorded as glyphosate resistant (SFR 6 and SFR 9, respectively; Table 1), whereas the remaining samples
of C. sumatrensis (SFS) were recorded as sensitive to
glyphosate.
The seeds of C. canadensis and C. bonariensis were
collected in the Central Valley of the state of California,
United States (Table 1; Figure 1). Since C. canadensis
and C. bonariensis are well-differentiated species in
North America, samples of the two species were collected in California and used as referential genomes to evaluate the level of genetic admixture among
Conyza plants of southern Brazil. The broad
morphological variability in Conyza plants from
southern Brazil makes it difficult to obtain a secure identification of C. canadensis or C. bonariensis plants.
Then, the seeds of resistant plants of C. canadensis
(HWR) were collected in Madera County (Dinuba,
CA), and the seeds of susceptible plants of C. canadensis
(HWS 156) were collected in Fresno County. The
seeds of C. bonariensis were collected from plants with
multiple resistance (BH 51) to glyphosate and ALS in
Fresno County (Parlier, CA) and from plants resistant to glyphosate (BH 53) in Parlier. Seeds were germinated in plastic trays (52 x 27 x 6 cm) in the greenhouse at the University of California (Davis, CA), using the substrate Sunshine Mix (Sungro Horticulture Canada, Ltd., Vancouver, British Columbia, Canada) for the establishment and growth of the plants. The plants were grown in greenhouse at the experimental field of the university (38°32'33.52"N and 121°45'47.92"W, elevation 17 meters). Samples consisting of young leaves collected from 45
plants of each species (C. canadensis and C.
bonariensis)were used for DNA extraction.
Table 1. Samples of Conyza sumatrensis (SF) obtained from several sites (Campo Mourão, Floresta, Cascavel, Cafelândia, Peabiru, and Toledo) in Paraná State, Brazil, and samples of
Conyza canadensis (HW) and Conyza bonariensis (BH) obtained
from Dinuba, Fresno, and Parlier in the Central Valley of the State of California, USA.
Site Samples Number of
plants
Altitude (m)
Conyza sumatrensis Campo Mourão SFS 13 9 634
Floresta SFS 18 7 391
Cascavel SFR 6 9 625
Cafelândia SF 2 9 509
Peabiru SFS 17 4 501
Toledo SFR 9 5 531
Conyza canadensis Dinuba HWR 9 94
Fresno HWS 156 9 83
Conyza bonariensis Parlier BH51 4 103
Parlier BH53 23 106
Total 88
For DNA extraction, leaf pieces (300 mg) of each
C. sumatrensis plant were separately ground in liquid
nitrogen and homogenized with a glass rod in an Eppendorf microcentrifuge tube with the use of 800
μL extraction solution prepared with Tris-HCl 100
mM / EDTA 20 mM containing NaCl 1.4 M, CTAB (Cetyl Trimethyl Ammonium Bromide) 2%, PVP-40
(Polyvinylpyrrolidone-40) 2%, and β-mercaptoethanol
0.2% and maintained in an ice chamber. After homogenization, the microcentrifuge tubes were shaken gently and incubated at 65°C for 30 min. DNA was extracted according to the protocol by Doyle and Doyle (1990).
DNA extraction from plants of C. canadensis and C.
bonariensis was performed using the Soltis Lab CTAB
DNA Extraction Protocol (2002) developed from Doyle and Doyle (1990) and Cullings (1992) protocols
(http://www.flmnh.ufl.edu/museum-voices/soltis-lab/files/2014/02/CTAB-DNA-Extraction.pdf). The young leaves were collected from plants with six weeks after plant emergence. For DNA extraction, leaf pieces (10–20 mg) were separately ground in liquid nitrogen and homogenized with a glass rod in an Eppendorf
microcentrifuge tube with the use of 500 μL CTAB
buffer extraction prepared according to the Soltis Lab CTAB DNA Extraction Protocol (2002).
After DNA extraction, DNA quantity and quality were determined by 0.8% agarose gel electrophoresis buffered with 1 x TAE (0.04 M Tris-Acetate and 0.001
M EDTA). A standard DNA (λ phage; 50, 100, and
150 ng) was used as a marker of concentration. The gel
was stained with 0.5 μg/mL ethidium bromide, and the
image was visualized with a Molecular Image Loccus
L-PIX - HE (Loccus do BrasilLtda., São Paulo, São
Paulo State, Brazil) and the Picasa 3 program. The samples were also quantified using UV-visible
Picodrop® spectrophotometer to verify the
concentration of DNA per μL of each sample for
dilution to be used in the PCR reactions.
Sixteen SSR primers previously developed for C.
canadensis, i.e.,HW01, HW02, HW06, HW07, HW14,
HW27, HW29 (Abercrombie, Anderson, & Baldwin, 2009), HW17, HWSSR01, HWSSR03, HWSSR04, HWSSR06, HWSSR07, HWSSR09, HWSSR11, and HWSSR12 (Okada et al., 2013), were used with eight DNA samples to define the DNA quantity used for polymerase chain reaction (PCR). After initial
screening, a 1.0 μL aliquot of DNA was defined for
further analysis. PCR was performed using a PTC-200 Peltier thermal cycler. The reaction mixtures were prepared in microtubes (1.5 mL) and then loaded on a
multiplex plate as described by Okada et al. (2013),
with a final volume of 10 μL per reaction: dNTP 125
mM, 0.375 units of Taq polymerase (QIAGEN, Valencia, CA, USA), 1 x PCR buffer (QIAGEN), 10
ng DNA, 10 mM of the reverse and forward primers,
and Milli-Q water to make up to 10 μL.
Microsatellite amplification was initially performed with initial denaturation at 94°C for 5 min. followed by 34 cycles at 94°C for 1 min.; annealing was carried out at 55 °C for 1 min, and extension was at 72°C for 1 min. and 30 seconds. Electrophoresis was performed in
a 2% agarose gel using 0.5 x TBE buffer (44.5 mmol·L-1
Tris, 44.5 mmol·L-1 boric acid, and 1 mmol·L-1 EDTA)
at 109 V for 60 min. Each gel was stained with
ethidium bromide at 0.5 μg·mL-1, and the image was
captured using a Kodak EDAS 290 digital camera. The sizes of the amplified DNA segments (alleles) were determined using a 100-bp DNA Ladder (Invitrogen).
The polymorphic SSR loci in the C.
sumatrensis, C. canadensis, and C. bonariensis
samples were used to estimate the average number of alleles per locus, the average observed
heterozygosity (Ho), and the expected
heterozygosity (He). The genetic diversity among
the six samples of C. sumatrensis (FST) was
estimated using the POPGENE 1.32 program (Yeh, Boyle, & Xiyan, 1999). The genetic distance matrix was calculated by the UPGMA clustering method (Unweighted Pair-Group Mean Average) using the values of Nei genetic distances (Nei, 1978).
Polymorphism in the SSR loci was also analyzed using the software Structure 2.0 (Pritchard, Wen, & Falush, 2010) and Instruct (Gao, Williamson, & Bustamante, 2007), which evaluate the level of genetic
admixture among the three species of Conyza. The
genotypes were clustered, with the number of clusters (K) ranging from 2 to 14, and were tested using the admixture model with a burn-in period of 200,000 repeats followed by 100,000 Markov Chain Monte Carlo (MCMC) repeats, considering the presence and absence of alleles across the sample. The true number of populations (K) is often identified using the
maximal value of ∆ (K) returned by the software. The
most likely number (K) of subpopulations was identified as described by Evanno, Regnaut, and Goudet (2005). The graphical output display of the Structure results was taken as input data using the Structure Harvester, a website and software that are used to visualize Structure output and to implement the Evanno method (Earl & Von Holdt, 2012) to display a graphical representation. The graphical output display of the Instruct results was taken using the Distruct software (Rosenberg et al., 2002) to draw a bar plot of individual genome assignments. To explore the hierarchical partitioning of genetic variation within and
among the samples of Conyza, we performed an
Results and discussion
Four primers (HW01, HW27, HWSSR06, and HWSSR12) did not produce well-defined
amplified DNA segments for all 88 samples of C.
sumatrensis, C. canadensis, and C. bonariensis, and
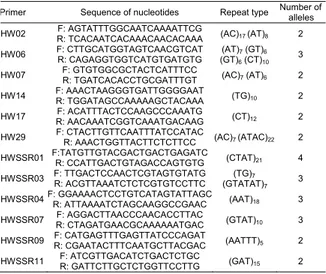
only 12 (HW02, HW06, HW07, HW14, HW29, HW17, HWSSR01, HWSSR03, HWSSR04, HWSSR07, HWSSR09, and HWSSR11) amplified two or more alleles per polymorphic locus (Table 2). The estimated proportion of SSR polymorphic
loci (%P) was higher in samples of C. bonariensis
(91.67%) than in samples of C. sumatrensis
(83.33%) or C. canadensis (75%). However, the
number of alleles (Na), effective number of alleles
(Ne), and mean expected heterozygosity (He) were
highest in samples of C. sumatrensis, indicating the
highest molecular diversity. Samples of C.
canadensis showed the lowest molecular diversity
(Table 3).
The Nei identity (Nei, 1978) values calculated from analysis of the 12 microsatellite loci of the
three species of Conyza showed that the highest
value of genetic identity (I = 0.8293) was
observed between C. canadensis and C. sumatrensis
and that the most divergent species (I = 0.6303)
were C. canadensis and C. bonariensis. The
similarity between C. canadensis and C. bonariensis
was lower than that between C. canadensis and C.
sumatrensis and that between C. bonariensis and C.
sumatrensis (0.7348) for number and frequencies of
alleles at the 12 SSR loci. AMOVA showed higher genetic variation within (54%) than among (46%)
the C. canadensis,C. bonariensis, and C. sumatrensis
samples.
Table 2. Simple Sequence Repeat (microsatellite) primers used for analysis of the Conyza sumatrensis, C. canadensis, and C.
bonariensis plants, and the number of alleles at each locus.
Primer Sequence of nucleotides Repeat type Number of
alleles
HW02 F: AGTATTTGGCAATCAAAATTCG
R: TCACAATCACAAACAACACAAA (AC)17(AT)8 2
HW06 F: CTTGCATGGTAGTCAACGTCAT
R: CAGAGGTGGTCATGTGATGTG
(AT)7 (GT)6
(GT)6 (CT)10
3
HW07 F: GTGTGGCGCTACTCATTTCC
R: TGATCACACCTGCGATTTGT (AC)7 (AT)6 2
HW14 F: AAACTAAGGGTGATTGGGGAAT
R: TGGATAGCCAAAAAGCTACAAA (TG)10 2
HW17 F: ACATTTACTCCAAGCCCAAATG
R: AACAAATCGGTCAAATGACAAG (CT)12 2
HW29 F: CTACTTGTTCAATTTATCCATAC
R: AAACTGGTTACTTCTCTTCC (AC)7 (ATAC)22 2
HWSSR01 F:TATGTTGTACGACTGACTGAGATC
R: CCATTGACTGTAGACCAGTGTG (CTAT)21 4
HWSSR03 F: TTGACTCCAACTCGTAGTGTATG
R: ACGTTAAATCTCTCGTGTCCTTC
(TG)7
(GTATAT)7
3
HWSSR04 F: GGAAAACTCCTGTCATAGTATTAGC
R: ATTAAAATCTAGCAAGGCCGAAC (AAT)18 3
HWSSR07 F: AGGACTTAACCCAACACCTTAC
R: CTAGATGAACGCAAAAAATGAC (GTAT)10 3
HWSSR09 F: CATGAGTTTGAGTTATCCCAGAT
R: CGAATACTTTCAATGCTTACGAC (AATTT)5 2
HWSSR11 F: ATCGTTGACATCTGACTCTGC
R: GATTCTTGCTCTGGTTCCTTG (GAT)15 2
Table 3. Number of alleles (Na) and effective number of alleles (Ne) per polymorphic SSR locus, mean observed heterozygosity (Ho), expected heterozygosity (He), and percentage of
polymorphic loci (%P) in the samples from the three Conyza
species (C. canadensis, C. bonariensis, and C. sumatrensis).
Species N Na Ne Ho He %P
C. canadensis 18 1.7500 1.5092 0.0370 0.2775 75.00
C. bonariensis 27 2.0873 1.6481 0.1115 0.3500 91.67
C. sumatrensis 43 2.1667 1.9388 0.1053 0.4291 83.33 Total/Mean 88 2.5 2.0194 0.0899 0.4787 100
The clustering of the C. canadensis, C.
bonariensis, and C. sumatrensis plants according to a
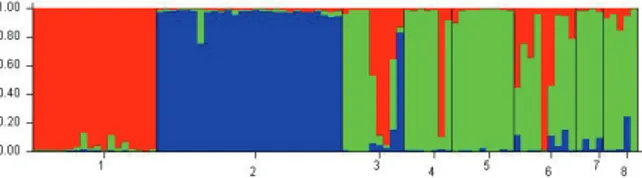
model-based Bayesian algorithm is shown in Figure 2. Each bar in the graph represents a plant and its inferred proportion of genome admixture. The colors represent three different ancestral groups. The optimal K value determined by Bayesian analysis indicated that the plants were
grouped into 3 clusters (∆K2 = 0.00; ∆K3 =
91.5046; ∆K4 = 0.3635; ∆K5 = 1.3088; ∆K6 =
0.9398; ∆K7 = 1.2130; ∆K8 = 0.00; ∆K9 =
1.4745; ∆K10 = 8.9503; ∆K11 = 0.1505; ∆K12 =
3.0456; ∆K13 = 0.2263; ∆K14 = 0.00). The bar
plot obtained for the K value (K = 3; ΔK =
91.5046), and the results showed that 96.9% of the
C. canadensis samples were in the red group, 96.7%
of the C. bonariensis samples were in the blue
group, and 79.7% and 15.1% of the C. sumatrensis
samples were in the green and red groups, respectively (Table 4).
The bar plot graphic (Figure 2) shows that
several plants identified as C. sumatrensis in the
ancestral group that were defined as prevalent in
samples of C. canadensis and C. bonariensis from
the Northern Hemisphere (Central Valley of California, USA). Unlike the analysis using the Structure software, the analysis using Instruct identified ten clusters for the 88 samples of the
three Conyza species. Plants sharing alleles from
the ten groups are evident in samples of the
species C. canadensis, C. bonariensis, and C.
sumatrensis. The selfing rate was high, ranging
from 0.655 ± 0.028 (cluster 1) to 0.803 ± 0.013
(cluster 10). In the plants of C. canadensis from
Dinuba (HWR), the Instruct analysis identified the predominance of the ancestral genome from the pink group, which suggests the selection of one of the ancestral groups in the resistant biotypes of C. canadensis.
The bar plot shows that the plants of Campo Mourão represent all three groups but predominantly
represent the red group (C. canadensis). Plants from the
blue group (C. bonariensis) are also evident in samples
(C. canadensis) are evident. In the samples from Peabiru and Toledo, low proportions of plants of the red and blue groups are apparent.
Figure 2. Bar plot of descendants from Conyza canadensis
obtained from Dinuba (HWR) and Fresno (HWS 156), C.
bonariensis obtained from Parlier,and C. sumatrensis obtained from
Campo Mourão (3), Floresta (4), Cascavel(5), Cafelândia (6), Peabiru(7), and Toledo (8) in three inferred groups based on ΔK values. Each plantlet is represented by a single vertical line broken into K colored segments (K = 3), with lengths proportional to each of the K inferred clusters. Each color represents the proportion of membership of each individual, represented by a vertical line
Table 4. Proportion of Conyza canadensis, C. bonariensis, and C.
sumatrensis samples in each group (K = 3) and the number of
sampled plants.
Samples Group Number of plants
Red Green Blue
C. Canadensis 0.969 0.024 0.007 18
C. bonariensis 0.011 0.021 0.967 27
C. sumatrensis 0.151 0.797 0.051 43
A lower proportion of polymorphic loci was
observed for C. canadensis-R plants (HWR: 41.67%)
than for C. canadensis-S plants (HWS 156: 66.67%),
suggesting that resistant plants show a reduction of polymorphism in microsatellite loci. Lower
polymorphism in C. bonariensis-2R (BH51: 50%) plants
than in C. bonariensis-R (BH53: 91.67%) plants was also
observed but not considered of significance since a
relatively low number of C. bonariensis-2R plants were
analyzed.
In the samples of C. sumatrensis distributed among
the six sites from southern Brazil (Paraná State), the highest proportion of polymorphic loci (83.3%) was observed in samples from Campo Mourão and Cafelândia. However, the highest number of alleles (Na = 2.0833) and the highest effective number of alleles (Ne = 1.8016), as well as the highest mean
expected heterozygosity value (He = 0.3632), were
observed in the samples from Toledo-R identified by
Santos et al. (2014b) as resistant to glyphosate (Table 5). A high number of alleles (Na = 1.9167) and a high effective number of alleles (Ne = 1.6171) were also observed in samples of resistant biotypes from
Cascavel-R (Table 5). Values of Ho were lower than He
in the samples characterized as susceptive to glyphosate and those characterized as resistant, indicating a deficit of heterozygosity in all of the samples of C. sumatrensis. However, the selection for resistant biotypes due to
glyphosate application has not reduced the number of
alleles (Na and Ne) in the resistant biotypes (from
Toledo and Cascavel; Table 5).
Table 5. Number of alleles (Na) and effective number of alleles (Ne) per polymorphic SSR locus, mean observed heterozygosity (Ho), expected heterozygosity (He), and percentage of
polymorphic loci (%P), in the samples of Conyza sumatrensis from six sites in southern Brazil.
Site N Na Ne Ho He %P
Campo Mourão 9 2.0000 1.5915 0.1148 0.3344 83.3 Floresta 8 1.5455 1.3431 0.0779 0.2096 50.0 Cascavel 9 1.9167 1.6171 0.0556 0.3255 75.0 Cafelândia 9 2.0000 1.6750 0.1167 0.3517 83.3 Peabiru 4 1.5833 1.4175 0.1042 0.2370 58.3
Toledo 5 2.0833 1.8016 0.1708 0.3632 75.0
Total/Mean 43 2.1667 1.9388 0.1053 0.4291 83.3
The differential allele frequency in samples of C.
sumatrensis among the six sites in southern Brazil is very
high (FST = 0.31), indicating that the samples from the
six sites are from structured sub-populations of C.
sumatrensis. There are common alleles occurring at
similar frequencies in all samples at the HW29
(HW291) and HWSSR11 (HWSSR111) loci, indicating
an absence of genetic differentiation; however, the differential frequencies of alleles at other loci are sufficiently high to determine the genetic structure of
the six samples of C. sumatrensis. The gene flow (Nm =
0.5535) was moderate among the samples of C.
sumatrensis from the six sites, suggesting an exchange of
alleles or dispersion of samples among sites.
The Nei identity (Nei, 1978) values calculated from the analysis of the 12 microsatellite loci of
samples of C. sumatrensis from six sites in southern
Brazil (Campo Mourão, Floresta, Cascavel, Cafelândia, Peabiru, and Toledo) showed that the highest value of genetic identity (I = 0.9275) was observed between samples from Cascavel and Peabiru and that the most divergent samples (I = 0.6931) were those from Floresta and Peabiru (Table 6). The high genetic similarity between the samples from Cascavel and Peabiru suggest that the implementation of similar control strategies could be effective in the two areas since plants with high genetic similarity can be expected to respond similarly to such strategies.
Table 6. Similarity matrix based on 12 SSR loci of the samples of
Conyza sumatrensis from six sites (Campo Mourão, Floresta,
Cascavel, Cafelândia, Peabiru, and Toledo) in southern Brazil.
Campo
Mourão Floresta Cascavel Cafelândia Peabiru Toledo Campo Mourão - 0.7593 0.7782 0.9235 0.7122 0.7793 Floresta 0.2754 - 0.7872 0.7610 0.6931 0.7428 Cascavel 0.2508 0.2393 - 0.7978 0.9275 0.9119 Cafelândia 0.0795 0.2731 0.2258 - 0.7175 0.8196 Peabiru 0.3394 0.3666 0.0752 0.3319 - 0.8811 Toledo 0.2494 0.2973 0.0922 0.1990 0.1266 -
Although the functional significance of the SSR
loci (HW02, HW06, HW07, HW14, HW29, HW17,
HWSSR01, HWSSR03, HWSSR04, HWSSR07,
HWSSR09, HWSSR11) in Conyza species is
unknown, the high number of alleles and the high
levels of observed and expected heterozygosity in C.
sumatrensis suggest that this species a higher potential
than does C. canadensis or C. bonariensis to colonize
new areas. High heterozygosity has been considered to indicate that the plant population has a substantial amount of adaptive genetic variation since there is a greater chance of finding plants that respond differently to changes or pressures exerted by the environment. SSR loci that occur in tandem are abundantly distributed in coding and non-coding regions of plant genomes (see review by Kalia, Rai, Kalia, Singh, & Dhawan, 2011) such that alterations in SSR loci that are located in a coding region or intron have the potential to regulate the differential expression of genes related to the environmental adaptive potential of the plant. The high molecular
diversity estimated for C. sumatrensis appears to be
consistent with the high morphological diversity that is reported by farmers and agronomists in the cropping fields in southern Brazil.
The molecular differentiation in SSR loci of the
three Conyza species is consistent with the value of
genetic identity found between the samples of C.
canadensis and C. bonariensis (0.6303), C. canadensis
and C. sumatrensis (0.8293), and C. bonariensis and C.
sumatrensis (0.7348). Levels of genetic identity lower
than 0.85 are frequently reported between populations from different species (Thorpe & Solé-Cava, 1994). The highest value of genetic identity
reported in our study (I = 0.8293) was between C.
canadensis and C. sumatrensis. The highest value of
molecular similarity between C. canadensis and C.
sumatrensis is in agreement with the highest similarity
reported based on morphological parameters (Pruski & Sancho, 2006; Vladimirov, 2009).
AMOVA showed higher genetic variation within (54%) than among (46%) the samples of the three
species, and the grouping of the C. canadensis, C.
bonariensis, and C. sumatrensis plants according to
Bayesian statistics revealed that the higher molecular diversity within the samples of the three species of
Conyza is due to the high diversity within C.
sumatrensis. The plants of Campo Mourão,
Cafelândia, and Floresta represent all three ancestral groups (red, green, and blue), with genomes
predominantly of the red group (C. canadensis) and
the blue group (C. bonariensis), whereas in the
samples from Peabiru and Toledo, low proportions of the genomes of the red and blue groups was observed.
The mixture of genomes, which were defined as
ancestral groups prevalent in samples of C. canadensis
and C. bonariensis from the Central Valley of
California, in samples from sites in Paraná State
suggest that all three species Conyza are present in
these areas and that hybridization may be occurring.
The presence of different Conyza species in an area
can lead to difficulty in species identification. Seeds of a particular species can be carried to other areas by wind dispersal or via the movements of agricultural machinery. The potential exchange of
alleles between C. canadensis and C. bonariensis has
been noted in areas of São Paulo State, Brazil, based on analyses of loci for isozymes of esterase, malate dehydrogenase and acid phosphatase (Soares et al.,
2015). Genomic admixture of Conyza species could
explain why plants of one species (e.g., C.
sumatrensis) can often exhibit the characteristics of
another (e.g., C. bonariensis or C. canadensis). The
hybridization between C. canadensis and C.
ramosissima that was induced by Zelaya, Owen, and
Vangessel (2007) produced interspecific hybrids of
Conyza that exhibited intermediate phenotypes
between the parents.
Despite the genomic admixture of the three ancestral groups in some plants in southern Brazil (evident in the bar plot graphic; Figure 2), the selfing rate revealed by the Instruct analysis for the
three species of Conyza was high (0.655–0.803).
Self-compatibility in Conyza species might explain
the low values of Ho (Table 3) in the three Conyza
species. Conyza canadensis is described as a
self-compatible species in which the pollen is released before the capitula have fully opened, suggesting that it is primarily self-pollinated (Weaver, 2001;
Okada et al., 2013). High inbreeding coefficients (FIS
= 0.850 to 0.966) in a large sample of C. canadensis
were recently reported by Okada et al. (2013) in a microsatellite loci analysis. Self-pollination has also
been described in C. bonariensis (Ferrer & Good
-Avila, 2007) but has not been described to date in C.
sumatrensis. In C. sumatrensis, the analysis of SSR
polymorphism indicated moderate gene flow (Nm = 0.5535) among the samples from different sites (Campo Mourão, Floresta, Cascavel, Cafelândia, Peabiru, and Toledo), suggesting out-crossing among plants from these sites. Values of Nm ranging from 0.25 to 0.99 indicate intermediate gene flow among populations (Govindaraju, 1989).
Despite the indication of moderate gene flow
among the C. sumatrensis samples, the value of FST
(0.31) was high, indicating that the frequency of alleles at the SSR loci varied among the six samples.
Values of FST ranging from 0.01 to 0.05 indicate
0.05 to 0.15 indicate moderate divergence, whereas those ranging from 0.15 to 0.25 indicate high
divergence. The observed FST was ˃ 0.25, indicate
very high divergence among the populations. Conyza
sumatrensis species forms genetically well-structured
populations according to both Wright's F-statistic
(Wright, 1965) and Bayesian statistics. Highly
differentiated populations with FST values ranging
from 0.034 to 0.7530 have been reported by Okada
et al. (2013) for 42 populations of C. canadensis from
different geographical regions across the Central Valley of California. Most populations were highly differentiated, as expected for a highly selfing species. Since the establishment of a population of an invasive species often involves a small number of plants that contain only part of the variation present in the origin population, the "founder effect" in self-fertilization species can result in populations with different numbers and proportions of alleles. Moreover, invasive species that have evolved under strong selection pressure by herbicide application are expected to show high genetic differentiation.
The high proportion of polymorphic loci and the high values of observed and expected heterozygosity
(Table 6) in samples of C. sumatrensis that were
identified as resistant to glyphosate as well as those identified as susceptive to glyphosate conflicts with our hypothesis that lower genetic diversity is expected in samples of resistant biotypes that have been selected for by the use of herbicides. The
molecular diversity estimated in the samples C.
sumatrensis that were resistant to glyphosate indicates
that the selection of resistant biotypes has not reduced the number of alleles or the observed and expected heterozygosity in the resistant biotypes.
Conclusion
The high genetic similarity at the molecular level
observed between C. canadensis and C. sumatrensis is
consistent with the high morphological similarity between the two species. The well-defined groups of ancestral genomes in the microsatellite loci for each species led to the identification of plants with
the ancestral genome of C. canadensis in southern
Brazil, where C. sumatrensis is the prevalent species,
and to the identification of samples with admixture of ancestral genomes of two or three species. Moreover, the high molecular diversity in the
resistant biotypes of C. sumatrensis indicated that
these biotypes have a high potential to colonize new areas, which will facilitate their persistence and increase the difficulty of their control. The high molecular diversity of the resistant biotypes is
consistent with the hypothesis of multiple mechanisms that are involved in herbicide resistance
in Conyza species. The high and low values of
genetic similarity between the C. sumatrensis samples
may be used to investigate the efficiency of similar and different strategies, respectively, to control infestation in different areas.
Acknowledgements
We would like to thank CAPES (Coordenação de Aperfeiçoamento de Pessoal de Nível Superior) and CNPq (Conselho Nacional de Desenvolvimento Científico e Tecnológico) for their financial support. We would also like to thank the researchers, technicians and students of the Jasieniuk Lab (Department of Plant Science at the University of California, Davis, CA), who offered to give in part of the biological material and allowed the execution of part of the lab work in this work.
References
Abercrombie, L. G., Anderson, C. M., & Baldwin, B. G. (2009). Permanent genetic resources added to Molecular Ecology Resources database 1 January 2009–30 April 2009. Molecular Ecology Resources, 9(5), 1375-1379.
Bossdorf, O., Auge, H., Lafuma, L., Rogers, W. E., Siemann, E., & Prati, D. (2005). Phenotypic and genetic differentiation between native and introduced plant populations. Oecologia, 144(1), 1-11.
Cullings, K. W. (1992). Design and testing of a plant-specific PCR primer for ecological and evolutionary studies. Molecular Ecology,1(4), 233-240.
Doyle, J. J., & Doyle, J. L. (1990). Isolation of plant DNA from fresh tissue. Focus, 12(1), 13-15.
Earl, D., & Vonholdt, B. M. (2012). Structure Harvester: a website and program for visualizing Structure output and implementing the Evanno method. Conservation Genetic Resources,4(2), 359-361.
Evanno, G., Regnaut, S., & Goudet, J. (2005). Detecting the number of clusters of individuals using the software Structure: a simulation study. Molecular Ecology,14(8), 2611-2620.
Ferrer, M. M., & Good-Avila, S. V. (2007). Macrophylogenetic analyses of the gain and loss of self-incompatibility in the Asteraceae. New Phytologyst, 173(2), 401-414.
Gao, H., Williamson, S., & Bustamante, C. D. (2007). An MCMC approach for joint inference of population structure and inbreeding rates from multi-locus genotype data. Genetics,176(3), 1635-1651.
Gonzalez-Torralva, F., Cruz-Hipolito, H., Bastida, F., Malleder, N., Smeda, R. J., & De Prado, R. (2010). Differential susceptibility to glyphosate among the
Govindaraju, D. R. (1989). Variation in gene flow levels among predominantly self-pollinated plants. Journal of Evolutionary Biology,2(3), 173-181.
Heap, I. (2016). International survey of herbicide resistant weeds. Retrieved on July 24, 2016 from http://www. weedscience.org
Kalia, R. K., Rai, M. K., Kalia, S., Singh, R., & Dhawan, A. K. (2011). Microsatellite markers: an overview of the recent progress in plants. Euphytica,177(3), 309-334. Lazaroto, C. A., Fleck, N. G., & Vidal, R. A. (2008).
Biologia e ecofisiologia de buva (Conyza bonariensis e
Conyza canadensis). Ciência Rural,38(3), 852-860. Matzrafi, M., Lazar, T. W., Sibony, M., & Rubin, B.
(2015). Conyza species: distribution and evolution of multiple target-site herbicide resistances. Planta, 242(1), 259-67.
Nei, M. (1978). Estimation of average heterozygosity and genetic distance from a number of individuals.
Genetics,89(3), 538-590.
Okada, M., Hanson, B. D., Hembree, K. J., Peng, Y., Shrestha, A., Stewart Jr., C. N., ... Jasienuk, M. (2013). Evolution and spread of glyphosate resistance in
Conyza canadensis in California. Evolutionary
Applications, 6(5), 761-777.
Peakall, R., & Smouse, P. E. (2006). GenAIEx 6: genetic analysis in Excel. Population genetic software for teaching and research. Molecular Ecology Resources,6(1), 288-295.
Pritchard, K. J., Wen, W., & Falush, D. (2010).
Documentation for Structure software: Version 2.3.Chicago, IL: University of Chicago.
Pruski, J. F., & Sancho, G. (2006). Conyza sumatrensis var. leiotheca (Compositae: Astereae), a new combination for a common neotropical weed. Novon: A Journal for Botanical Nomenclature, 16(1), 96-101.
Rosenberg, N. A., Pritchard, J. K., Weber, J. L., Cann, H. M., Kidd, K. K., Zhivotovsky, L. A., & Feldman, M. W. (2002). Genetic structure of human populations.
Science,298(5602), 2381-2385.
Sansom, M., Saborido, A. A., & Dubois, M. (2013). Control of Conyza spp. with glyphosate – a review of the situation in Europe. Plant Protection Science, 49(1), 44-53.
Santos, G., Oliveira Jr., R. S., Constantin, J., Francischini, A. C., & Osipe, J. B. (2014a). Multiple resistance of
Conyza sumatrensis to chlorimuron-ethyl and to
glyphosate. Planta Daninha,32(2), 409-416.
Santos, G., Oliveira Jr., R. S., Constantin, J., Francischini, A. C., Machado, M. F. P. S., Mangolin, C. A., & Nakajima, J. S. (2014b). Conyza sumatrensis: A new weed species resistant to glyphosate in the Americas.
Weed Biology and Management,14(2), 106-114.
Soares, A. A. F., Fregonezi, A. M. D. T., Bassi, D., Mangolin, C. A., Collet, S. A. O., Oliveira Jr., R. S. O., & Machado, M. F. P. S. (2015). Evidence of high gene flow between samples of Conyza canadensis and C.
bonariensis as revealed by isozyme polymorphisms.
Weed Science,63(3), 604-612.
Steckel, L. E., & Gwathmey, C. O. (2009) Glyphosate-Resistant Horseweed (Conyza canadensis) Growth, Seed Production, and Interference in Cotton. Weed Science,57(3), 346-350.
Thebaud, C., & Abbott, R. J. (1995). Characterization of invasive Conyza species (Asteraceae) in Europe: quantitative trait and isozyme analysis. American Journal of Botany,82(3), 360-368.
Thorpe, J. P., & Solé-Cava, A. M. (1994). The use of allozyme electrophoresis in invertebrate systematics.
Zoologica Scripta, 23(1), 3-18.
Vladimirov, V. (2009). Erigeron sumatrensis (Asteraceae): a recently recognized alien species in the Bulgarian flora. Phytologia Balcanica, 15(3), 361-365.
Weaver, S. E. (2001). The biology of Canadian weeds:
Conyza canadensis. Canadian Journal of Plant Science, 81(4), 867-875.
Wright, S. (1965). The interpretation of population structure by F-statistics with special regard to systems of mating. Evolution, 19(3), 395-420.
Xiao-Ling, S., Wu, J., Zhang, H., & Qiang, S. (2011). Occurrence of glyphosate-resistant horseweed (Conyza canadensis) population in China. Agricultural Sciences in China,10(7), 1049-1055.
Yamauti, M. S., Barroso, A. A. M., Souza, M. C., & Alves, P. L. C. A. (2010). Chemical control of glyphosate-resistant horseweed (Conyza canadensis) and hairy fleabane (Conyza bonariensis) biotypes. Revista Ciência Agronômica,41(3), 495-500.
Yeh, F. C., Boyle, T. Y. Z., & Xiyan, J. M. (1999). Popgene Version 1.31: Microsoft Window-based freeware for population genetic analysis. Edmonton, AL: University of Alberta.
Yuan, J., Abercrombie, L., Cao, Y., Halfhill, M., Zhou, X., Peng, Y., & Stewart, C. (2010). Functional genomics analysis of horseweed (Conyza canadensis) with special reference to the evolution of non-target-site glyphosate resistance. Weed Science,58(2), 109-117. Zelaya, I. A., Owen, M. D. K., & Vangessel, M. J. (2007).
Transfer of glyphosate resistance: evidence of hybridization in Conyza (Asteraceae). American Journal of Botany,94(4), 660-673.
Zheng, Q. A., Tai, C., Hu, J., Lin, H., Zhang, R., Su, F., & Yang, X. (2011). Satellite altimeter observations of nonlinear Rossby eddy-Kuroshio interaction at the Luzon Strait. Journal of Oceanography,67(4), 365-376.
Received on August 1, 2016. Accepted on November 23, 2016.