Combination of meta-analysis and graph clustering to identify prognostic
markers of ESCC
Hongyun Gao
1*, Lishan Wang
2*, Shitao Cui
3and Mingsong Wang
3 1Department of Emergency, Shanghai 10th People’s Hospital, Tongji University, Shanghai, China.
2Department of Molecular Biology, Shanghai Jiao Tong University, Shanghai, China.
3
Department of Cardiothoracic Surgery, Shanghai 10th People’s Hospital, Tongji University,
Shanghai, China.
Abstract
Esophageal squamous cell carcinoma (ESCC) is one of the most malignant gastrointestinal cancers and occurs at a high frequency rate in China and other Asian countries. Recently, several molecular markers were identified for pre-dicting ESCC. Notwithstanding, additional prognostic markers, with a clear understanding of their underlying roles, are still required. Through bioinformatics, a graph-clustering method by DPClus was used to detect co-expressed modules. The aim was to identify a set of discriminating genes that could be used for predicting ESCC through graph-clustering and GO-term analysis. The results showed that CXCL12, CYP2C9, TGM3, MAL, S100A9, EMP-1 and SPRR3 were highly associated with ESCC development. In our study, all their predicted roles were in line with previous reports, whereby the assumption that a combination of meta-analysis, graph-clustering and GO-term analy-sis is effective for both identifying differentially expressed genes, and reflecting on their functions in ESCC.
Key words:esophageal squamous cell carcinoma, meta-analysis, graph clustering.
Received: October 16, 2011; Accepted: February 6, 2012.
Introduction
Esophageal squamous cell carcinoma (ESCC) is one of the six most common cancers worldwide, especially in China and other Asian countries (Lehrbachet al., 2003; Zhi
et al., 2003). Despite improvements in detection, surgical techniques and chemoradiotherapy, the five-year survival rate remains low (Katoet al., 2002). Prediction is usually according to tumor, node and metastasis system (TNM) classification. However, TNM classification merely re-flects the status of cancer progression at the time of diagno-sis. In contrast, molecular biological analysis clarifies bio-logical behavior during cancer progression. Thus, the combination of the two could be more accurate in reflecting the clinical outcome (Takenoet al., 2007).
Recently, it was discovered that certain genes could be associated with inadequate ESCC prognosis. For exam-ple, the high expression of CCR7 (Dinget al., 2003), COX2 (Takatoriet al., 2008), Beclin-1 (Chenet al., 2009), TLR9 (Takalaet al., 2011), and FOXC2 (Nishidaet al., 2011), could be significantly correlated with invasion, stage, tu-mor depth, lymph node metastasis, and poor survival.
Overexpression of steroid receptor coactivatior-3(SRC-3) was more frequently observed in primary ESCC in the late T stages (T3/T4) than in the earlier T1/T2 (Xuet al., 2007). Although over-expression of cysteine-rich 61 (Cyr61) was related to less overall survival of patients in stage I/II, there was no affect on the overall survival of patients in stage III/IV (Xieet al., 2011). Low claudin-4 expression was found to be significantly associated with histological dif-ferentiation, invasion depth, and lymph node metastasis. Low claudin-4 expression revealed an unfavorable influ-ence on disease-free and overall survival (Sung et al., 2011). PRL-1 protein expression significantly correlated with the stage of ESCC, 79.4% of the cases (27/34) in stage III ESCC, and 33.3% of the cases (1/3) in stage 1 ESCC (Yuqionget al., 2011).
However, additional molecular prognostic markers are essential as aids in developing more effective therapeu-tic strategies for better prognosis. In this study, the aim was to identify more differentially expressed genes in ESCC, and predict their underlying functions. Meta-analysis pro-vides a powerful tool for analyzing microarray experiments by combining data from multiple studies, besides present-ing unique computational challenges. The Bioconductor package RankProd provides a novel and intuitive tool for this, by detecting differentially expressed genes by means of the non-parametric rank product method (Honget al., 2006). The graphclustering approach was used for
identify-Send correspondence to Shitao Cui. Department of Cardiothoracic Surgery, Shanghai 10th People’s Hospital, Tongji University, n. 301, Yanchang Middle Road, 200072 Shanghai, China. E-mail: [email protected].
*
These authors contributed equally to this paper.
ing gene expression profiles that distinguish ESCC from normal samples. Furthermore, the relevant pathways in the cluster were also analyzed by GO term analysis, to so ex-plain potential mechanisms in response to ESCC.
Data and Methods
Meta-analysis for expression profile and differentially expressed gene (DEG) analysis
Two ESCC related expression profiles, GSE23400 and GSE20347, were obtained separately from a public functional genomics data repository GEO, based on the Affymetrix Human Genome U133A Array and Affymetrix Human Genome U133A 2.0 Array, respectively.
In the GSE23400 dataset, 53 ESCC and 53 matched-normal samples were analyzed. Contributors chose not to include clinical phenotypes in their GEO submission (Suet al., 2011). In the GSE20347 dataset, 17 ESCC and 17 matched-normal samples were approved by the Institu-tional Review Boards of the Shanxi Cancer Hospital, and the US National Cancer Institute (NCI). Cases diagnosed with ESCC between 1998 and 2001 in the Shanxi Cancer Hospital in Taiyuan, Shanxi Province, PR China, and con-sidered candidates for curative surgical resection, were identified and recruited for participation in the study. None of the cases had undergone prior therapy. Shanxi was the ancestral home of all of them. After obtaining informed consent, cases were interviewed, as a means of obtaining information on demographics, cancer risk factors (e.g., smoking, alcohol consumption, and a detailed family his-tory of cancer), and clinical information (Yooet al., 2008; Huet al., 2010).
Statistical analysis
DEGs for the GSE23400 and GSE20347 dataset were first independently identified with the limma method, where-upon the RankProd package was then applied to overcome heterogeneity. Only those with a percentage of false-positives (PFP) (Honget al., 2006) = 1% were considered differentially expressed between treatments and controls.
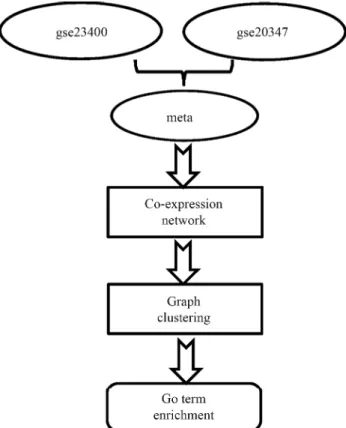
The Spearman rank correlation (r) was used for assay-ing comparative target-gene correlations, to thus demon-strate the potential connection between DEGs. This coeffi-cient (Cureton 1965), which is conceptually similar to the Pearson correlation, measures the strength of the associa-tions between two variables. The significance level was set at r >0.9, which is a more stringent threshold than the empiri-cal value (Fukushimaet al., 2011). Detection of this level was with DPClus. All statistical tests were carried out with the R program. A detailed workflow is shown in Figure 1.
Co-expression Network analysis and graph-clustering
DPClus (Altaf-Ul-Aminet al., 2006), a graph-clus-tering algorithm that can extract densely connected nodes
as a cluster, was used to identify co-expressed groups. It is based on the density-and-periphery tracking of clusters. In this study, the overlapping-mode with DPClus settings was used. The parameter settings of cluster property cp; density values were set to 0.5 (Fukushimaet al., 2011).
GO Term enrichment analysis
The use of Gene Ontology (GO) terms by collaborat-ing databases facilitates uniform queries. The controlled vocabularies are structured for queries at different levels, thereby also facilitating the assignment of properties to genes or gene products, also at different levels, depending on the depth of knowledge involved.
DAVID (Huang daet al., 2009) was used to identify which GO terms were significantly over-represented in the biological process. The terms with p-value <0.05 and count numbers >2 were considered as significant (Boyleet al., 2004; Guoet al., 2006).
Results
Differently expressed gene selection and correlation network construction
The publicly available microarray data sets, GSE23400 and GSE20347, were obtained from GEO.
ferentially expressed genes (DEGs) with fold change >2 and p-value <0.05 were selected by microarray analysis. Following limma method analysis, 519 genes from GSE23400 and 1360 from GSE20347 were selected as DEGs. On applying RankProd packages for meta-analysis, 9 up-regulated genes and 1876 down-regulated ones, with a percentage of false-positives (PFP) 1% and fold change value >2, were considered differentially expressed. 1885 DEGs were finally collected after meta-analysis (Figure 2).
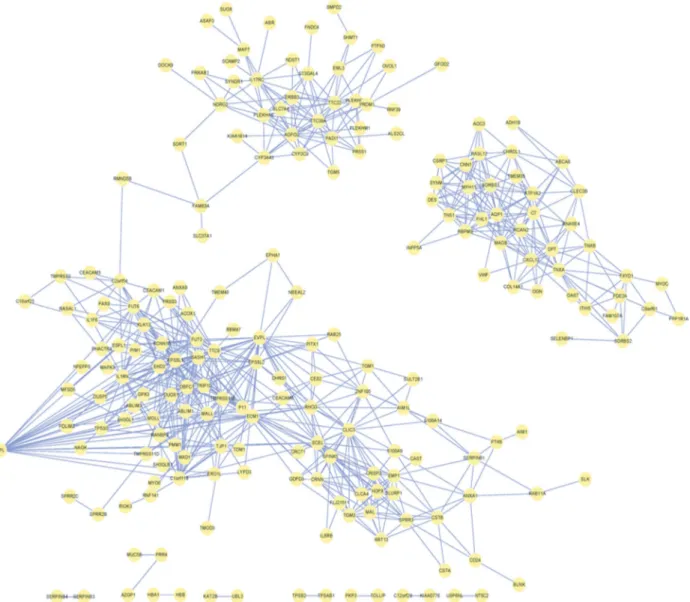
To obtain the relationships among DEGs, the co-expressed value r = 0.9 and corrected p-value = 0.01 were considered as threshold. Finally, a correlation network was constructed from 724 relationships among 202 DEGs (Fig-ure 3).
Graph-clustering identifies modules significantly enriched in biochemical pathways
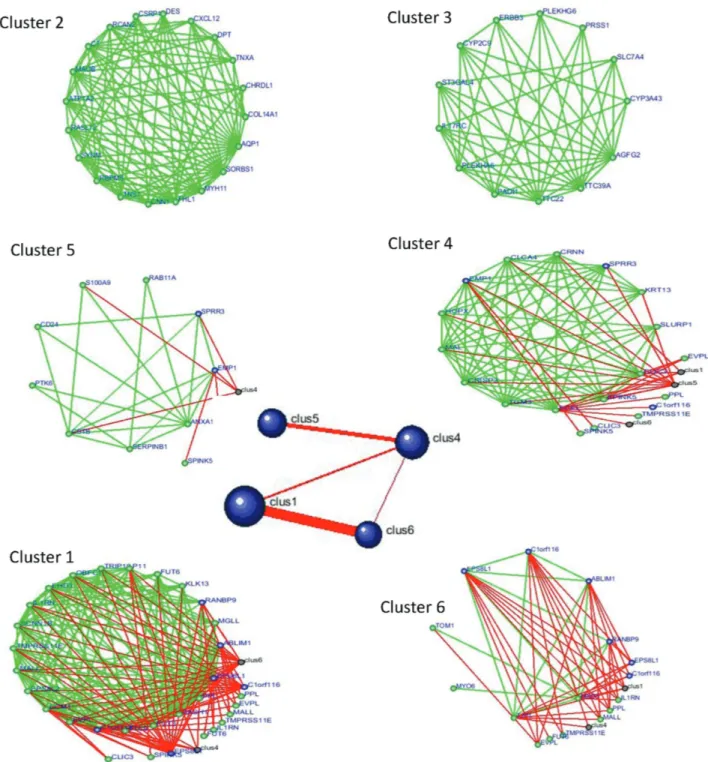
At r >0.9, DPClus (Altaf-Ul-Aminet al., 2006) was used for identifying 6 clusters, ranging in size from 8 to 22
genes, in the correlation network of ESCC (Figure 3). Clus-ters 1, 4, 5 and 6, in particular, have mutual connections since they share the same genes. The more genes shared, the greater mutual connectivity (corresponding to thicker
Figure 2- Differentially expressed genes (DEGs) in gse23400, gse20347 and meta-datasets. The Venn diagram shows significant genes in ESCC.
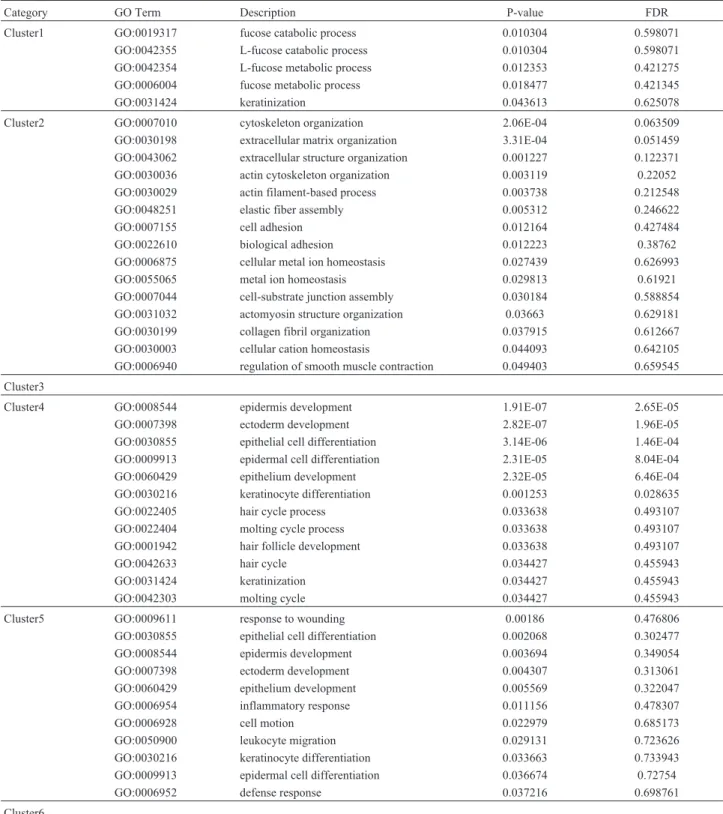
lines). Graph-clustering results are presented in Figure 4. The over-represented GO terms in the clusters were used to assess their significance. The results of graph-clustering by GO term enrichment analysis appear in Table 1.
Significant GO Terms (p-value <0.05, using the hypergeometric test) were listed, as to fucose catabolic pro-cess, cytoskeleton organization, epidermis development, response to injury, etc. (Table 1). Ectoderm development (GO:0007398), epidermis development (GO:0008544) and
epidermal cell differentiation (GO:0009913) were com-monly enriched in clusters 4 and 5. Keratinization (GO:0031424) was enriched in clusters 1 and 4.
Discussion
In this study, 1885 DEGs were first identified through meta-analysis. Among these, a correlation network was con-structed with 202 DEGs producing 724 relationships. By ap-plying graph-clustering, these 202 DEGs were then clustered
into six clusters. Clusters 1, 4, 5 and 6 seemed to be mutually connected. Details of these connections were confirmed by GO-term enrichment analysis, whereby it was shown that the genes of cluster 1 may be involved in the fucose catabolic process, whereas those in clusters 4 and 5 were mainly asso-ciated with epidermis development and differentiation.
Al-though there was no connection between cluster 2 and the others, it was also significantly effective in ESCC invasion and metastasis. The genes in this cluster were related to cytoskeleton and extracellular matrix organization. There-fore, the proposal is to speculate on certain genes in these clusters, identifiably involved in ESCC.
Table 1- List of enriched GO terms in clusters 1 to 6 detected by DPClus.
Category GO Term Description P-value FDR
Cluster1 GO:0019317 fucose catabolic process 0.010304 0.598071
GO:0042355 L-fucose catabolic process 0.010304 0.598071
GO:0042354 L-fucose metabolic process 0.012353 0.421275
GO:0006004 fucose metabolic process 0.018477 0.421345
GO:0031424 keratinization 0.043613 0.625078
Cluster2 GO:0007010 cytoskeleton organization 2.06E-04 0.063509
GO:0030198 extracellular matrix organization 3.31E-04 0.051459
GO:0043062 extracellular structure organization 0.001227 0.122371
GO:0030036 actin cytoskeleton organization 0.003119 0.22052
GO:0030029 actin filament-based process 0.003738 0.212548
GO:0048251 elastic fiber assembly 0.005312 0.246622
GO:0007155 cell adhesion 0.012164 0.427484
GO:0022610 biological adhesion 0.012223 0.38762
GO:0006875 cellular metal ion homeostasis 0.027439 0.626993
GO:0055065 metal ion homeostasis 0.029813 0.61921
GO:0007044 cell-substrate junction assembly 0.030184 0.588854
GO:0031032 actomyosin structure organization 0.03663 0.629181
GO:0030199 collagen fibril organization 0.037915 0.612667
GO:0030003 cellular cation homeostasis 0.044093 0.642105
GO:0006940 regulation of smooth muscle contraction 0.049403 0.659545
Cluster3
Cluster4 GO:0008544 epidermis development 1.91E-07 2.65E-05
GO:0007398 ectoderm development 2.82E-07 1.96E-05
GO:0030855 epithelial cell differentiation 3.14E-06 1.46E-04
GO:0009913 epidermal cell differentiation 2.31E-05 8.04E-04
GO:0060429 epithelium development 2.32E-05 6.46E-04
GO:0030216 keratinocyte differentiation 0.001253 0.028635
GO:0022405 hair cycle process 0.033638 0.493107
GO:0022404 molting cycle process 0.033638 0.493107
GO:0001942 hair follicle development 0.033638 0.493107
GO:0042633 hair cycle 0.034427 0.455943
GO:0031424 keratinization 0.034427 0.455943
GO:0042303 molting cycle 0.034427 0.455943
Cluster5 GO:0009611 response to wounding 0.00186 0.476806
GO:0030855 epithelial cell differentiation 0.002068 0.302477
GO:0008544 epidermis development 0.003694 0.349054
GO:0007398 ectoderm development 0.004307 0.313061
GO:0060429 epithelium development 0.005569 0.322047
GO:0006954 inflammatory response 0.011156 0.478307
GO:0006928 cell motion 0.022979 0.685173
GO:0050900 leukocyte migration 0.029131 0.723626
GO:0030216 keratinocyte differentiation 0.033663 0.733943
GO:0009913 epidermal cell differentiation 0.036674 0.72754
GO:0006952 defense response 0.037216 0.698761
Cluster 2: CXCL12
CXCL12, also known as stromal cell-derived fac-tor-1, was first discovered among the chemokines secreted by mouse bone-marrow stromal cells, with CXCR4 as its specific receptor. The two interact to form a coupled molec-ular pair, which plays a prominent role in regulating direc-tional migration and proliferation in ESCC, where both are positively located within the membrane and cytoplasm (Wanget al., 2009). Expression of the two is significantly correlated with lymph node metastasis, in the tumor stage, gender and lymphatic invasion. The overall and disease-free survival rate is significantly lower in patients with pos-itive CXCL12 expression than in those with negative (Sasakiet al., 2009). Furthermore, the CXCL12-CXCR4 combination possibly induces up-regulated expression of matrix metalloproteinases, whereby their further involve-ment in extracellular matrix modeling and the mediation of metastasis in ESCC, (Zhanget al., 2005a; Bartoloméet al., 2006; Luet al., 2010). Apparently, MMP-7, MMP-9, and MT1-MMP are also closely associated with invasion depth and venous invasion in ESCC (Samantarayet al., 2004). This predicted mechanism was in accordance with our GO-term analysis.
Cluster 3: CYP2C9
In ESCC, higher CYP2C9 expression levels occur in the early tumor stages (pT1/pT2), compared to more ad-vanced local tumors (pT3/pT4). Its selective inhibition de-creases tumor-cell proliferation and G0/G1 phase cell-cycle arrest (Schmelzleet al., 2010). Although, even with GO-term analysis, the role of these genes in cluster 3 remained unknown, the inference is their possible involve-ment in the tumor-cell cycle, in accordance with their func-tion.
Cluster 4: TGM3 and MAL genes
TGM3 is a member of a family of Ca2+-dependent en-zymes, thought to be critically involved in the cross-linking of structural proteins and formation of the cell envelope (CE), thereby contributing to the rigid structures that play vital roles in shape determination and barrier functions. The down-regulation of TGM3 genes in human ESCC tissues may lead to incapacity to form CEs and sustain toxic mate-rial (Chenet al.2000; Luoet al.2004). Although TGM3 expression is significantly inversely correlated with the histological grade of esophageal carcinoma, there is no ob-vious correlation with lymph node metastasis and depth of invasion. So, there is every indication that this gene may be an important adhesion molecule expressed by epithelial cells, and thus regarded as an invasion suppressor molecule in ESCC (Liuet al., 2006). Although details of its role in ESCC were not clear, it is proposed that it may be involved in esophageal epithelial cell differentiation and keratino-cyte differentiation, as previous described (Zhanget al., 2005b). The MAL gene, a T-cell differentiation antigen,
was found to be down-regulated in 10 ESCC-patients bear-ing tumors in different stages of development (Kazemi-Noureiniet al., 2004). It has already been shown to express in four alternatively spliced forms of transcripts during the intermediate and late stages of T-cell differentiation, and in that of epithelial cells (Alonso and Weissman, 1987). Its ectopic expression in carcinoma TE3 cells could lead to the repressed formation of tumors in nude mice, the inhibition of cell motility, and the production of apoptosis by the Fas pathway (Mimoriet al., 2003), whereby the proposal that Mal may be a tumor suppressor gene in ESCC develop-ment.
Cluster 5: S100A9 gene
S100A9, a calcium-binding protein belonging to the S100 family, was detected as significantly down-regulated in ESCC (Jiet al., 2004). Moreover, S100A9 staining is de-creased in poorly and moderately differentiated ESCCs, when compared with those well-differentiated, hence the inferrence that loss of S100A9 expression in ESCC gener-ally occurs along with worsening esophageal epithelial dif-ferentiation in histological grades (Kong et al., 2004). These genes, together with the other 11 S100 genes and epi-dermal differentiation complex (EDC) genes, have been mapped to human chromosome 1q21, which is a region of structural and numerical aberration, involved in esophageal carcinogenesis and progression (Luoet al., 2004). In brief, down-regulation of S100A9 is a common event in esopha-geal carcinogenesis and progression through affecting epi-thelial cell differentiation, proliferation and apoptosis, as well as the expression of genes encoding epidermal struc-tural proteins in a calcium-dependent manner (Luoet al.
2003; Zhiet al., 2003; Zhouet al., 2005).
Common genes in clusters 4 and 5: EMP-1 and SPRR3
might also play important roles in epithelial cell and kera-tinocyte differentiation (Wanget al., 2003).
SPRR3, one of the substrates for TGM3, is a small proline-rich protein, abundantly expressed in oral and eso-phageal epithelia. Its expression, although less concomitant with TGM3 loss in ESCC (Luoet al.2004), is highly in-duced during human epidermal keratinocyte differentia-tion, thus being considered a differentiation marker of squamous epithelium (Abrahamet al., 1996). Recent re-views imply that SPRR3 is frequently down-regulated in ESCC, when compared to adjacent paired mucosa (Chenet al., 2000a; de A Sim oet al., 2011). Further studies have shown that exogenous expression of SPRR3 significantly suppresses ESCC cell formation by inducing CDK11p46 protein expression and apoptosis (Zhang et al., 2008). Therefore, SPRR3 might play a crucial role in the mainte-nance of normal esophageal epithelial homeostasis.
Finally, the combination meta-analysis, graph-clus-tering and GO term analysis is presumedly effective for identifying differentially expressed genes, and speculating on their respective roles in ESCC. Hence, other unidenti-fied genes will be the focus of our future studies.
References
Abraham JM, Wang S, Suzuki H, Jiang HY, Rosenblum-Vos LS, Yin J and Meltzer SJ (1996) Esophagin cDNA cloning and characterization: A tissue-specific member of the small pro-line-rich protein family that is not expressed in esophageal tumors. Cell Growth Diff 7:855-860.
Alonso MA and Weissman SM (1987) cDNA cloning and se-quence of MAL, a hydrophobic protein associated with hu-man T-cell differentiation. Proc Natl Acad Sci USA 84:1997-2001.
Altaf-Ul-Amin M, Shinbo Y, Mihara K, Kurokawa K and Kanaya S (2006) Development and implementation of an algorithm for detection of protein complexes in large interaction net-works. BMC Bioinformatics 7:e207.
Bartolomé RA, Molina-Ortiz I, Samaniego R, Sánchez-Mateos P, Bustelo XR and Teixidó J (2006) Activation of Vav/Rho GTPase signaling by CXCL12 controls membrane-type ma-trix metalloproteinase-dependent melanoma cell invasion. Cancer Res 66:248-258.
Boyle EI, Weng S, Gollub J, Jin H, Botstein D, Cherry JM and Sherlock G (2004) GO: TermFinder – Open source software for accessing Gene Ontology information and finding signif-icantly enriched Gene Ontology terms associated with a list of genes. Bioinformatics 20:3710-3715.
Chen BS, Wang MR, Cai Y, Xu X, Xu ZX, Han YL and Wu M (2000a) Decreased expression of SPRR3 in Chinese human oesophageal cancer. Carcinogenesis 21:2147-2150. Chen BS, Wang MR, Xu X, Cai Y, Xu ZX, Han YL and Wu M
(2000b). Transglutaminase 3, an esophageal cancer-related gene. Int J Cancer 88:862-865.
Chen Y, Lu Y, Lu C and Zhang L (2009) Beclin-1 expression is a predictor of clinical outcome in patients with esophageal squamous cell carcinoma and correlated to Hypoxia-Indu-cible Factor (HIF)-1A expression. Pathol Oncol Res 15:487-493.
Cureton EE (1965) The average Spearman rank correlation when ties are present: A correction. Psychometrika 30:377. de A Simão T, Souza-Santos PT, de Oliveira DS, Bernardo V,
Lima SC, Rapozo DC, Kruel CD, Faria PA, Ribeiro Pinto LF and Albano RM (2011) Quantitative evaluation of SPRR3 expression in esophageal squamous cell carcinoma by qPCR and its potential use as a biomarker. Exp Mol Pathol. 91:584-589.
Ding Y, Shimada Y, Maeda M, Kawabe A, Kaganoi J, Komoto I, Hashimoto Y, Miyake M, Hashida H and Imamura M (2003) Association of CC chemokine receptor 7 with lymph node metastasis of esophageal squamous cell carcinoma. Clin Cancer Res 9:3406-3412.
Fukushima A, Kusano M, Redestig H, Arita M and Saito K (2011) Metabolomic correlation-network modules in Arabidopsis based on a graph-clustering approach. BMC Syst Biol 5:e1. Guo L, Lobenhofer EK, Wang C, Shippy R, Harris SC, Zhang L,
Mei N, Chen T, Herman D, Goodsaid FM,et al.(2006) Rat toxicogenomic study reveals analytical consistency across microarray platforms. Nat Biotechnol 24:1162-1169. Hong F, Breitling R, McEntee CW, Wittner BS, Nemhauser JL
and Chory J (2006) RankProd: A bioconductor package for detecting differentially expressed genes in meta-analysis. Bioinformatics 22:2825-2827.
Hu N, Clifford RJ, Yang HH, Wang C, Goldstein AM, Ding T, Taylor PR and Lee MP (2010) Genome wide analysis of
DNA copy number neutral loss of heterozygosity
(CNNLOH) and its relation to gene expression in esopha-geal squamous cell carcinoma. BMC Genomics 11:e576. Huang da W, Sherman BT and Lempicki RA (2009) Systematic
and integrative analysis of large gene lists using DAVID bioinformatics resources. Nat Prot 4:44-57.
Ji J, Zhao L, Wang X, Zhou C, Ding F, Su L, Zhang C, Mao X, Wu M and Liu Z (2004) Differential expression of S100 gene family in human esophageal squamous cell carcinoma. J Cancer Res Clin Oncol 130:480-486.
Kato K, Hida Y, Miyamoto M, Hashida H, Shinohara T, Itoh T, Okushiba S, Kondo S and Katoh H (2002) Overexpression of caveolin-1 in esophageal squamous cell carcinoma corre-lates with lymph node metastasis and pathologic stage. Can-cer 94:929-933.
Kazemi-Noureini S, Colonna-Romano S, Ziaee AA, Malboobi MA, Yazdanbod M, Setayeshgar P and Maresca B (2004) Differential gene expression between squamous cell carci-noma of esophagus and its normal epithelium; altered pat-tern of mal, akr1c2, and rab11a expression. World J Gas-troenterol 10:1716-1721.
Kong JP, Ding F, Zhou CN, Wang XQ, Miao XP, Wu M and Liu ZH (2004) Loss of related proteins 8 and myeloid-related proteins 14 expression in human esophageal squa-mous cell carcinoma correlates with poor differentiation. World J Gastroenterol 10:1093-1097.
Lehrbach DM, Nita ME and Cecconello I (2003) Molecular as-pects of esophageal squamous cell carcinoma carcinoge-nesis. Arq Gastroenterol 40:256-261.
Liu W, Yu ZC, Cao WF, Ding F and Liu ZH (2006) Functional studies of a novel oncogene TGM3 in human esophageal
squamous cell carcinoma. World J Gastroenterol
12:3929-3932.
metalloproteina-se9/vascular endothelial growth factor in esophageal squa-mous cell cancer. Dis Esophagus 24:283-290.
Luo A, Kong J, Hu G, Liew CC, Xiong M, Wang X, Ji J, Wang T, Zhi H, Wu M,et al.(2004) Discovery of Ca2+-relevant and differentiation-associated genes downregulated in esopha-geal squamous cell carcinoma using cDNA microarray. Oncogene 23:1291-1299.
Mimori K, Shiraishi T, Mashino K, Sonoda H, Yamashita K, Yoshinaga K, Masuda T, Utsunomiya T, Alonso MA, Inoue H,et al.(2003) MAL gene expression in esophageal cancer suppresses motility, invasion and tumorigenicity and en-hances apoptosis through the Fas pathway. Oncogene 22:3463-3471.
Nishida N, Mimori K, Yokobori T, Sudo T, Tanaka F, Shibata K, Ishii H, Doki Y and Mori M (2011) FOXC2 is a novel prog-nostic factor in human esophageal squamous cell carcinoma. Ann Surg Oncol 18:535-542.
Samantaray S, Sharma R, Chattopadhyaya T, Gupta SD and Ralhan R (2004) Increased expression of MMP-2 and MMP-9 in esophageal squamous cell carcinoma. J Cancer Res Clin Oncol 130:37-44.
Sasaki K, Natsugoe S, Ishigami S, Matsumoto M, Okumura H, Setoyama T, Uchikado Y, Kita Y, Tamotsu K, Hanazono K, et al. (2009) Expression of CXCL12 and its receptor CXCR4 in esophageal squamous cell carcinoma. Oncol Rep 21:65-71.
Schmelzle M, Dizdar L, Matthaei H, Baldus SE, Wolters J, Lindenlauf N, Bruns I, Cadeddu RP, Kröpil F, Topp SA,et al.(2010) Esophageal cancer proliferation is mediated by cytochrome P450 2C9 (CYP2C9). Prostaglandins Other Lipid Mediators 94:25-33.
Su H, Hu N, Yang HH, Wang C, Takikita M, Wang QH, Giffen C, Clifford R, Hewitt SM, Shou JZ,et al.(2011) Global gene expression profiling and validation in esophageal squamous cell carcinoma and its association with clinical phenotypes. Clin Cancer Res 17:2955-2966.
Sung CO, Han SY and Kim SH (2011) Low expression of clau-din-4 is associated with poor prognosis in esophageal squa-mous cell carcinoma. Ann Surg Oncol 18:273-281.
Takala H, Kauppila JH, Soini Y, Selander K, Vuopala K, Lehenkari P, Saarnio J and Karttunen T (2011) Toll-like re-ceptor 9 is a novel biomarker for esophageal squamous cell dysplasia and squamous cell carcinoma progression. J In-nate Immun 3:631-638.
Takatori H, Natsugoe S, Okumura H, Matsumoto M, Uchikado Y, Setoyama T, Sasaki K, Tamotsu K, Owaki T, Ishigami S,et al.(2008) Cyclooxygenase-2 expression is related to prog-nosis in patients with esophageal squamous cell carcinoma. Eur J Surg Oncol 34:397-402.
Takeno S, Noguchi T, Takahashi Y, Fumoto S, Shibata T and Kawahara K (2007) Assessment of clinical outcome in pa-tients with esophageal squamous cell carcinoma using TNM classification score and molecular biological classification. Ann Surg Oncol 14:1431-1438.
Wang DF, Lou N, Zeng CG, Zhang X and Chen FJ (2009) Expres-sion of CXCL12/CXCR4 and its correlation to prognosis in esophageal squamous cell carcinoma. Ai Zheng 28:154-158.
Wang HT, Kong JP, Ding F, Wang XQ, Wang MR, Liu LX, Wu M and Liu ZH (2003) Analysis of gene expression profile in-duced by EMP-1 in esophageal cancer cells using cDNA microarray. World J Gastroenterol 9:392-398.
Xie J, Xu L, Wu Z, Li L, Xu X, Wu J, Huang Q and Li E (2011) Expression of cysteine-rich 61 is correlated with poor prog-nosis in patients with esophageal squamous cell carcinoma. Eur J Surg Oncol 37:669-674.
Xu FP, Xie D, Wen JM, Wu HX, Liu YD, Bi J, Lv ZL, Zeng YX and Guan XY (2007) SRC-3/AIB1 protein and gene amplifi-cation levels in human esophageal squamous cell carcino-mas. Cancer Lett 245:69-74.
Yoo YA, Kang MH, Kim JS and Oh SC (2008) Sonic hedgehog signaling promotes motility and invasiveness of gastric can-cer cells through TGF-beta-mediated activation of the ALK5-Smad 3 pathway. Carcinogenesis 29:480-490. Yuqiong L, Xi L, Ke G, Jun-Yi L and Huixiang L (2011)
Expres-sion of phosphatase regenerating Liver-1 in esophageal squamous cell carcinoma associated with metastasis. ISRN Pathology 2011:5402-5408.
Zhang J, Sarkar S and Yong VW (2005a) The chemokine stromal cell derived factor-1 (CXCL12) promotes glioma invasi-veness through MT2-matrix metalloproteinase. Carcinoge-nesis 26:2069-2077.
Zhang J, Hui Ying Z, Fang D, Ai Ping L and Liu ZH (2005b) Transglutaminase 3 expression in C57BL/6J mouse embryo epidermis and the correlation with its differentiation. Cell Res 15:105-110.
Zhang Y, Feng YB, Shen XM, Chen BS, Du XL, Luo ML, Cai Y, Han YL, Xu X, Zhan QM,et al.(2008) Exogenous expres-sion of Esophagin/SPRR3 attenuates the tumorigenicity of esophageal squamous cell carcinoma cells via promoting apoptosis. Int J Cancer 122:260-266.
Zhi H, Zhang J, Hu G, Lu J, Wang X, Zhou C, Wu M and Liu Z (2003) The deregulation of arachidonic acid metabolism-related genes in human esophageal squamous cell carci-noma. Int J Cancer 106:327-333.
Zhou G, Li H, Gong Y, Zhao Y, Cheng J and Lee P (2005) Proteomic analysis of global alteration of protein expression in squamous cell carcinoma of the esophagus. Proteomics 5:3814-3821.
Zinovyeva MV, Monastyrskaya GS, Kopantzev EP, Vinogradova TV, Kostina MB, Sass AV, Filyukova OB, Uspenskaya NY, Sukhikh GT, et al. (2010) Identification of some human genes oppositely regulated during esophageal squamous cell carcinoma formation and human embryonic esophagus de-velopment. Dis Esophagus 23:260-270.
Internet Resources
GEO public functional genomics data repository,
http://www.ncbi.nlm.nih.gov/geo/ (September 27, 2011). R program, http://www.r-project.org/ (September 27, 2011) DPClus graph clustering program, http://kanaya.naist.jp/DPClus
(September 27, 2011)
Gene Ontology, http://www.geneontology.org.
Associate Editor: Jeremy A. Squire