Fibroblast Activation Protein Overexpression
and Clinical Implications in Solid Tumors: A
Meta-Analysis
Fang Liu1, Li Qi2, Bao Liu1, Jie Liu3, Hua Zhang1, DeHai Che1, JingYan Cao1, Jing Shen1, JianXiong Geng1, Yi Bi1,4, LieGuang Ye1, Bo Pan1, Yan Yu1*
1Department of Internal Medical Oncology, The Third Affiliated Hospital of Harbin Medical University, Harbin, China,2Department of Radiation Oncology, The Second Affiliated Hospital of Harbin Medical University, Harbin, China,3Digestion Department of Internal Medicine, General Hospital of Hegang Mining Group, Hegang, Heilonhjiang Province, China,4Emergency Department, Heilongjiang Provincial Electric Power Hospital, Harbin, China
Abstract
Objective
Fibroblast activation protein (FAP) plays a vital role in tumor invasion and metastasis. Previ-ous studies have reported its prognostic value in different tumors. However, the results of these reports remain controversial. In this study, a meta-analysis was performed to clarify this issue.
Methods
A search of the PubMed, Embase and CNKI databases was conducted to analyze relevant articles. The outcomes included the relations between FAP expression and histological dif-ferentiation, tumor invasion, lymph node metastasis, distant metastasis and overall survival (OS). Sensitivity analysis by FAP expression in different cells and tumor types were further subjected to sensitivity analyses as subgroups. Pooled odds ratios (ORs) and hazard ratios (HRs) were evaluated using the random-effects model.
Results
The global analysis included 15 studies concerning various solid tumors. For global analy-sis, FAP overexpression in tumor tissue displayed significant associations with poor OS and tumor progression (OS: HR = 2.18,P= 0.004; tumor invasion: OR = 4.48,P= 0.007; and lymph node metastasis: OR = 3.80,P= 0.004). The subgroup analyses yielded two no-table results. First, the relation between FAP overexpression and poor OS and tumor lymph node metastasis was closer in the patients with FAP expression in tumor cells. Second, the pooled analyses of colorectal cancers or pancreatic cancers all indicated that FAP overex-pression was associated with a detrimental OS (HR: 1.72,P= 0.009; HR: 3.18,P= 0.005, respectively). The magnitude of this effect was not statistically significant compared with that in patients with non-colorectal cancers or non-pancreatic cancers. These analyses did OPEN ACCESS
Citation:Liu F, Qi L, Liu B, Liu J, Zhang H, Che D, et al. (2015) Fibroblast Activation Protein
Overexpression and Clinical Implications in Solid Tumors: A Meta-Analysis. PLoS ONE 10(3): e0116683. doi:10.1371/journal.pone.0116683
Academic Editor:John Green, University Hospital Llandough, UNITED KINGDOM
Received:July 3, 2014
Accepted:December 10, 2014
Published:March 16, 2015
Copyright:© 2015 Liu et al. This is an open access
article distributed under the terms of theCreative
Commons Attribution License, which permits unrestricted use, distribution, and reproduction in any medium, provided the original author and source are credited.
Data Availability Statement:All relevant data are within the paper and its Supporting Information files
(TableS1 PRISMA checklist).
Funding:The authors have no support or funding to report.
not display a statistically significant correlation between FAP expression and histological differentiation and distant metastasis in all of the groups.
Conclusions
FAP expression is associated with worse prognosis in solid tumors, and this association is particularly pronounced if FAP overexpression is found in the tumor cells rather than the stroma.
Introduction
In recent years, the close correlation between cancer and its microenvironment regarding tumor growth, invasion and metastasis has become increasingly apparent [1–3]. Strong experi-mental evidence has shown that stromal fibroblasts, which are an essential component of the tumor microenvironment and which have often been designated as cancer-associated fibro-blasts (CAFs), can promote tumorigenesis and progression through multiple mechanisms, in-cluding proliferation, angiogenesis, invasion, survival and immune suppression [4–6]. Reports continue to accumulate evidence suggesting that FAP, which is an important marker for CAFs, plays a predominant role in the progression of many tumor types [7]. FAP is expressed in reac-tive CAFs in stroma and granulation tissue to promote wound healing. Recently, some studies have reported FAP expression in some cancerous epithelial cells and osteosarcoma tumor cells [8–11]; however, FAP expression was absent in normal adult tissues [12–14]. Thus, the quanti-ty of FAP most likely presents an important prognosis for the clinical behavior of tumors. However, some earlier studies addressing the latter notion provided no consistent conclusion based on single-patient cohorts or on explorative evaluations. Some studies have analyzed both the intensity and proportion of FAP expression by immunohistochemistry (IHC); these studies suggested that stromal FAP expression promoted tumor prognosis and poor survival in some solid tumor types, including colon cancer [15] and pancreatic adenocarcinoma [16]. However, another study concerning colorectal cancer did not obtain statistical significance regarding FAP expression [17]. In 2001, Naohiro et al observed statistical significance regarding FAP ex-pression in breast cancer [18]. Therefore, these results require further exploration to validate FAP expression as a novel prognostic marker and therapeutic target in cancer. In the current study, a comprehensive approach was used, and a meta-analysis was performed to assess the ef-fect of FAP expression on survival and clinicopathological characteristics in solid tumors.
Materials and Methods
Search strategy and study selection
The included articles were published in journals and provided the outcome data of FAP ex-pression and the clinical information of patients. The process of selecting publications is shown inFig. 1. The eligibility criteria were the detection of FAP expression levels by IHC, with cutoff values of FAP overexpression, the availability of primary interest outcomes, odds ratio or hazard ratio values for five of the above-mentioned objectives and publications in the English or Chinese language. The exclusion criteria were as follows: (1) non-normal control studies compared with FAP overexpression; (2) control information that was missing or that could not be acquired by our repeated requests or calculations; (3) studies that did not examine solid tumors; and (4) reviews and letter articles.
Data extraction
Two investigators (Fang Liu and Li Qi) independently screened the articles and extracted the data from the selected studies using standard data-abstraction forms. Any disagreements were resolved through discussion with another reviewer (Yan Yu). When the original data could not
Fig 1. Flow chart of study inclusion.
be found in the published papers, we contacted the authors using the email address provided in the articles.
The following information was collected from each study: the name of the first author, year of publication, country of origin, tumor type, number of patients, clinical stage, presence or ab-sence of adjuvant therapy, treatment outcome, FAP detection method, IHC antibody, FAP lo-cation by IHC staining, FAP-positive case number, cutoff for overexpression, primer case numbers classified according to the cutoff value, ORs with their 95% confidence intervals (95% CIs) for clinicopathological characteristics mentioned previously, and HRs for OS with their 95% CIs. If HRs and 95% CIs were not available directly from a report, then the methods de-scribed by Tierney et al [20] to obtain an indirect estimated value were used. The survival rates were read by the Engauge Digitizer version 4.1 software from Kaplan-Meier curves, and then the data were entered in the spreadsheet appended to the article by Tierney et al for calculation [21].
Coding of categorical variables
Because different scales of FAP IHC staining were observed across the papers, the following rules were applied: (1) when the expression level was encoded as high/low, then no change was applied; (2) for the percentage data of semi-quantitative scoring, staining>10% (++) was
re-garded as high expression and vice versa; (3) when the data were encoded by zero, one, two, and three according to the intensity of FAP staining because of the presence of>two
catego-ries as grading/staging scales, then stages two and three and stages zero and one were grouped as high expression and low expression, respectively.
For histological differentiation, the following category rules were applied: (1) when the his-tological grade was encoded as high-moderate and moderate-poor, then no change was ap-plied; (2) when the grade was encoded by G1, G2 and G3, according to grading scales G1 and G2, G3 was divided accordingly into high grade and low grade; (3) when the grade was encoded by well differentiated, moderately differentiated and poorly differentiated, then well differenti-ated and moderately differentidifferenti-ated, and poorly differentidifferenti-ated were grouped accordingly as high grade and low grade, respectively.
For the state of tumor invasion, when the invasion state was encoded“with/no”, then no change was applied; otherwise, stage T3/4 was considered local tumor invasion, and stage T1/2 was considered no local tumor invasion.
Statistical methods
The meta-analysis was implemented using the STATA 11.0 software. The pooled ORs were computed to evaluate the magnitude of the association between FAP overexpression and poor histological differentiation, tumor invasion, lymph node metastases, and distant metastases. The pooled HRs were calculated to assess the magnitude of the correlation between FAP over-expression and OS. Next, these ORs and HRs were weighted and pooled across studies using corresponding models. The effect of heterogeneity was measured using HigginsI2statistic [22]. A random-effects model (DerSimonian & Laird) was used for meta-analysis when the result of the Q-test (P<0.05 orI2>50%) claimed heterogeneity among the studies. Otherwise, the
fixed-effects model (Mantel and Haenszel) was used.
and group A were compared. The other subgroup analysis was based on each type of cancer, and then that information was compared with other types of cancer. The groups were the colo-rectal cancer group, pancreatic cancer group and other cancer group.
The stability of the pooled results was confirmed by sensitivity analyses. Publication bias was statistically assessed by Begger’s test (P<0.05 indicated significant publication bias) and
depicted by funnel plots.
Results
Description of studies
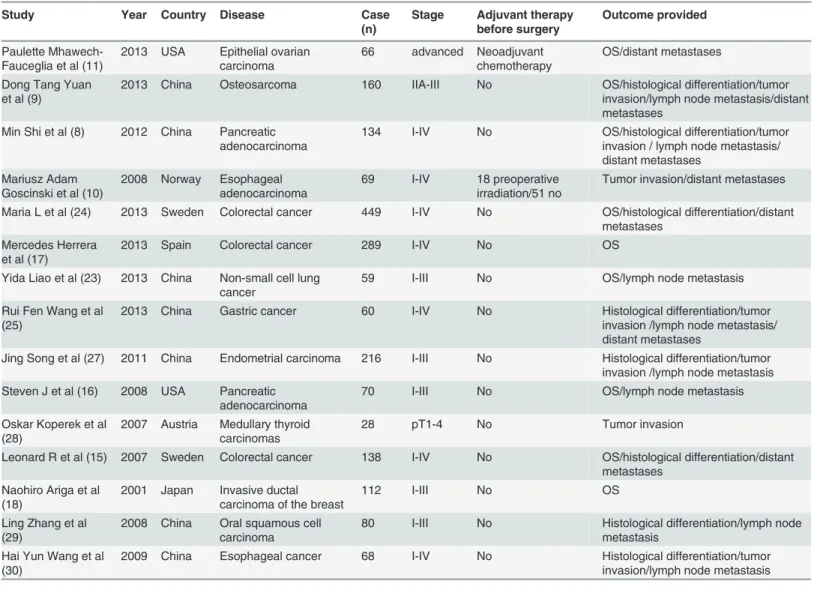
Fifteen studies that used IHC techniques for the assessment of FAP expression levels and loca-tion were identified. In total, 1,998 patients in seven states were included in our meta-analysis. The clinical characteristics of the included studies are listed inTable 1. The analysis included eleven solid tumor types: colorectal cancer, pancreatic adenocarcinoma, non-small cell lung
Table 1. Studies and clinical information of patients included in this meta-analysis.
Study Year Country Disease Case
(n)
Stage Adjuvant therapy
before surgery
Outcome provided
Paulette Mhawech-Fauceglia et al (11)
2013 USA Epithelial ovarian carcinoma
66 advanced Neoadjuvant chemotherapy
OS/distant metastases
Dong Tang Yuan et al (9)
2013 China Osteosarcoma 160 IIA-III No OS/histological differentiation/tumor invasion/lymph node metastasis/distant metastases
Min Shi et al (8) 2012 China Pancreatic adenocarcinoma
134 I-IV No OS/histological differentiation/tumor invasion / lymph node metastasis/ distant metastases
Mariusz Adam Goscinski et al (10)
2008 Norway Esophageal adenocarcinoma
69 I-IV 18 preoperative irradiation/51 no
Tumor invasion/distant metastases
Maria L et al (24) 2013 Sweden Colorectal cancer 449 I-IV No OS/histological differentiation/distant metastases
Mercedes Herrera et al (17)
2013 Spain Colorectal cancer 289 I-IV No OS
Yida Liao et al (23) 2013 China Non-small cell lung cancer
59 I-III No OS/lymph node metastasis
Rui Fen Wang et al (25)
2013 China Gastric cancer 60 I-IV No Histological differentiation/tumor invasion /lymph node metastasis/ distant metastases
Jing Song et al (27) 2011 China Endometrial carcinoma 216 I-III No Histological differentiation/tumor invasion /lymph node metastasis Steven J et al (16) 2008 USA Pancreatic
adenocarcinoma
70 I-III No OS/lymph node metastasis
Oskar Koperek et al (28)
2007 Austria Medullary thyroid carcinomas
28 pT1-4 No Tumor invasion
Leonard R et al (15) 2007 Sweden Colorectal cancer 138 I-IV No OS/histological differentiation/distant metastases
Naohiro Ariga et al (18)
2001 Japan Invasive ductal carcinoma of the breast
112 I-III No OS
Ling Zhang et al (29)
2008 China Oral squamous cell carcinoma
80 I-III No Histological differentiation/lymph node metastasis
Hai Yun Wang et al (30)
2009 China Esophageal cancer 68 I-IV No Histological differentiation/tumor invasion/lymph node metastasis
Abbreviations: OS, overall survival.
cancer, esophageal cancer, gastric cancer, ovarian carcinoma, breast cancer, medullary thyroid carcinomas, endometrial carcinoma, oral squamous cell carcinoma, and osteosarcoma. In total, 1,914 patients (95.80%) were not treated before surgery. Sixty-six and 18 patients underwent neoadjuvant chemotherapy and preoperative irradiation, respectively. The laboratory informa-tion from the selected studies is presented inTable 2. Tissue specimensapp:ds:specimen from 13 studies were obtained from surgical procedures, and the specimens from two studies were collected at the Department of Pathology [28,30].
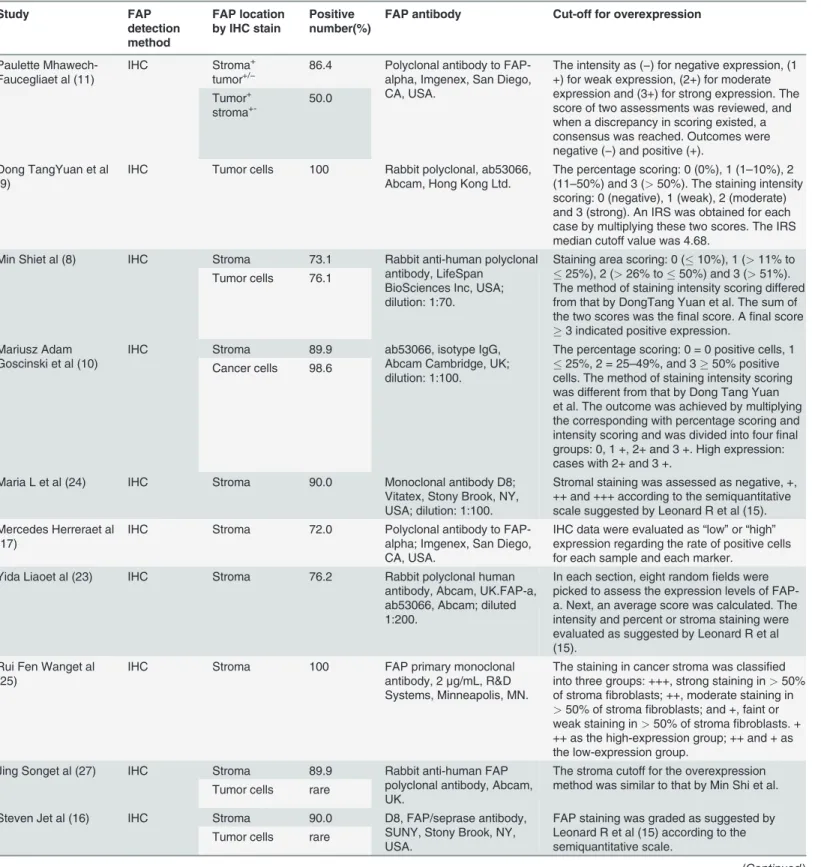
The IHC method was used to detect FAP expression in the tumor tissues of patients. De-scriptions of the antibodies used in the included studies are provided inTable 2. Staining with various antibodies was used to evaluate the FAP expression levels and expression status in tumor cells and/or in stroma, although four studies used antibody ab53066 [9,7,10,23], and an-other four studies used antibody D8 [15,16,18,24]. Some studies used a combined evaluation of cytoplasmic and membrane staining for determining the FAP expression status. The cutoff for overexpression depended on the staining score and on the method used. Because of the high test results of the total heterogeneity in all category analyses (I2>50%,P>0.05,Fig. 2), the
random-effects model was used to assess the correlation between FAP expression and survival and clinicopathological characteristics.
Histological differentiation
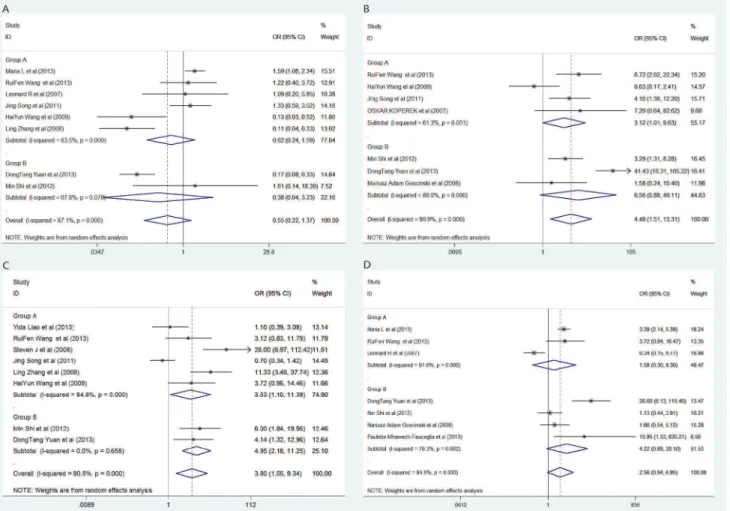
Eight studies that included 1,305 patients could be used to analyze the relation between FAP expression and the histological differentiation of the solid tumors (Table 3). The patient-pooled analysis revealed that the FAP expression level did not significantly correlate with tumor histo-logical differentiation (OR: 0.55, 95% CI: 0.22–1.37,P= 0.197;Fig. 2A). Further stratificatio-napp:addword:stratification analysis revealed no observable correlation in group A (OR: 0.62,
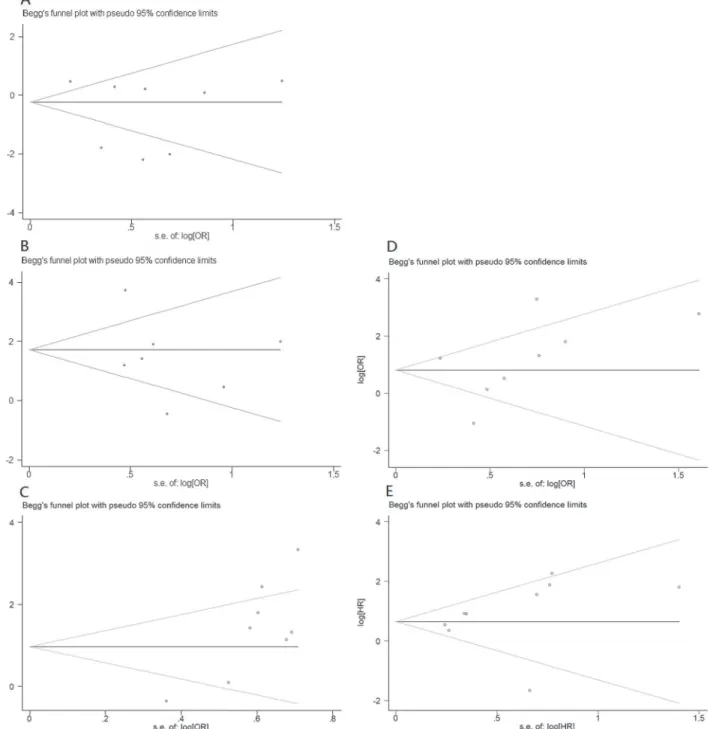
P= 0.323) or in group B (OR: 0.38,P= 0.375;Fig. 3A). The funnel plot revealed that the statis-tical results did not demonstrate publication bias (PBegg= 0.805 for all patients;Fig. 4A;
Table 3).
State of tumor invasion
Seven trials that included 735 subjects were eligible for the final analysis. Four trials were in-cluded in group A, and three were inin-cluded in group B (Table 3). The pooled outcome from all patients indicated that the patients with high FAP expression had a higher ratio of local tumor invasion than those patients with low FAP expression (OR: 4.48,P= 0.007;Fig. 2B). In addi-tion, the stratified analysis, which located FAP-expressing cells, demonstrated a similar correla-tion in group A (OR: 3.12,P= 0.048;Fig. 3B). Nevertheless, in group B, the statistical outcomes revealed that patients with FAP overexpression in tumor cells had a greater risk of local tumor invasion than those patients with FAP overexpression in stroma cells in group A (OR: 6.56). However, this difference was not statistically significant (95% CI: 0.88–49.1,P= 0.067). No publication bias was observed, as determined by the funnel plot (PBegg= 0.652 for all patients;
Fig. 4B;Table 3).
Lymph node metastases
Eight trials that included 847 patients assessed lymph node metastasis. High FAP expression in all patients significantly increased the risk of lymph node metastasis (OR: 3.80,P= 0.004; Fig. 2C). Further stratification analysis indicated that the patients with FAP overexpression in group B had a greater risk of lymph node metastasis than those patients in group A (OR: 4.95,
Table 2. Evaluation and outcomes of FAP expression by IHC in the selected studies.
Study FAP
detection method
FAP location by IHC stain
Positive number(%)
FAP antibody Cut-off for overexpression
Paulette Mhawech-Faucegliaet al (11)
IHC Stroma+
tumor+/−
86.4 Polyclonal antibody to FAP-alpha, Imgenex, San Diego, CA, USA.
The intensity as (−) for negative expression, (1
+) for weak expression, (2+) for moderate expression and (3+) for strong expression. The score of two assessments was reviewed, and when a discrepancy in scoring existed, a consensus was reached. Outcomes were negative (−) and positive (+).
Tumor+
stroma+- 50.0
Dong TangYuan et al (9)
IHC Tumor cells 100 Rabbit polyclonal, ab53066, Abcam, Hong Kong Ltd.
The percentage scoring: 0 (0%), 1 (1–10%), 2 (11–50%) and 3 (>50%). The staining intensity
scoring: 0 (negative), 1 (weak), 2 (moderate) and 3 (strong). An IRS was obtained for each case by multiplying these two scores. The IRS median cutoff value was 4.68.
Min Shiet al (8) IHC Stroma 73.1 Rabbit anti-human polyclonal antibody, LifeSpan
BioSciences Inc, USA; dilution: 1:70.
Staining area scoring: 0 (10%), 1 (>11% to 25%), 2 (>26% to50%) and 3 (>51%).
The method of staining intensity scoring differed from that by DongTang Yuan et al. The sum of the two scores was thefinal score. Afinal score
3 indicated positive expression. Tumor cells 76.1
Mariusz Adam Goscinski et al (10)
IHC Stroma 89.9 ab53066, isotype IgG,
Abcam Cambridge, UK; dilution: 1:100.
The percentage scoring: 0 = 0 positive cells, 1
25%, 2 = 25–49%, and 350% positive cells. The method of staining intensity scoring was different from that by Dong Tang Yuan et al. The outcome was achieved by multiplying the corresponding with percentage scoring and intensity scoring and was divided into fourfinal groups: 0, 1 +, 2+ and 3 +. High expression: cases with 2+ and 3 +.
Cancer cells 98.6
Maria L et al (24) IHC Stroma 90.0 Monoclonal antibody D8; Vitatex, Stony Brook, NY, USA; dilution: 1:100.
Stromal staining was assessed as negative, +, ++ and +++ according to the semiquantitative scale suggested by Leonard R et al (15). Mercedes Herreraet al
(17)
IHC Stroma 72.0 Polyclonal antibody to
FAP-alpha; Imgenex, San Diego, CA, USA.
IHC data were evaluated as“low”or“high” expression regarding the rate of positive cells for each sample and each marker.
Yida Liaoet al (23) IHC Stroma 76.2 Rabbit polyclonal human antibody, Abcam, UK.FAP-a, ab53066, Abcam; diluted 1:200.
In each section, eight randomfields were picked to assess the expression levels of FAP-a. Next, an average score was calculated. The intensity and percent or stroma staining were evaluated as suggested by Leonard R et al (15).
Rui Fen Wanget al (25)
IHC Stroma 100 FAP primary monoclonal
antibody, 2μg/mL, R&D Systems, Minneapolis, MN.
The staining in cancer stroma was classified into three groups: +++, strong staining in>50%
of stromafibroblasts; ++, moderate staining in
>50% of stromafibroblasts; and +, faint or
weak staining in>50% of stromafibroblasts. +
++ as the high-expression group; ++ and + as the low-expression group.
Jing Songet al (27) IHC Stroma 89.9 Rabbit anti-human FAP polyclonal antibody, Abcam, UK.
The stroma cutoff for the overexpression method was similar to that by Min Shi et al. Tumor cells rare
Steven Jet al (16) IHC Stroma 90.0 D8, FAP/seprase antibody, SUNY, Stony Brook, NY, USA.
FAP staining was graded as suggested by Leonard R et al (15) according to the semiquantitative scale.
Tumor cells rare
signs of publication bias, as determined by the funnel plot (PBegg= 0.048 for all patients;
Fig. 4C;Table 3).
Distant metastases
Data from seven studies that included 1,076 patients were applicable for distant metastasis analysis and subgroup analysis. As shown in Figs.2Dand3D, high FAP expression significant-ly increased the risk of distant metastases in all patients (OR: 2.56). This risk was predominant-ly enhanced in group B (OR: 4.22), with no statisticalpredominant-ly significant difference (CIall patients:
0.94–6.95,Pall patients= 0.065; CIgroup B: 0.89–20.10,Pgroup B= 0.07;Table 3). Nevertheless, in
group A, which included three studies with 647 patients, FAP expression did not correlate with distant metastases of the tumors (OR = 1.58, CI: 0.30–8.30,P= 0.588). The funnel plot indicat-ed no publication bias (PBegg= 0.293 for all eight patients included in the studies;Fig. 4D;
Table 3).
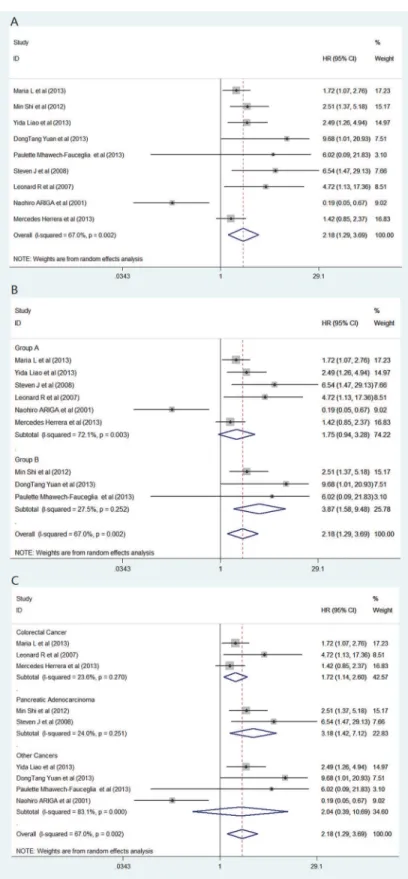
Overall survival
Nine studies that included 1,490 patients were eligible for the analysis. As shown inFig. 5A, the pooled outcome for all patients indicated a significant correlation between the patients with FAP overexpression and poor OS (HR = 2.18, CI: 1.29–3.69,P= 0.588). The stratified analysis according to FAP expression status demonstrated a closer correlation to the patients with FAP overexpression in tumor cells (HRgroup B: 3.87, CI: 1.58–9.48). Additionally, a statistically Table 2. (Continued)
Study FAP
detection method
FAP location by IHC stain
Positive number(%)
FAP antibody Cut-off for overexpression
Oskar Kopereket al (28)
IHC Peritumoral
Stroma
92.9 F19, mouse host; dilution 1:20; Garin-Chesa.
According to the semiquantitative scale immunoreactivity was graded as follows: negative (-), weak (+), moderate (++) and strong (+++). (+ +) and (+++) were the high-expression group.
Intratumoral Stroma
78.6
Leonard Ret al (15) IHC Stroma 93.0 Rabbit anti-human FAP monoclonal antibody D8.
Using semiquantitative analysis, stromal staining was different from that by Dong Tang Yuan et al. Groups scored with 0 or 1 staining were compared with those with greater (2 or 3) staining.
NaohiroArigaet al (18) IHC Stroma 54.0 Using all MAbs (D8, D28, D43 and F19).
Expression in the stromal area was semiquantitatively analyzed using the same method as Leonard R et al (15). Cases were classified as (-) and (+) for scanty expression. (+) and (++) were classified as abundant expression.
Ling Zhanget al (29) IHC Stroma 65.0 Anti-human rat neomarkers, Abnoval.
Each section (×200) hadfive horizons in tumor concentration areas. An FAP positive cell percentage was calculated in a horizon:>5%
was positive;<5% was negative.
Hai Yun Wang et al (30)
IHC Stroma 83.0 Rabbit anti-human FAP
polyclonal antibody, Abcam, UK.
From each section,five horizons were chosen in the tumor concentration areas, and the FAP positive cell percentage was calculated in a horizons.>10% was positive;<10% was
negative. Five horizons per section was the average number.
Abbreviations: FAP,fibroblast activation protein; IHC, immunohistochemistry.
Fig 2. Forest plot of clinicopathological characteristics and FAP expression in patients with solid tumors.(A) histological differentiation; (B) tumor invasion; (C) lymph node metastasis; (D) distant metastases. OR, odds ratio; 95% CI, 95% confidence interval.
doi:10.1371/journal.pone.0116683.g002
Table 3. Association between FAP expression and the clinical characteristics of tumors.
Histological differentiation Depth of tumor invasion
Study* Patient OR(95% CI) P Study* Patient OR(95% CI) P
All studies 8 1305 0.55 (0.22–1.37) 0.197 7 735 4.48 (1.51–13.31) 0.007
Group A 6 1011 0.62 (0.24–1.59) 0.323 4 372 3.12 (1.01–9.63) 0.048
Group B 2 294 0.38 (0.04–3.23) 0.375 3 363 6.56 (0.88–49.11) 0.067
Deviations 0.805# 0.652#
Lymph node metastasis Distant Metastases
Study* Patient OR(95% CI) P Study* Patient OR(95% CI) P
All studies 8 847 3.80 (1.55–9.34) 0.004 7 1076 2.56 (0.94–6.95) 0.065
Group A 6 553 3.53 (1.10–11.39) 0.035 3 647 1.58 (0.30–8.30) 0.588
Group B 2 292 4.95 (2.18–11.25) <0.001 4 429 4.22 (0.89–20.10) 0.070
Deviations 0.048 0.293#
Abbreviations: OR, odds ratio; HR, hazard ratio; CI: confidence interval. *Study: The number of studies included in the analysis.
#P>0.05 indicates no publication bias.
significant difference was observed for the patients in group A (P= 0.004;Table 4). Neverthe-less, in group A, the statistical outcomes revealed that patients with FAP overexpression only in stroma tumors had a tendency of poor survival (HR: 1.75, CI: 0.94–3.28) and that this effect was not statistically significant (P= 0.08).
In addition, sensitivity analysis by tumor type indicated that an association between FAP overexpression and poor survival was evident for the three colorectal studies (HR: 1.72, 95% CI: 1.58–9.48,P= 0.009) (Fig. 5C;Table 4). This deviation from the pooled estimate was not statistically different from that of non-colorectal cancers (subgroup differenceP= 0.699). Compared with low FAP expression, the pooled analyses of the two pancreatic cancer studies indicated that FAP overexpression was associated with a greater detrimental outcome (HR: 3.18, 95% CI: 1.42–7.12,P= 0.005). The magnitude of this effect was not statistically significant compared with that in non-pancreatic cancers (subgroup difference:P= 0. 864) (Fig. 5C; Table 4). The funnel plot indicated no significant publication bias (PBegg= 0.095;Fig. 4E;
Table 4).
Fig 3. Forest plot of clinicopathological characteristics and FAP expression in solid tumors by the stratification analysis based on FAP
expression cell.(A) histological differentiation; (B) tumor invasion; (C) lymph node metastasis; (D) distant metastases. Group B includes patients with FAP expression in tumor cells and in or not in tumor stroma. Group A includes patients with FAP expression in tumor stroma but not in tumor cells. Abbreviations: OR, odds ratio; HR, hazard ratio; 95% CI, 95% confidence interval.
Discussion
In the present global meta-analysis of patients with solid tumors, FAP javascript:void(0);over-expression displayed a significant association with poor overall survival, which was linked to tumor progression risks, causing increased odds ratios of tumor invasion and lymph node me-tastasis. Further subgroup analysis based on the FAP expression status in different cells re-vealed that the patients with FAP overexpression in tumor cells had a higher risk of poor
Fig 4. Begger’s funnel plot for trials comparing the effect of FAP expression in solid tumors on (A) poor histological differentiation; (B) tumor invasion; (C) lymph node metastasis; (D) distant metastases; (E) overall survival.Abbreviations: OR, odds ratio; HR, hazard ratio.
Fig 5. Forest plot of overall survival and FAP expression in solid tumors.(A) Forest plot of pooled total studies; (B) subgroup analysis by FAP expression status in different cells; (C) subgroup analysis by tumor type.
overall survival and greater odds ratios of lymph node metastases. In those patients with FAP expression only in stroma tumors, although tumor invasion and lymph node metastasis corre-lated with FAP overexpression, the overall survival of these patients was not statistically signifi-cant compared with that in patients with lower FAP expression. The patients with FAP overexpression (particularly expression in tumor cells) tended to have a higher risk of distant metastases; however, this risk was not significantly different from those of the other groups. Nevertheless, the pooled statistical result demonstrated that FAP expression had no significant correlation with the histological differentiation of the tumors in any group.
In addition, although colorectal cancer or pancreatic cancer was associated with FAP over-expression and poor survival, sensitivity analysis by tumor type indicated that the effect was not statistically significant compared with that in non-colorectal cancers or non-pancreatic cancers. Thus, the association between FAP overexpression and other tumor types was not evident.
Previous studies have demonstrated that cancer tissues are composed not only of cancer cells but also of cancer-associated stromal cells, including fibroblasts, extracellular matrix mol-ecules, endothelial cells and immune cells [11,26]. Moreover, the occurrence and development of tumors are not only determined unilaterally by epithelial or mesenchymal cells but also by the equilibrium state created by the interaction of a tumor and the host interface of a tumor’s microenvironment [31,32]. Therefore, in recent years, increased attention has been given to the host interface of a tumor’s microenvironment, which was considered as important as can-cer cells themselves in the progression and metastasis of tumors. Based on strong experimental evidence, CAFs, which are essential components of the tumor microenvironment, were shown to play an important role in both tumor progression and the regulation of the tumor microen-vironment by the secretion of soluble factors, such as FAP and extracellular matrix modifiers [33]. FAP, which is a membrane serine protease, is considered an important marker of activat-ed CAFs during tissue remodeling [34]. In addition, FAP expression can be inducactivat-ed in non-transformed, activated stromal fibroblasts but is not expressed in fibroblasts in normal tissues [35]. Particularly in human malignancies, FAP expression is often detected on the surface of fi-broblasts surrounding epithelial cancers, including pancreatic cancer [36], colon cancer [17], prostate cancer [37], breast cancer [38] and skin cancer [39], as well as in some bone sarcomas and soft tissues [40]. Notably, some reports have observed FAP overexpression in both cancer cells and adjacent stroma [41–43]. Functionally, FAP can enhance stromal cell proliferation and invasiveness and affect cell apoptosis primarily when this protein correlates with increased tumorigenicity due to the proteolysis of the extracellular cell matrix (ECM) [9,10]. The
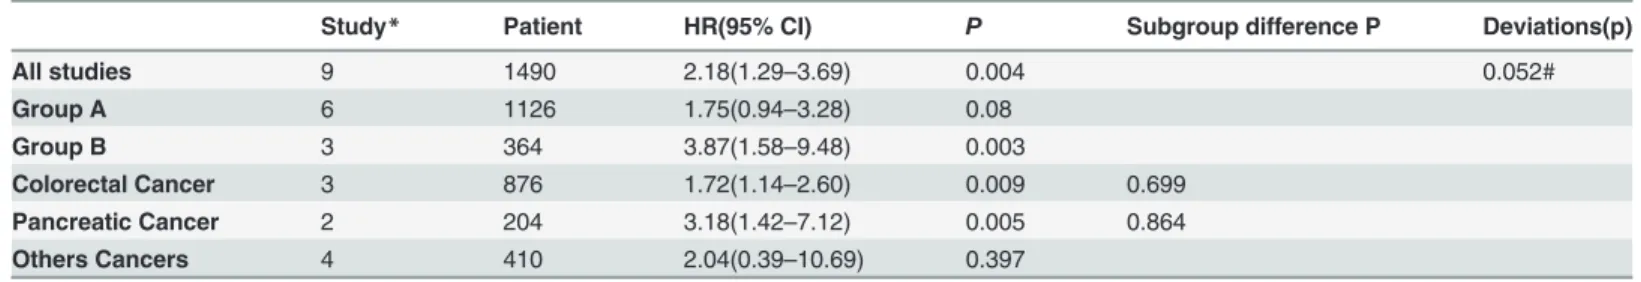
cancer-Table 4. The association between FAP expression and the overall survival of patients with solid tumors.
Study* Patient HR(95% CI) P Subgroup difference P Deviations(p)
All studies 9 1490 2.18(1.29–3.69) 0.004 0.052#
Group A 6 1126 1.75(0.94–3.28) 0.08
Group B 3 364 3.87(1.58–9.48) 0.003
Colorectal Cancer 3 876 1.72(1.14–2.60) 0.009 0.699
Pancreatic Cancer 2 204 3.18(1.42–7.12) 0.005 0.864
Others Cancers 4 410 2.04(0.39–10.69) 0.397
Abbreviations: HR, hazard ratio; CI: confidence interval. *Study: The number of studies included in the analysis. #P>0.05 means no publication bias.
specific distribution and function of FAP make this protein eligible as a novel prognostic mark-er and thmark-erapeutic target in tumors. Previously, sevmark-eral studies reported the relation between FAP overexpression and the clinical characteristics and outcome in solid tumor patients. Un-fortunately, the results differed among various studies, and no consensus has been reached. Moreover, prior research regarding small-molecule inhibition of FAP was not as effective as ex-pected [44]. However, recent studies targeting FAP using a novel FAP-activated prodrug that alters the activation of a cytotoxic compound in the tumor stroma [45] have reported promis-ing results. Therefore, the effect of FAP overexpression on tumor stroma or tumor cells or on different types of tumors requires further assessment.
In this study, positive FAP expression ranged between 50% and 100% (Table 2). FAP was not only consistently expressed in the peritumoral and intratumoral stromal compartment of carcinomas but also in some types of tumor cells, such as pancreatic adenocarcinoma, osteosar-coma, esophageal adenocarcinoma and epithelial ovarian carcinoma [8,10–11]. In osteosarco-ma, FAP expression occurred only in tumor cells [9]. FAP expression was detected rarely in some cancer cells, such as differentiated carcinomas [16] and endometrial carcinoma [27]. In other studies, FAP expression was only reported in stroma tumors [15,17–18,23–25,28–30]. Levels of FAP overexpression ranged between 54% and 93% in stroma tumors and between 50% and 100% in tumor cells. In the peritumoral compartment, FAP expression was predomi-nantly found in adjacent CAFs close to tumor cells, with less expression in the surrounding CAFs [8]. In addition, stromal FAP expression was found in endothelial and lymphoid cells in esophageal adenocarcinoma [10]. FAP immunostaining was primarily localized on the cell membrane and in the cytoplasm of tumor cells and CAFs [9], as well as occasionally in the gland lumens [8]. Thus, different cellular and subcellular FAP expression patterns are the foun-dation of stratification meta-analysis.
expression and many-sided clinical implications in solid tumors. Fifth, this study is the first meta-analysis of the effect of FAP expression on the survival and clinicopathological character-istics of patients with solid tumors. Moreover, this study performed innovative subgroup analy-ses in patients with FAP overexpression in tumor cells or with different types of cancers, and the expected results were obtained. Finally, the analyses emphasized the value of identifying surrogate markers of FAP activation. This study and others [8,15,16,23,24] have suggested that FAP overexpression in tumor, particularly in tumor cells, is a potential key marker.
Nevertheless, several limitations of this meta-analysis should be noted. First, because this study is a literature-based analysis regarding different types of tumors, the potential for publi-cation bias exists because positive results were predominantly published, inflating this study’s final estimate. Second, differences in including tumors affecting different organs, several char-acteristics of the study designs, and the inclusion of patients whose treatment included adju-vant therapy may have caused wide heterogeneity in the results among the included studies. Stratified analysis of each analysis characteristic corresponding to a tumor type or treatment-related factors would be helpful to reduce the heterogeneity and to improve the quality of the meta-analysis. However, limited studies provided information concerning FAP expression by subgroups; thus, such analyses are impossible. Finally, the role of FAP interactions with the tumor environment [51] was not assessed in this analysis because the original data from the se-lected studies did not contain such information.
In conclusion, this meta-analysis indicated that patients with FAP overexpression in solid tumors have a higher risk of cancer lymph node metastasis and worse prognosis than patients with low FAP expression. The relationship between FAP and poor prognosis may be stronger in those patients with FAP overexpression in tumor cells relative to patients with FAP overex-pression in stroma”. The association between FAP overexoverex-pression and a detrimental OS in co-lorectal cancers and pancreatic cancers is similar to that observed for pooled non-coco-lorectal cancers and non-pancreatic cancers, respectively. This analysis suggests that FAP may be a promising therapeutic approach for developing strategies against this protein, not only aiming at its interstitial expression in the tumor microenvironment but also in tumor cells. Further re-search must be conducted to ascertain the accuracy of the analysis data from this study regard-ing tumor types or by further prospective studies with larger sample sizes.
Supporting Information
S1 PRISMA Checklist. PRISMA 2009 Checklist.
(DOC)
Author Contributions
Conceived and designed the experiments: FL YY DC. Performed the experiments: FL BP LY YB JL BL JS. Analyzed the data: FL LQ JG. Contributed reagents/materials/analysis tools: FL LQ HZ. Wrote the paper: FL BP YB JG. Contributed to the revising of the manuscript: CJ FL HZ.
References
1. Ostman A, Augsten M (2009) Cancer-associated fibroblasts and tumor growth—bystanders turning into key players. Curr Oping Genet Dev 19: 67–73. doi:10.1016/j.gde.2009.01.003PMID:19211240
2. Sund M, kalluri R (2009) Tumor stroma derived biomarkers in cancer. Cancer Metastasis Rev 28: 177– 183. doi:10.1007/s10555-008-9175-2PMID:19259624
4. Kidd S, Spaeth E, Watson K, Burks J, Lu H, et al. (2012) Origins of the Tumor Microenvironment: Quan-titative Assessment of Adipose-Derived and Bone Marrow–Derived Stroma. PLoS ONE 7: e30563. doi:10.1371/journal.pone.0030563PMID:22363446
5. Kalluri R, Zeisberg Ml (2006) Fibroblasts in cancer. Nat Rev Cancer 6:392–401. PMID:16572188
6. Franco OE, Shaw AK, Strand DW, Hayward SW (2012) Cancer associated fibroblasts are a rate-limit-ing determinant for tumour progression. Semin Cell Dev Biol 21:33–39.
7. Susumu S, Yuji T, Koji T, Takeshi Y, Yoshinaga O, et al. (2011) Cancer-associated fibroblasts correlate with poor prognosis in rectal cancer after chemoradiotherapy. Int J Oncol 38: 655–663. doi:10.3892/ ijo.2011.906PMID:21240461
8. Shi M, Yu DH, Chen Y, Chen YZ, Jing Z, et al. (2012) Expression of fibroblast activation protein in human pancreatic adenocarcinoma and its clinicopathological significance. World J Gastroenterol 18:840–846. doi:10.3748/wjg.v18.i8.840PMID:22371645
9. Yuan DT, Liu BB, Liu KX, Guotai Z, Zhtang D, et al (2013) Overexpression of fibroblast activation pro-tein and its clinical implications in patients with osteosarcoma. J Surg Oncol 108: 157–162. doi:10. 1002/jso.23368PMID:23813624
10. Goscinski MA, Suo ZH, Flørenes VA, Ljiljana V, Jahn MN, et al. (2008) FAP- a and uPA Show Different
expression patterns in premalignant and malignant esophageal lesions. Ultrastruct Pathol 32: 89–96. doi:10.1080/01913120802034934PMID:18570153
11. Paulette MF, Wang D, Samrao D, Grace K, Kate L, et al. (2013) Clinical implications of marker expres-sion of carcinoma-Associated fibroblasts (CAFs) in patientes with epithelial ovarian carcinoma after treatment with neoadjuvant chemotherapy. Cancer Microenvironment. Accessed. public online: 10 no-vember 2013.
12. Brennen WN, Rosen DM, Wang H, Isaacs JT, Denmeade SR (2012) Targeting carcinoma-associated fibroblasts within the tumor stroma with a fibroblast activation protein-activated prodrug. J Natl Cancer Inst 104:1320–1334. doi:10.1093/jnci/djs336PMID:22911669
13. O’Brien P, O’Connor BFl (2008) Seprase: an overview of an important matrix serine protease. Biochim Biophys Acta 1784:1130–1145. doi:10.1016/j.bbapap.2008.01.006PMID:18262497
14. Yu DM, Yao TW, Chowdhury S, Nadvi NA, Osborne B, et al (2010) The dipeptidyl peptidase IV family in cancer and cell biology. FEBS J 277: 1126–1144. doi:10.1111/j.1742-4658.2009.07526.xPMID: 20074209
15. Leonard RH, Hyung OL, John SL, Andres KS, Perry W, et al. (2007) Clinical implications of fibroblast activation protein in patients with colon cancer. Clin Cancer Res 13: 1736–1741. PMID:17363526
16. Steven J, Cohen R, Katherine A, Irma P, Neal J, et al. (2008) Fibroblast Activation Protein and Its Rela-tionship to Clinical Outcome in Pancreatic Adenocarcinoma. Pancreas 37: 154–158. doi:10.1097/ MPA.0b013e31816618cePMID:18665076
17. Herrera M, Herrera A, Dominguez G, Javier S, Vanesa G, et al. (2013) Cancer-associated fibroblast and M2 macrophage markers together predict outcome in colorectal cancer patients. Cancer Sci 104: 437–444. doi:10.1111/cas.12096PMID:23298232
18. Ariga N, Sato E, Ohuchi N, Nagura H, Ohtani H (2001) Stromal expression of fibroblast activation pro-tein/seprase, a cell membrane serine proteinase and gelatinase, is associated with longer survival in patients with invasive ductal carcinoma of breast. Int. J. Cancer 95: 67–72. PMID:11241314
19. Liberati A, Altman D, Tetzlaff J, Mulrow C, Gotzsche PC, et al (2009) The PRISMA statement for report-ing systematic reviews and meta-analyses of studies that evaluate health care interventions: explana-tion and elaboraexplana-tion. PLoS Med 6: e1000100. doi:10.1371/journal.pmed.1000100PMID:19621070
20. Tierney JF, Stewart LA, Ghersi D, Burdett S, Sydes MR (2007) Practical methods for incorporating summary time-to-event data into meta-analysis. Trials 8: 16–17. PMID:17555582
21. Qin Q, Zhang C, Yang X, Zhu H, Yang B, et al. (2013) Polymorphisms in XPD Gene Could Predict Clini-cal Outcome of Platinum-Based Chemotherapy for Non-Small Cell Lung Cancer Patients: A Meta-Anal-ysis of 24 Studies. PLoS ONE 8: e79864. doi:10.1371/journal.pone.0079864PMID:24260311
22. Higgins JP, Thompson SG (2002) Quantifying heterogeneity in a meta-analysis. Stat Med 21:1539– 1558. PMID:12111919
23. Liao YD, Ni Y, He R, Liu WD (2013) Clinical implications of fibroblast activation protein-alpha in non-small cell lung cancer after curative resection: a new predictor for prognosis. J Cancer Res Clin Oncol 139:1523–1528. doi:10.1007/s00432-013-1471-8PMID:23835897
24. Maria LW, Edin S, Lundberg IV, Guelpen BV, Dahlin AM, et al. (2013) High intratumoral expression of fi-broblast activation protein (FAP) in colon cancer is associated with poorer patient prognosis. Tumor Biol 34:1013–1020. doi:10.1007/s13277-012-0638-2PMID:23328994
26. Liu R, Liu L, Li H, Yu JP, Ren XB (2013) Expression and clinical significance of fibroblast activation pro-tein in non-small cell lung cancer. Chin J Cancer Biother 20: 225–229.
27. Song J, Li Y, Wang QY (2011) Expression and correlation of fibroblast activation protein and TGFβ-1 in endometrial carcinoma. Journal of Harbin Medical University 45: 153–156.
28. Oskar K, Chiristian S, Christina P, Peter D, Christian H, et al. (2007) Molecular characterization of the desmoplastic tumor stroma in medullary thyroid carcinoma. Int J Oncol 31: 59–67. PMID:17549405
29. Zhang L, Zhang HB, Yang R, Li Q (2008) Expression of FAP in oral squamous cell carcinoma and its clinical significance. Chin J Stomatology 28: 449–451.
30. Wang HY, Dong WG, Yang GR, Zhu HX, Lei XW, et al. (2009) Expression of fibroblast activation protein and its clinical significance in esophageal cancer. Chin J Gastroenterol Hepato 18:1102–1104.
31. Liotta LA, Kohn EC (2001) The microenvironment of the tumour-host interface. Nature 411: 375–379. PMID:11357145
32. Rubin H. (2001) Selected cell and selective microenvironment in neoplastic development. Cancer Res 61: 799–807. PMID:11221858
33. Paulsson J, Patrick MP (2014) relevance of cancer-associated fibroblasts in human cancer. Semin Cancer Biol 25: 61–68. doi:10.1016/j.semcancer.2014.02.006PMID:24560651
34. Ito M, Lshii G, Nagai K, Maeda R, Nakano Y, et al. (2012) Prognostic impact of cancer-associated stro-mal cells in patients with stage I lung adenocarcinoma. Chest 142:151–158. doi: 10.1378/chest.11-2458PMID:22302300
35. Zhang J, Valianou M, Simmons H, Robinson MK, Lee HO, et al. (2013) Identification of inhibitory scFv antibodies targeting fibroblast activation protein utilizing phage display functional screens. FASEB J 27:581–589. doi:10.1096/fj.12-210377PMID:23104982
36. Lee HO, Mullins SR, Franco-Barraza J, Valianou M, Cukierman E, et al. (2011) FAP-overexpressing fi-broblasts produce an extracellular matrix that enhances invasive velocity and directionality of pancreat-ic cancer cells. BMC Cancer 11:245–251. doi:10.1186/1471-2407-11-245PMID:21668992
37. LeBeau AM, Brennen WN, Aggarwal S, Denmeade SR (2009) Targeting the cancer stroma with a fibro-blast activation protein-activated promelittin protoxin. Mol Cancer Ther 8:1378–1386. doi:10.1158/ 1535-7163.MCT-08-1170PMID:19417147
38. Huang Y, Simms AE, Mazur A, Wang S, Leon NR, et al. (2011) Fibroblast activation protein-alpha pro-motes tumor growth and invasion of breast cancer cells through non-enzymatic functions. Clin Exp Me-tastasis 28:567–579. doi:10.1007/s10585-011-9392-xPMID:21604185
39. Canady J, Arndt S, Karrer S, Bosserhoff AK (2013) Increased KGF expression promotes fibroblast acti-vation in a double paracrine manner resulting in cutaneous fibrosis. J Invest Dermatol 133:647–657. doi:10.1038/jid.2012.389PMID:23096718
40. Dohi O, Ohtani H, Hatori M, Sato E, Hosaka M, et al. (2009) Histogenesis-specific expression of fibro-blast activation protein and dipeptidylpeptidase-IV in human bone and soft tissue tumours. Histopathol-ogy 55:432–440. doi:10.1111/j.1365-2559.2009.03399.xPMID:19817894
41. Okada K, Chen WT, Iwasa S, Jin X, Yamane T, et al. (2003) Seprase, a membrane-type serine prote-ase, has different expression patterns in intestinal- and diffuse-type gastric cancer. Oncology 65:363– 370. PMID:14707457
42. Iwasa S, Jin X, Okada K, Mitsumata M, Ooi A (2003) Increased expression of seprase, a membrane-type serine protease, is associated with lymph node metastasis in human colorectal cancer. Cancer Lett 199:91–98. PMID:12963128
43. Mori Y, Kono K, Matsumoto Y, Fujii H, Yamane T, et al. (2004) The expression of type II transmembrane serine protease (seprase) in human gastric carcinoma. Oncology 67:411–419. PMID:15713998
44. Brennen WN, Rosen DM, Wang H, Isaacs JT, Denmeade SR (2012) Targeting carcinoma-associated fibroblasts within the tumor stroma with a fibroblast activation protein-activated prodrug. J Natl Cancer Inst 104:1320–1334. doi:10.1093/jnci/djs336PMID:22911669
45. Brennen WN, Isaacs JT, Denmeade SR (2012) Rationale behind targeting fibroblast activation protein-expressing carcinoma-associated fibroblasts as a novel chemotherapeutic strategy. Mol Cancer Ther 11:257–266. doi:10.1158/1535-7163.MCT-11-0340PMID:22323494
46. Ostman A, Augsten M (2009) Cancer-associated fibroblasts and tumor growth-bystanders turning into key players. Curr Oping Genet Dev 19: 67–73. doi:10.1016/j.gde.2009.01.003PMID:19211240
47. Sund M, kalluri R (2009) Tumor stroma derived biomarkers in cancer. Cancer Metastasis Rev 28: 177– 183. doi:10.1007/s10555-008-9175-2PMID:19259624
49. Tse JC, kalluri R (2007) Mechanisms of metastasis: epithelial-to-mesenchymal transition and contribu-tion of tumor microenvironment. J Cell Biochem 101: 816–829. PMID:17243120
50. Zeisberg EM, Potenta S, Xie L, Zeisberg M, kalluri R (2007) Discovery of endothelial to mesenchymal transition as a source for carcinoma-associated fibroblasts. Cancer Res 67: 10123–10128. PMID: 17974953