DOI: 10.1590/0004-282X20160055
ARTICLE
Consistent declining trends in stroke
mortality in Brazil: mission accomplished?
Tendências decrescentes constantes na mortalidade por AVE no Brasil: missão cumprida?
Valéria M. A. Passos1,2, Lenice H. Ishitani3,4, Glaura C. Franco5, Gustavo C. Lana5, Daisy M. X. Abreu4, Maria de
Fatima Marinho2,4 , Elisabeth B. França2,4
Stroke is the second leading cause of death in Braziland worldwide1 and trends in stroke mortality rates may be
ana-lyzed as a proxy of social economic diferences among countries
and regions. A systematic review of population-based studies
showed a divergent, statistically signiicant diference trend in
stroke incidence rates, from 1970 to 2008. It was observed a 42% decrease in stroke incidence in high income countries in con-trast to a more than 100% increase in this incidence in middle and low income countries2. here is a ten-fold diference in mor
-tality rates for stroke between the most-afected and the less-af -fected countries. Moreover, national per capita income has been
pointed out as the strongest predictor of stroke mortality even after adjusting for cardiovascular risk factors3.
In Brazil, there is evidence of declining mortality from stroke in São Paulo since the 1970s4 and all over the country since the
1980s5, but the magnitude of the mortality rates and its
de-cline, as well as the diferences among the regions of the coun -try need to be better investigated. From 1979 to 1996, among Brazilian adults aged 30 or more years old, despite the high
val-ues, the age-adjusted death rate for stroke dropped signiicantly
(p<0.001) from 200 to 164 deaths/100,000 population in men and from 168 to 130 deaths/100,000 population in women6.
1Universidade Federal de Minas Gerais, Programa de Pós-Graduação em Saúde do Adulto, Belo Horizonte MG, Brasil; 2Universidade Federal de Minas Gerais, Programa de Pós-Graduação em Saúde Pública, Belo Horizonte MG, Brasil; 3Secretaria Municipal de Saúde de Belo Horizonte, Gerência de Epidemiologia e Informação, Belo Horizonte MG, Brasil; 4Universidade Federal de Minas Gerais, Grupo de Pesquisa em Epidemiologia e Avaliação de Saúde, Belo Horizonte MG, Brasil; 5Universidade Federal de Minas Gerais, Departamento de Estatística, Belo Horizonte MG, Brasil.
Correspondence: Valéria M A Passos; Av. Alfredo Balena 190/sala 807; 30190-100 Belo Horizonte MG, Brasil; E-mail: [email protected]
Conflict of interest: There is no conlict of interest to declare.
Financial support: Ministério da Saúde, Fundo Nacional de Saúde (Processo 25000214175/2012-75 – Termo de Cooperação 248/2012). Received 06 August 2015; Received in inal form 02 December 2015; Accepted 15 March 2016.
ABSTRACT
Stroke mortality rates are declining in Brazil, but diferences among regions need to be better investigated. The age-adjusted stroke mortality trends among adults (30-69 years-old) from Brazilian regions were studied between 1996 and 2011. Method: Data were analyzed after: 1) reallocation of deaths with non-registered sex or age; 2) redistribution of garbage codes and 3) underreporting correction. A linear regression model with autoregressive errors and a state space model were itted to the data, aiming the estimation of annual trends at every point in time.
Results: Although there were high values, a steady decrease of rates was observed. The decreasing trends among all regions were statistically signiicant, with higher values of decline among the Northeast and Northern regions, where rates were the highest. Conclusion: Standardized methodology use is mandatory for correct interpretation of mortality estimates. Although declining, rates are still extremely high and efforts must be made towards prevention of stroke incidence, reduction of case-fatality rates and prevention of sequelae.
Key-words: stroke; mortality rate; health inequalities.
RESUMO
Objetivos: As taxas de mortalidade por acidente vascular encefálico (AVE) estão em declínio no Brasil, mas diferenças entre as regiões precisam ser melhor investigadas. Foram analisadas as tendências de mortalidade por AVE ajustadas por idade em adultos (30-69 anos) de regiões do Brasil, entre 1996 e 2011. Método: Análise realizada após realocação dos óbitos sem registro de sexo ou idade; redistribuição de códigos mal deinidos e correção do subregistro. Modelos de regressão linear e de espaço de estados foram utilizados visando estimativas de tendências anuais em todos pontos no tempo. Resultados: Observou-se redução de cerca de 50% nas taxas de mortalidade em todas as regiões, para homens e mulheres, com maiores declínios nas regiões Norte e Nordeste, onde as taxas eram as mais elevadas.
Conclusão: Usar metodologia padronizada é fundamental para interpretação correta das estimativas de mortalidade. Esforços devem ser feitos para prevenção da incidência de AVE, redução das taxas de letalidade e prevenção de sequelas.
Mortality is a measure of incidence of deaths in the total population at risk and its frequency depends both on the in-cidence of the disease and its case-fatality ratio, the propor-tion of death among those with the disease. Survival to stroke is highly dependent on medical care, which seems to be im-proving in the country. In the beginning of the ‘80s, a one-year study in all hospitals and emergency care units in the city of Salvador revealed an extremely high 30-day case fatality rate (80.7%), probably consequence of poor access to health pre-ventive and medical facilities, mainly hypertension care and emergence assistance7. In 2003-2004, the only two Brazilian
population-based studies, in small cities (75,000 inhabitants) of the states of Sao Paulo8 and Santa Catarina9, observed a
30-day case fatality rate of less than 20%, similar to that ob-served in developed countries2. Among the population of
Joinville city, compared with data from 1995, it was observed around 30% decrease in incidence, mortality and 30-day case fatality ratio for stroke9. It is noteworthy that these estimates
cannot be generalized to the whole country, as these studies were performed in the two most developed Brazilian regions.
Stroke incidence can be prevented to a large extent by health policies toward reduction of its main risk factors, as hypertension, diabetes, smoking, unhealthy diet and lack of physical activity. Prevention of premature deaths is one of the main objectives of health policies and declining trends on mortality and case fatality
rates relect social and medical improvement over time.
In order to investigate if these good trends have come to stay, this work studies the stroke mortality among the Brazilian adults up to now. Moreover, the stroke mortality trends among the regions of the country are also evaluated, since inequalities may be hidden by aggregate data.
METHOD
Deaths from all types of cerebrovascular disease were
classiied using the underlying cause codes I60-I69 accord
-ing to the International Classiication of Diseases – Tenth
Revision (ICD-10). Data from all deaths that occurred be-tween 1996 and 2011 among individuals aged bebe-tween 30 and 69 years were obtained from the Brazilian Mortality Information System (SIM, Sistema de Informação sobre Mortalidade)10, which provides underlying cause of death,
date, local of death and selected characteristics of deceased.
he crude number of notiied deaths were corrected ac
-cording to the following steps: 1) deaths with non-registered sex or age were reallocated pro-rata according to registered sex and age; 2) redistribution of garbage codes, that is, deaths from all other ICD chapters assigned to causes that cannot or should not be considered underlying causes of death, by sex and region1 and 3) redistribution of ill-deined causes of
deaths (ICD 10 XVIII chapter)11 (Table 1).
Finally, as considerable diferences exist in the degree of
completeness of the vital registration among the Brazilian
regions, the proportion of all deaths that is registered for the population covered by the vital registration system has been
estimated separately. he “Rede Intergerencial de Informações
para a Saúde” (RIPSA) coverage estimates between 1996 and 2011 were used to perform corrections of underreporting for both sexes12, and estimated by sex. Underreporting
correc-tion was based on the ratio between SIM death registers and
“Instituto Brasileiro de Geograia e Estatística“(IBGE) death es -timates for the 1996-1999 period and the number of death esti-mated by active search in 2000-201113,14.
Population data by age and sex were taken from the 1991, 2000 and 2010 Brazilian censuses14. Intercensuses population
estimates by age and sex were obtained by logarithmic inter-polation of the censuses population.
In order to control the efect of age distribution variations
in the period and among regions, the mortality rates (per 100 thousand inhabitants) were standardized for the Brazilian population in 2010 by sex and age using the direct method.14
To verify mortality trends during these 15 years, a lin
-ear regression model was itted to the data. To adjust for the presence of irst order autocorrelation, the residuals of the
regression were modeled as a irst order autoregressive pro
-cess15. With that, it was possible to test if the mortality
se-ries have a signiicant increasing or decreasing trend. A state
space model was also itted to the data, aiming the estima
-tion of annual trends at every point in time15.
RESULTS
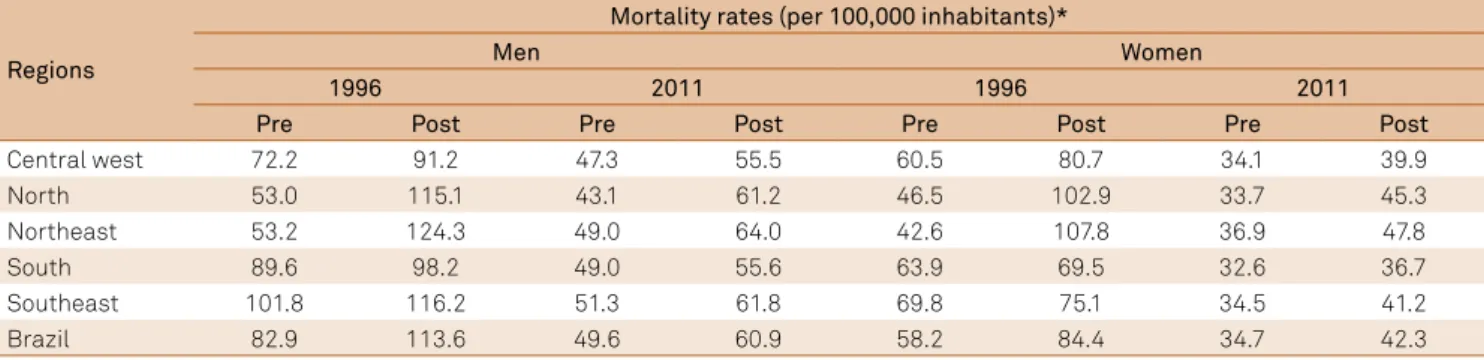
Between 1996 and 2011 it was observed a steady decrease
of mortality rates for stroke for both sexes, with diferences
in the magnitude of decline among the regions. Age-adjusted
mortality rates were higher among men for all regions. he
South and Central West regions had the smallest age-adjust-ed rates in 1996 and 2011. In 2011, there was an important declining of age-adjusted mortality rates for both sexes, as well as a narrowing of the range among the region rates. As expected, the mortality rates became higher after correction and a higher impact of the correction can be observed among rates from the North and Northeast regions, mainly in 1996. In 2011, smaller variations of rates before and after correction can be noticed for all regions, but the higher corrections
re-main restricted to the North and Northeast regions (Table 2).
When rates are analyzed by age strata, it was observed an increment on mortality rates by age in both sexes, as well as a consistent and impressive decline of these rates in all age
groups between 1996 and 2011 (Table 3).
he decreasing trends among all Brazilian regions were statistically signiicant, with higher values of decline in the Northeast and the North regions for both sexes (Table 4).
Estimates of the annual trends in stroke mortality by sex
Table 1. List of garbage codes and the proportion of redistribution to cerebrovascular disease as the cause of death.
Group of the garbage codes ICD-10 codes* Proportion (%)
Atherosclerosis I70.0–I70.1, I70.9 53.90
Hypertension I10, I15 28.67
Other and unspeciied disorders of circulatory system I99 25.68
Different paralytic syndrome/palsy syndrome G80–G83 14.73
Diseases of the genitourinary system (C14) N39.3, N40, N45–N46, N60, N84–N92, N95, N97 13.41
Osteomuscular system (C.13) M10–M11, M15–M25, M40, M45, M47–M48, M50–M60, M65–M67, M70–M71, M75–M79, M95–M99 12.77
Mental, behavioral and neurodevelopmental disorders (C.5) F30–F33, F34.1, F40–F48, F51–F53, F60–F99 10.92 Diseases of the blood and blood-forming organs and
certain disorders involving the immune mechanism (C3) D10–D24, D26–D31, D35–D36 10.45
DIC, acute respiratory failure D65, I46, J96.0, J96.9 10.15
Diseases of the eye and adnexa, diseases of the ear and mastoid process (C7 & C8)
H00–H02, H04–H05, H10–H11, H15–H18, H20–H21, H25–H26, H30–H31, H33–H35, H43–H47, H49–H57, H60–H61,
H69, H71–H74, H80–H81, H83–H93 9.95
Diseases of the skin and subcutaneous tissue (C12) L03, L04, L20–L30, L45, L50, L52–L68, L70–L85, L90–L92, L98 9.81
Diseases of the digestive system (C11) K00–K11, K14 9.77
All encephalopathy and cerebral oedema G92, G93.1–G93.6 8.52
Certain infectious and parasitic diseases (C1) A59–A60.0, A60.9, A63–A64, A71–A74, B07–B09, B35–B36, B74.4–B74.8, B75, B85–B88, B95–B97 7.84
Pneumonitis J69 7.68
Diseases of the nervous system (C6) G43–G44, G47–G52, G54, G56–G58 6.68
Diseases of the respiratory system (C10) J30, J33, J34.2, J35 5.88
Congenital malformations, deformations and
chromosomal abnormalities (C17) Q16–Q18, Q36, Q54, Q65, Q67–Q68, Q72–Q74, Q82–Q83 3.33
Embolism and thrombosis I74, I81 1.40
Cardiopaty complications and unspeciied cardiac diseases I51 0.73
*ICD 10: International Classiication of diseases – Tenth revision
Table 2. Stroke age-adjusted mortality rates before and after correction, among the Brazilian regions, in 1996 and 2011.
Regions
Mortality rates (per 100,000 inhabitants)*
Men Women
1996 2011 1996 2011
Pre Post Pre Post Pre Post Pre Post
Central west 72.2 91.2 47.3 55.5 60.5 80.7 34.1 39.9
North 53.0 115.1 43.1 61.2 46.5 102.9 33.7 45.3
Northeast 53.2 124.3 49.0 64.0 42.6 107.8 36.9 47.8
South 89.6 98.2 49.0 55.6 63.9 69.5 32.6 36.7
Southeast 101.8 116.2 51.3 61.8 69.8 75.1 34.5 41.2
Brazil 82.9 113.6 49.6 60.9 58.2 84.4 34.7 42.3
*Before and after correction.
Table 3. Age-speciic mortality rates from stroke, by sex, in 1996 and 2011.
Age group (years)
Mortality rates (/100.000inhab)
Men Women
1996 2011 1966 2011
30–34 13.9 6.6 11.7 5.1
35–39 25.6 12.3 21.9 10.4
40–44 46.5 22.4 39.4 20.1
45–49 82.1 38.5 68.2 33.6
50–54 122.2 65.9 97.1 48.5
55–59 212.1 110.8 149.8 71.1
60–64 308.9 172.3 210.3 108.7
65–69 498.6 289.6 352.4 184.2
Total 113.6 60.9 84.4 42.3
Table 4. Annual linear trend of stroke mortality rates among Brazilian regions, according to the linear regression model with autoregressive errors, from 1996 to 2011.
Brazilian regions Beta values*
Male Female
Central West -2.823 -2.829
North -3.425 -3.358
Northeast -4.010 -3.974
South -3.082 -2.223
Southeast -3.082 -2.262
According to the state space model, trend evolution in all
Brazilian regions show a signiicant decrease in stroke mor
-tality compared to the previous year. Among men, the de-crease was more pronounced between 2000 and 2002 in the North, Northeast and Southeast Regions. In the South Region the decreasing occurred up to 2005 and in the Midwest, after an initial increase, the trend has been decreasing since 1999. In women, the decrease was accentuated in 1999 and 2000 in the North and Northeast. In the Southeast and South re-gions there was a steady decrease until 2005, reaching inten-sity decreasing from 2008. In the Midwest, the trend decreas-es sharply until 2002 and then stabilizdecreas-es (Figure).
DISCUSSION
his study shows consistent declining trends of stroke
mortality rates between 1996 and 2011. But before
present-ing these indpresent-ings, a brief discussion of how to obtain them
is described. After all, methods do matter. When studying
mortality trends for the ive regions of Brazil during 15 years,
it is important to keep in mind that coverage and quality of cause-of-death data varies across regions and time. Valid, re-liable, and comparable assessments of trends in causes of death from even the best systems are limited by coverage and quality of data issues16. he irst step of a mortality analysis
consists in using traditional demographic tools for correction of coverage. In this study, the number of deaths provided by the SIM were corrected by taking into account the
underre-porting index estimated by RIPSA and IBGE for each region
and year. Without corrections for underreporting, developed regions that generally have better coverage may seem to have higher mortality rates than the poorest ones. Also, as cover-age tends to improve over time, crude results may show false increases on mortality rates in the future.
Besides diferences in coverage, many deaths assigned to
causes that cannot or should not be considered underlying causes of death must be redistributed to a cause of death that
makes sense in terms of causality or public health interpreta-tion16. Since the advent of the sixth revision, the ICD-10 has
been used not only to code deaths but also to cover all types of medical information, including non-fatal disorders and
nonspeciic medical conditions16. In this study, causes such
as atherosclerosis and hypertension, more plausible as risk factors than underlying cause of death, were redistributed to cerebrovascular and other cardiovascular diseases, accord-ing to preconized methods1.
Quality of data information is a proxy of socioeconomic
status of a region. he less developed North and Northeast
regions presented the higher proportion of correction by
cov-erage and by redistribution of causes of deaths. he decrease
in the magnitude of these corrections in 2011 may relect im
-provements on information quality over time and can con-tribute to narrowing the data quality gap between the north-ern and southnorth-ern regions of the country, these latter with data quality similar to developed countries17.
he North and Northeast regions also presented the
higher mortality rates for both sexes, although declining trends in mortality rates can be observed among all regions
of the country. he regression coeicient for the trend, pre
-sented on Table 3, indicates around 3% annual decrease on mortality during these 15 years; and the signiicance of this analysis indicates, with a 95% level of conidence, that this
declining trend really occurred. Higher declines of mortal-ity rates in less developed regions are generally predictable, since it is easy to have higher decreases where the health indicators are worse.
Besides socioeconomic development, the signiicant de
-creasing in stroke mortality rates may indicate the efect of
cardiovascular risk factor control interventions, as well as the huge increase (450%) on access to primary health ser-vices from 1981 to 200818. hese decreasing trends have been
observed in Western nations since the 1970s and have been attributed to improved control of hypertension. As observed
in developed countries, eforts towards diabetes mellitus
and dyslipidemia control and smoking cessation programs,
-5,00 -4,00 -3,00 -2,00 -1,00 0,00 1,00 2,00
1997 1998 1999 2000 2001 2002 2003 2004 2005 2006 2007 2008 2009 2010 North Northeast South Southeast
-5,00 -4,00 -3,00 -2,00 -1,00 0,00 1,00 2,00
1997 1998 1999 2000 2001 2002 2003 2004 2005 2006 2007 2008 2009 2010 2011
Male Female
Central West
Beta values on stat
e
‐
space regression*
Beta values on stat
e
‐
space regression*
2011
North Northeast South Southeast Central West
particularly in combination with treatment of hypertension, may have contributed to the decline in stroke mortality19.
Although using diferent methodologies, our results are
consistent with the majority of published papers in the coun-try 5,6,. he only dissonant note was the report of an increase
in age-adjusted mortality due to cerebrovascular accidents (ICD 10, I60-I69) from 2001 to 2006, maybe because crude mortality data were not corrected 20.
But public health authorities cannot fool themselves by
these good trends, as much more efort still remains to be
done. Besides having unequal distribution and being a re-cent phenomenon in Brazil, the current mortality rates are still very high. Stroke mortality has been falling rapidly in de-veloped countries for more than 40 years21. he current bur
-den of stroke mortality observed in the main Brazilian cit-ies are much higher than in the United States, Canada and
western European countries, and similar to what is observed in Eastern Europe and Japan. Compared to other Latin
American countries, Brazil also has the highest rates, for both sexes22. Even after the impressive decline among all age stra
-ta, the current mortality rates observed in Brazilian adults and middle-aged are higher than mortality rates among el-derly from developed countries2,3. All over the world, in 2005,
about 40% of stroke victims were less than 70 years of age23.
hese results contradict the concept of stroke as a disease of
the elderly and reinforce the need for cardiovascular health promotion strategies based on the life-course approach.
In order to establish preventive measures, it is important to
diferentiate the stroke subtypes. Cerebral ischemia is associated
to atherosclerosis and can be prevented by policies aiming the re-duction of cardiovascular risk factors. On the other hand, hyper-tension is the primary cause of hemorrhagic stroke among those
aged 40 or more years (AHA/ASA Guidelines). Unfortunately, the Brazilian mortality data still lacks speciicity. From 2005 to 2007, the annual average of ill-deined codes for Brazilian Capitals were very high: 31.8% of code I64.0 (stroke not speciied as hemorrhag
-ic or ischem-ic), 25.2 % as code I61.9 (non-speciied intracerebral
hemorrhage) and 11.6% as code I67.8 (other cerebrovascular dis-eases)24. A reappraisal of stroke mortality trends in Brazil between
1979 and 2009 showed that mortality are declining in the country for all strokes subtypes, although these estimates did not
consid-ered quality diferences on registry, redistribution due to garbage codes or ill-deined diseases25.
he low access to neuroimaging diagnosis may partially
explain the paucity of data mortality on stroke subtypes. In São Paulo, the wealthiest State in Brazil, the changes of stroke mortality rates between 1996 and 2003 revealed an annual re-duction of all types of stroke (-3.9%) and of stroke subtypes as intracerebral hemorrhage (-3.0%) and cerebral infarction
(-2.7%) as well as a decline of ill-deined stroke (-7.4%) for
men. he switch of ill-deined cases to stroke subtype catego
-ries due to a better clinical diagnosis may have blurred a real decline of both cerebral infarction and intracerebral hemor-rhagic stroke among women26.
he high proportion of ill-deined causes and the lack of stroke subtypes classiication of Brazilian death certiicates
are markers of low data quality, usually related to the ac-cess or the quality of medical care received by the popula-tion11. Besides educational strategies and advocacy among
doctors aiming the description of stroke subtype on death
certiicates, it is essential to provide referral hospitals with
adequate diagnosis equipment, mainly in less developed re-gions. Although it have been pointed out that there is no need to increase the number of machines for computed to-mography scans or magnetic resonance imaging in Brazil27,
the availability of these diagnosis tools seems to be un-even. A national analysis of 16,879 hospital records from
April 2006 to December 2007 showed that at least one CT
scan were performed in only 28.6% of the stroke
admis-sions under the Brazilian Uniied National Health System.
Moreover, 91.1% of these exams were performed in South and Southeast regions28.
he main strength of this study relies on the rigorous
methodology and the use of all modern techniques of analy-sis of mortality data. But our study is limited by the lack of data of stroke incidence and case-fatality data for the
coun-try. he decline in stroke mortality rates may relect both re
-duced incidence or lower case-fatality rates. Greater case-fa -tality rates could account for some of the increased mor-tality in the poorest region of the country, since quality of care var-ies substantially among these regions28.
Moreover, it is important to analyze the burden of stroke
as a non-fatal outcome. After ten years from the irst stroke,
cumulative survival rates for all types of stroke were 35% among Framingham Study participants29. But how these
patients survive? A recent update on stroke statistics on United States estimates that on average, every 40 seconds, someone has a stroke. At six months after stroke, 35% had depressive symptoms, 30% were unable to ambulate with-out assistance, and 26% were dependent in activities of daily living30. here are no estimates of the global burden
of stroke in Brazil. Our country is an emerging middle-in-come country and our social and health structures are still inadequate to face the challenges of rehabilitation care for patients who survive to the acute phase of stroke. It will be necessary renewed emphasis on treatment of acute events as well as secondary and primary prevention through treat-ment and control of risk factors.
In conclusion, although good news is always welcome, health authorities must maintain and improve the ef-forts in the way to continue the declining trend of stroke
in Brazil. The main results of this study seem to reflect
References
1. Lozano R, Naghavi M, Foreman K, Lim S, Shibuya K, Aboyans V et al. Global and regional mortality from 235 causes of death for 20 age groups in 1990 and 2010: a systematic analysis for the Global Burden of Disease Study 2010. Lancet. 2012;380(859):2095-128. doi:10.1016/S0140-6736(12)61728-0
2. Feigin VL, Lawes CM, Bennett DA, Barker-Collo SL, Parag V. Worldwide stroke incidence and early case fatality reported in 56 population-based studies: a systematic review. Lancet Neurol. 2009;8(4):355-69. doi:10.1016/S1474-4422(09)70025-0 3. Johnston SC, Mendis S, Mathers CD. Global variation in stroke burden and mortality: estimates from monitoring, surveillance and modelling. Lancet Neurol. 2009;8(4):345-54. doi:10.1016/S1474-4422(09)70023-7
4. Lolio CA , Laurenti R. Mortalidade por doença cerebrovascular em São Paulo. Rev Saúde Pública. 1986;20:436-43.
5. Mansur A P, Souza MFM, Favarato D, Avakian SD, Machado CLA, Mendes AJ et al. Stroke and ischemic heart disease mortality trends in Brazil from 1979 to 1996. Neuroepidemiology. 2003;22(3):179-83. doi:10.1159/000069893
6. Mansur AP, Favarato D. Mortality due to cardiovascular diseases in Brazil and in the metropolitan region of Sao Paulo: a 2011 update. Arq Bras Cardiol. 2012;99(2):755-61. doi:10.1590/S0066-782X2012005000061
7. Lessa I. [Epidemiology of acute cerebrovascular accidents in Salvador City: clinical aspects]. Arq Neuropsiquiatr. 1985;43(2):133-9. Portuguese. doi:10.1590/S0004-282X1985000200002
8. Minelli C, Fen LF, Minelli DPC. Stroke incidence, prognosis, 30-day, and 1-year case fatality rates in Matão, Brazil. A population-based prospective study. Stroke. 2007;38(11):2906-11. doi:10.1161/STROKEAHA.107.484139
9. Cabral NL, Gonçalves ARR, Longo AL, Moro CH, Costa G, Amaral CH et al .Trends in stroke incidence, mortality and case fatality rates in Joinville, Brazil: 1995–2006. J Neurol Neurosurg Psychiatry. 2009;80(7):749-54. doi:10.1136/jnnp.2008.164475
10. Ministério da Saúde (BR). Sistema de Informação em Mortalidade. Óbitos por residência por sexo, idade e causa - CID-10/Datasus Brasília, DF: Ministério da Saúde; 2014 [cited 2014 Apr]. Available from: www.datasus.gov.br
11. França E, Teixeira R, Ishitani L, Duncan BB, Cortez-Escalante JJ, Morais Neto OL et al. Ill-deined causes of death in Brazil: a redistribution method based on the investigation of such causes. Rev Saúde Pública. 2014;48(4):671-81. doi: 10.1590/S0034-8910.2014048005146
12. Rede Intergerencial de Informações para a Saúde - RIPSA. Razão entre óbitos informados e estimados, segundo região e UF. Brasília, DF: RIPSA; 2011 [cited 2015 July 03]. Available from: http://tabnet. datasus.gov.br/cgi/idb2011/a18.htm
13. Szwarcwald CL, Morais Neto OL, Escalante JJC, Souza Junior PRB, Frias PG, Lima RB et al. Busca ativa de óbitos e nascimentos no Nordeste e na Amazônia Legal: estimação das coberturas do SIM e do SINASC nos municípios brasileiros. In: Ministério da Saúde (BR). Saúde Brasil, 2010: uma análise da situação de saúde e de evidências selecionadas de impacto de ações de vigilância em saúde. Brasília, DF: Ministério da Saúde; 2011. p. 79-98.
14. Instituto Brasileiro de Geograia e Estatística - IBGE. Available from: http://www.ibge.gov.br/home.
15. Shumway RH, Stoffer DS. Time series analysis and its applications: with R example. 3rd ed. New York: Springer; 2006. 16. Naghavi M, Makela S, Foreman K, O’Brien J, Pourmalek F,
Lozano R. Algorithms for enhancing public health utility of national causes of death data. Popul Health Metr. 2010;8:9. doi:10.1186/1478-7954-8-9
17. Mikkelsen L, Phillips DE, AbouZahr C, Setel PW, Savigny D, Lozano R et al. A global assessment of civil registration and vital statistics systems: monitoring data quality and progress. Lancet. 2015;386(10001):1395-406. doi:10.1016/S0140-6736(15)60171-4 18. Paim J, Travassos C, Almeida C, Bahia L, Macinko J. The Brazilian
health system: history, advances, and challenges. Lancet. 2011;377(9779):1778-97. doi:10.1016/S0140-6736(11)60054-8 19. Lackland DT, Roccella EJ, Deutsch AF, Fornage M, George
MG, Howard G et al. Factors inluencing the decline in stroke mortality: a statement from the American Heart
Association/American Stroke Association. Stroke. 2014;45(1):315-53. doi:10.1161/01.str.0000437068.30550.cf
20. Garritano CR, Luz PM, Pires ML, Barbosa MT, Batista KM. Analysis of the mortality trend due to cerebrovascular accident in Brazil in the XXI century. Arq Bras Cardiol. 2012;98(6):519-27. doi:10.1590/S0066-782X2012005000041
21. Klag MJ, Whelton PK, Seidler AJ. Decline in US stroke mortality: demographic trends and antihypertensive treatment. Stroke. 1989;20(1):14-21. doi:10.1161/01.STR.20.1.14
22. Lotufo PA. Stroke in Brazil: a neglected disease: editorial. Sao Paulo Med J. 2005;123(1):3-4. doi:10.1590/S1516-31802005000100001 23. Strong K, Mathers C, Bonita R. Preventing stroke: saving
lives around the world. Lancet Neurol. 2007;6(2):182-7. doi:10.1016/S1474-4422(07)70031-5
24. Abreu DMX, Drumond EF, França EB, Ishitani LH, Malta CH, Machado CJ. Análise comparativa de classiicações de causas evitáveis de morte em capitais brasileiras: o caso das doenças cerebrovasculares. Rev Bras Estud Popul. 2010;27(2):447-55. doi:10.1590/S0102-30982010000200014
25. Lotufo PA, Goulart AC, Fernandes TG, Benseñor IM. A reappraisal of stroke mortality trends in Brazil (1979-2009). Int J Stroke. 2013;8(3):155-63. doi:10.1111/j.1747-4949.2011.00757.x 26. Lotufo PA, Benseñor IM. Trends of stroke subtypes mortality in Sao
Paulo, Brazil (1996-2003). Arq Neuropsiquiatr. 2005;63(4):951-5. doi:10.1590/S0004-282X2005000600009
27. Massaro A. Stroke in Brazil: a South America perspective. Int J Stroke. 2006;1(2):113-5. doi:10.1111/j.1747-4949.2006.00029.x 28. Rolim CLRC, Martins M. [Quality of care for ischemic
stroke in the Brazilian Uniied National Health System]. Cad Saúde Pública. 2011;27(11):2106-16. Portuguese. doi:10.1590/S0102-311X2011001100004
29. Sacco RL, Wolf PA, Kannel WB, McNamara PA. Survival and recurrence following stroke: The Framingham study. Stroke. 1982;13(3):290-5. doi:10.1161/01.STR.13.3.290