349 349 349 349 349 Faculdade de Medicina de Botucatu – UNESP e Institut Català d' Oncologia,
Barcelona
Mailing address: Tania Ruiz – Department of Public Health - Faculdade de Medicina de Botucatu (UNESP) - Caixa postal, 970 - 18618-970 – Botucatu, SP - E-mail: [email protected]
Objective - To detect factors associated with
cardio-vascular mortality in the elderly of Botucatu.
Methods - We evaluated 29 variables of interest in a
cohort of patients aged ³60 using data from a survey con-ducted between 1983/84. The elderly cohort was analyzed in 1992 to detect the occurrence of cardiovascular deaths. Survival analysis was performed using the Kaplan-Meier method, the log-rank test, and Cox regression analysis. Three models were adapted for each group of variables, and a final model was chosen from those variables selec-ted from each group.
Results - We identified predictor for cardiovascular
death according to age for elderly males not supporting the family, not possessing a vehicle, and previous cardio-vascular disease. In elderly females, the predictor varia-bles were previous cardiovascular disease and diabetes mellitus.
Conclusion -Socioeconomic indicators (family
hea-ding and vehicle ownerrship) may be added to well stabi-lished medical factors (diabete mellitus and hypertension to select target groups for programs intended to reduce deaths due to cardiovascular diseases in elderly people.
Key words: survival, cardiovascular disease, elderly
Arq Bras Cardiol, volume 77 (nº 4), 349-54, 2001
Tania Ruiz, Mirela D. Sanchís, Ana Maria Fioravante, Xavier C. Piqué
Botucatu, SP - Barcelona, Espanha
Some Predictors of Cardiovascular Mortality Among the
Elderly Population of Botucatu (SP)
The aging of the population, an incontestable fact of Brazilian demography in the last decades 1,2, has made the study of the elderly of utmost importance, because few data are available for the social planning of the population, within this new profile that emerges in this century.
Mortality records are important sources of information about social health, although in developing countries, Bra-zil among them, problems exist regarding the reliability of the causes reported in death certificates, which needs to be constantly remembered 3,4.
Cardiovascular diseases are the most frequent cau-se of mortality in the elderly 5, and, of them, ischemic heart disease and cerebrovascular disease stand out 6,7. The importance of mortality from cardiovascular causes in the elderly increases as we observe that, besides the high incidence of death from these diseases being re-ported at baseline in death certificates, Brazilian elderly have an average of 3.6% diagnoses reported on the cer-tificates, and cardiovascular diseases make up 65% of these diagnoses 7,8.
Regarding the known risk factors of mortality in the el-derly, gender is the most studied mortality risk, because a greater survival in females is detected in almost all Ame-rican, Asian, and European countries 9. Gender is not pro-perly a risk factor, but mortality has a different behavior in each gender, and, therefore, a separate analysis is more ap-propriate.
Risk factors for cardiovascular diseases in the elderly frequently reported in the literature are blood cholesterol le-vels 10-12 and systolic blood pressure, and less significantly, diastolic blood pressure 13-18, body mass index 19, smoking 12, diabetes mellitus 20,social class 21, marital status 14,22,and social support to the elderly 23.
350 350 350 350 350
Methods
In 1983 and 1984, we implemented a questionnaire of the aforesaid mortality in Botucatu city. The population of the town was, at that time, 64,476 inhabitants, of which 5,853 (9.1%) were over 60. We considered the whole urban population, 58,251 inhabitants as the universe of the general inquiry. The sample was conducted in two stages. The first stage consisted of analyzing sections of the census, which were proportionally represented according to social status, defined by housing characteristics, and the extent of urbani-zation in different areas. In the second stage, houses were randomly sampled 24 within the groups of stratified sectors with respect to the proportionality of the population. The sample had 16 census sections, 1,769 houses, and 7,075 indi-viduals. In this sample, 640 people were 60 or over at that time and constituted the cohort of the present survival study.
Data assessment concerning the blood pressure eva-luation of the 60 or older population was performed 3 months after the beginning of questionnaire implementation to obtain the other information related to the survey. Because of the time delay, some individuals were not found when blood pressure evaluation was carried out because of address changes, temporary absence, refusals, and so forth. For the purpose of evaluating whether those absences produced bias in the sample, the frequency of all variables obtained in the first stage of the questionnaire (which collected social data such as documented morbidity and accidents) and in the second stage (when blood pressure evaluation was perfor-med) were compared using the chi-square test. The results obtained showed that most variables, including all the demographic variables, did not reveal different behaviors in either population. We have chosen, therefore, to include some of the variables from the pressoric evaluation.
Members of the cohort, which comprised 640 elderly who were 60 or over, were contacted again in 1992. We as-sessed 574 elderly (89.6%). Initially, we tried to contact the respondents to the questionnaire at the address provided in 1983/84. In the case of change in the address, the neigh-bors were asked about the whereabouts of the participants. We have also looked for them in the phone book, in the ci-ty’s Institution for the elderly, in the records of the Hospital das Clínicas or of the Centro de Saúde-Escola (Clinicas Hospital and Health-School Center), and also in the records of retired people receiving Social Security in Botucatu. In-formation regarding the date of death came from the death certificate and was confirmed afterwards either by locating this information at the Seção de Vigilância Epidemiológica do Centro de Saúde-Escola (Section of Epidemics Surveil-lance of the Health-School Center) where photocopies of all death certificates of the town are kept or in death records obtained from the notary’s office of Botucatu from 1983 until that time. Individuals not found and whose death certifica-tes were not located either were considered lost. At the end of this procedure, 574 elderly had been found (89.6% of the initial cohort) and formed the cohort of the present study.
Variables studied as risk factors for death from cardio-vascular disease were the following: variables considered as socioeconomic: age (60 to 69 years - 70 years or over), co-lor (whites - nonwhites), economically active (yes - no), wa-ge (3 or more minimum wawa-ge - 1 or more – and less than 3 mi-nimum wage – less than 1 mimi-nimum wage), per capita income (1 or more minimum wage - 1/2 or more – and less than 1 mini-mum wage – less than 1/2 minimini-mum wage), other incomes (yes – no), retired (yes - no), education (elementary school, elementary school unfinished, literate), has a vehicle (yes -no), has a telephone (yes - -no), origin (Botucatu, other town; urban area, other city; rural area), length of time living in the town (15 years or over, less than 15 years), number of people in the house (1 or 2, 3 or 4, 5 or more), type of residence (own or rented, other possibilities); variables related to family: married (yes no), support the family (himself or spouse -other relatives), family income (5 or more minimum wage - 3 or more and less than 5 minimum wage – up to 3 minimum wage), number of generations in the house (1 - 2 - 3, or mo-re); variables related to morbidity: circulatory system disea-ses, respiratory system diseadisea-ses, hypertensive diseadisea-ses, diabetes mellitus, neoplasia, musculoskeletal diseases, chronic diseases, and presence of hypertensive people in the family (no - yes); measured: average of 3 measures of systolic blood pressure (136mmHg or lower – higher than 136mmHg) and diastolic (100mmHg or lower – higher than 100mmHg) performed during domicile calls and the Quetelet index (calculated from the measures of weight and height of each elderly).
Variables studied were stratified according to percen-tiles of distribution and, in some cases, by segments previo-usly tested in other studies. When the variable could not be divided into strata naturally and it was difficult to stratify according to percentiles, survival curves estimated through the Kaplan-Meier 25 method helped to adjust the stratifica-tion intervals.
Obtained data were analyzed using survival analysis techniques and death from cardiovascular disease was con-sidered the “event”. Individuals who died were concon-sidered as censored because it was impossible to know how long that patient would survive with cardiovascular disease, the event of our interest. We considered all the diseases inclu-ded in codes 390.0 to 459.0 of the International Classifica-tion of Diseases 9th revision 26 as cardiovascular diseases. For the performance of a preliminary exploratory ana-lysis, the Kaplan-Meier estimate and log-rank test were used, applied to each independent risk factor. The associa-tion between the variables studied as risk factors was also evaluated through the chi-square and Fisher’s exact tests applied to frequency tables.
To evaluate the effect of each risk factor when control-led by other risks, we used the Cox 27 regression model. The
351 351 351 351 351
To perform the adjustment of the model, 3 blocks of variables were considered: socioeconomic strata, variables related to the family, and morbidity, taking into account the multiple regression model according to the relationship between the studied variables considered as risk factors and the time that cardiovascular death had occurred.
To perform the adjustment of the models, variables in which proportionality of the risks was not verified, according to the analysis of the graphic mentioned above, and the non-significant difference between the survival curves (p>0.05) according to log-rank test were discharged. For each model, the selection of the variables was in accordance with the pro-cedure described by Collett 28, based on the variables with proportional risks and significant differences between survi-val curves (p<0.05) and considering afterwards, the variables with proportional risks and nonsignificant differences between the survival curves. The variable age was included in all models so that the effects of the other variables would not be confused with the effects of that one.
Once the models were adjusted to the 3 blocks of varia-bles, we started with the model of the socioeconomic variavaria-bles, including the variables related to the families selected in the corresponding model. In the resulting model, we kept only the statistically significant variables (p<0.05). Then, the morbidity variables selected were included in the model keeping, once more, only the variables whose effect was significant in the resulting model, obtaining thus, the final model.
Analysis was carried out separately for each gender, because men and women have very different behaviors with regard to survival.
Statistics programs used were SPSS and SAS.
Results
We evaluated 266 men and 308 women. The mean age of this population was very similar in both sexes: 68.5 years for men, with a standard error of 7.7 years, and 68.7 years for women, with a standard error of 7.0 years. After the obser-vation period, 34.8% of participants (n=200) had passed away, that i.e., 59.5% (n=119) from cardiovascular disease. In the female patients, 99 deaths occurred, and 58.7% were caused by cardiovascular disease. In the male patients, of the 101 deaths, 60.4% were caused by cardiovascular di-sease (table I).
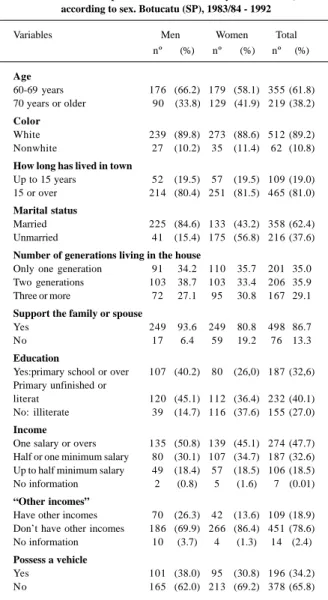
Regarding the profile of the elderly from Botucatu in 1983/84, more than half were aged around 60 to 69 years, most of them were married white men and widowed women who had lived in the town for over 30 years. In regard to the standard of living, they lived in their own house, either alrea-dy paid for or still being paid for, with 1 or 2 generations li-ving in the house, and either the participant or spouse sup-porting the family. They possessed neither a car nor a tele-phone. The men were retired (71.7%), and the women decla-red themselves pensioners (34.1%) or housewives (36.0%). The elderly had poor education and low income (tab. II).
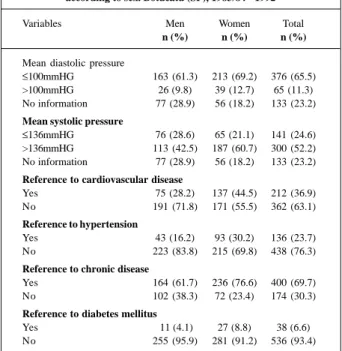
Concerning health, 69.7% of the elderly reported some kind of chronic disease (that had been present for over a
year); 36.9% reported some kind of circulatory system di-sease, and 23.7% reported hypertension and 6.6% diabetes mellitus (tab. III).
According to the log-rank test, both for females and males, a significant difference (p<0.01) existed between the survival curves estimated for both age groups considered (60 to 69 years and 70 years or older). In both sex, as we had
Table I – Mortality from cardiovascular disease in a cohort of elderly 60 or older, according to sex. Botucatu (SP), 1983/84 –
1992
Variables Men Women Total
nº (%) nº (%) nº (%)
Alive at the end of the study 165 (62.0) 209 (67.9) 374 (65.2) Dead at the end of the study 101 (38.0) 99 (32.1) 200 (34.8) Deaths from CVD (390.0-459.9) 61 (60.4) 58 (58.6) 119 (59.5) Ischemic disease (410.0-414.9) 27 (26.7) 29 (29.3) 56 (28.0) Cerebrovascular (430.0-438.9) 23 (22.8) 13 (13.1) 36 (18.0) Other heart diseases 11 (10.9) 16 (16.2) 27 (13.5)
Table II – Description of a cohort of elderly of 60 or older, according to sex. Botucatu (SP), 1983/84 - 1992
Variables Men Women Total
nº (%) nº (%) nº (%)
Age
60-69 years 176 (66.2) 179 (58.1) 355 (61.8) 70 years or older 90 (33.8) 129 (41.9) 219 (38.2) Color
White 239 (89.8) 273 (88.6) 512 (89.2)
Nonwhite 27 (10.2) 35 (11.4) 62 (10.8)
How long has lived in town
Up to 15 years 52 (19.5) 57 (19.5) 109 (19.0)
15 or over 214 (80.4) 251 (81.5) 465 (81.0)
Marital status
Married 225 (84.6) 133 (43.2) 358 (62.4)
Unmarried 41 (15.4) 175 (56.8) 216 (37.6)
Number of generations living in the house
Only one generation 91 34.2 110 35.7 201 35.0
Two generations 103 38.7 103 33.4 206 35.9
Three or more 72 27.1 95 30.8 167 29.1
Support the family or spouse
Yes 249 93.6 249 80.8 498 86.7
No 17 6.4 59 19.2 76 13.3
Education
Yes:primary school or over 107 (40.2) 80 (26,0) 187 (32,6) Primary unfinished or
literat 120 (45.1) 112 (36.4) 232 (40.1)
No: illiterate 39 (14.7) 116 (37.6) 155 (27.0) Income
One salary or overs 135 (50.8) 139 (45.1) 274 (47.7) Half or one minimum salary 80 (30.1) 107 (34.7) 187 (32.6) Up to half minimum salary 49 (18.4) 57 (18.5) 106 (18.5)
No information 2 (0.8) 5 (1.6) 7 (0.01)
“Other incomes”
Have other incomes 70 (26.3) 42 (13.6) 109 (18.9) Don’t have other incomes 186 (69.9) 266 (86.4) 451 (78.6)
No information 10 (3.7) 4 (1.3) 14 (2.4)
Possess a vehicle
Yes 101 (38.0) 95 (30.8) 196 (34.2)
352 352 352 352 352
expected, the age group that had a higher risk for death from cardiovascular disease was 70 or older group.
Mean lifetime of females was 8 years, 7 months and 27 days for the age group of 60 to 69 years and of 6 years, 7 months and 7 days for the age group of 70 years or older. In males, this time was 7 years, 10 months and 27 days for the age group of 60 to 69 years and of 6 years, 10 months and 15 days for the age group of 70 years or over.
Tables IV through VII present the results of the log-rank test for some variables, with the population stratified by age group. Through the analysis of these tables, we can observe the effect of age in the survival curves of the popu-lation and also the misleading effect of other variables that were not significant in the Cox model.
In the proportionality study of risks among the several strata of each variable, for males, the variables that had pro-portional risks and significant differences (p<0.05) between the survival curves of their different stratum were: age, wa-ge, other income, retirement, having a vehicle, possessing or not their own house, supporting the family, circulatory system disease, hypertensive disease, the presence of ma-lignancies, and average of systolic pressure measure. The variables that indicated proportional risks and nonsignifi-cant differences (p>0.05) between the survival curves were: presence of respiratory system disease, musculoskeletal di-seases, diabetes, average of diastolic pressure, and the Quetelet index. For females, the variables that indicated pro-portional risks and significant differences among the survi-val curves of their different stratum were: being married, supporting the family, presence of circulatory system di-sease and diabetes. The variables that had proportional ris-ks and nonsignificant differences between the survival cur-ves were: retirement, other income, and presence of chronic diseases and of hypertensive disease.
Using the methodology described and using a hierar-chical study of the variables in the Cox model, the variables that were predictors of death from cardiovascular disease in this study, adjusted for age, in males were: possessing a ve-hicle, supporting the family, and the presence of circulatory system disease, and in females they were: the presence of circulatory system disease and diabetes.
The results of the adjustment of the Cox regression
Table III – Morbidity in cohort of elderly of 60 years or over, according to sex. Botucatu (SP), 1983/84 - 1992
Variables Men Women Total
n (%) n (%) n (%)
Mean diastolic pressure
≤100mmHG 163 (61.3) 213 (69.2) 376 (65.5)
>100mmHG 26 (9.8) 39 (12.7) 65 (11.3)
No information 77 (28.9) 56 (18.2) 133 (23.2) Mean systolic pressure
≤136mmHG 76 (28.6) 65 (21.1) 141 (24.6)
>136mmHG 113 (42.5) 187 (60.7) 300 (52.2) No information 77 (28.9) 56 (18.2) 133 (23.2) Reference to cardiovascular disease
Yes 75 (28.2) 137 (44.5) 212 (36.9)
No 191 (71.8) 171 (55.5) 362 (63.1)
Reference to hypertension
Yes 43 (16.2) 93 (30.2) 136 (23.7)
No 223 (83.8) 215 (69.8) 438 (76.3)
Reference to chronic disease
Yes 164 (61.7) 236 (76.6) 400 (69.7)
No 102 (38.3) 72 (23.4) 174 (30.3)
Reference to diabetes mellitus
Yes 11 (4.1) 27 (8.8) 38 (6.6)
No 255 (95.9) 281 (91.2) 536 (93.4)
Table IV – Size of the sample (s), number of deaths (d) and the result of log-rank test to compare survival curves to cardiovascular diseases
estimated by the Kaplan-Meier method by variable and by age, obtained in a cohort of elderly male of 60 or older, in the end of the
period studied 1983-1992, Botucatu (SP)
60-69 years 70 years or older
Variable n d Log-rank n d Log-rank
p value p value
Color
White 157 22 0.04 82 27 0.00
Nonwhite 19 6 8 6
How long is in town
15 years or over 142 24 0.52 72 23 0.07
Less than 15 years 34 4 18 10
Possess a vehicle
Yes 73 6 0.01 28 7 0.26
No 103 22 62 26
Other incomes
Yes 47 3 0.02 23 8 0.47
No 121 25 65 25
Supports the family
Yes 170 26 0.24 79 28 0.16
No 6 2 11 5
Type of possession of real state of living Own, paying for it
or rented 165 24 0.01 80 29 0.75
Given or lent 11 4 10 4
Table V – Size of the sample (n), number of deaths (d) and log-rank test result for comparison of survival curves to cardiovascular diseases
estimated by Kaplan-Meier method, by variable and by age group obtained in a cohort of male elderly who were 60 or over, in the end of
the studied period, 1983-1992, Botucatu (SP)
60-69 years 70 years or over
Variable n d Log-rank n d Log-rank
p value p value
Mean diastolic pressure
≤100mmHG 104 14 0.45 59 18 0.34
>100mmHG 19 4 7 3
Mean systolic pressure
≤136mmHG 62 5 0.03 14 4 0.89
>136mm Hg 61 13 52 17
Reference to diabetes mellitus
Sim 5 1 0.72 6 1 0.97
Não 171 27 84 32
Reference to cardiovascular disease
Sim 48 13 0.00 63 23 0.94
Não 128 15 27 10
Reference to hypertension
Sim 29 9 0.00 14 5 0.89
353 353 353 353 353
model performed for males and females with the respective reasons for risks are found in tables VIII and IX.
Discussion
The most important variable described in this study, which identifies those groups of elderly people in the town of Botucatu who are at risk for death from cardiac diseases, is previous cardiovascular disease in those patients. Hyper-tension, which is always mentioned in the literature2,13-17, as assessed by statistical analysis was present (log-rank test) and found to be a risk factor and is represented by the va-riables: averages of systolic and diastolic pressure
measu-Tabela VI - Tamanho da amostra (n), número de mortes (d) e resultado do teste log-rank para comparação de curvas de
sobrevivên-cia a doenças cardiovasculares estimada pelo método de Kaplan-Meier por variável e por faixa etária, obtidos para uma coorte de idosos femininos de 60 anos ou mais, no final do período estudado
1983-1992, Botucatu (SP)
60-69 anos 70 anos ou mais
Variável n d Log-rank n d Log-rank
valor de p valor de p Cor
Brancos 153 11 0.52 120 40 0.25
Não brancos 26 3 9 4
Tempo no município
15 anos ou mais 148 14 0.08 103 39 0.051
Menos de 15 anos 31 0 26 5
Propriedade de automóvel
Sim 57 3 0.39 38 11 0.57
Não 122 11 91 33
Outras rendas
Sim 19 1 0.58 23 6 0.20
Não 160 13 106 38
res, family history of hypertension, and disease of the circu-latory system. For females, concerning morbidity, diabetes was another important risk described.
Regarding the socioeconomic variables, the elderly of Botucatu were generally retired, with a low fixed pension. For this reason, income was neither a good social indicator nor a risk, as formal income did not discriminate among the elderly. The Cox model revealed that having a car or sup-porting the family for the male gender was a discriminating social variable. Concerning females, no significant socio-economic variable existed as a risk factor related to cardio-vascular death; therefore, we conclude that the elderly in Botucatu are very homogeneous regarding their standard of life; most of them have a poor socioeconomic standard, that is, living for many years in a quiet city, not very large, in their own house, and with a low income.
The fact that husbands answered the interviews for the females may explain the pattern of the social variables regarding mortality in the elderly population of Botucatu. Therefore, it was impossible to evaluate socioeconomic ris-ks for the female population. Concerning the male gender, two variables, possessing a car or supporting the family, persisted until the final model as a risk factor for cardiovas-cular death in man, which may reflect only the amount of money earned, because the information regarding who sup-ported the family can concur with the one who earns more money. The same can be said about having a car.
It is also important to take into account in this discus-sion the structure of the city’s public health services. The city has a reasonable public health service, when compared with the national average, two acceptable hospitals for me-dium procedures and a medical school hospital where most of the patients are from Botucatu.
Table VII - Size of the sample (n), number of deaths (d) and log-rank test result for comparison of survival curves to cardiovascular diseases estimated by Kaplan-Meier method, by variable and by age group obtained in a cohort of female elderly who were 60 or over, in
the end of the studied period, 1983-1992, Botucatu (SP)
60-69 years 70 years or over
Variable n d Log-rank n d Log-rank
p value p value
Mean diastolic pressure
≤100mmHG 118 10 0.36 95 31 0.01
>100mmHG 10 1 11 7
Mean systolic pressure
≤136mmHG 42 2 0.46 23 8 0.93
>136mmHg 104 9 83 30
Reference to diabetes mellitus
Yes 16 2 0.35 11 6 0.009
No 163 12 118 38
Reference to cardiovascular disease
Yes 80 8 0.32 57 25 0.01
No 99 6 72 19
Reference to chronic diseases
Yes 136 10 0.68 100 39 0.01
No 43 4 29 5
Table VIII – Results of the Cox regression model adjustment to the data of survival to cardiovascular disease in a cohort of male
elderly (60 years or over). Botucatu (SP), 1983-1992
Variable Odds ratio
(confidence interval - 95%) Age (70 years or over/60-69 years) 2.65 (1.58 - 4.48) Supports the family (no/yes) 2.84 (1.23 - 6.58) Possess a vehicle (no/yes) 2.36 (1.27 - 4.50) Reference to circulatory
system disease (yes/no) 1.91 (1.14 - 3.37)
Table IX - Results of the Cox regression model adjustment to the data of survival to cardiovascular disease in a cohort of female
elderly (60 years or over). Botucatu (SP), 1983-1992
Variable Odds ratio
(confidence interval - 95%) Age (70 years or over/60-69 years) 6.54 (3.56 - 12.0) Reference to circulatory 1.98 (1.18 - 3.35) system disease (yes/no)
354 354 354 354 354
1. Kalache A, Veras RP, Ramos LR. O envelhecimento da população mundial. Um desafio novo. Rev Saúde Pública, 1987; 21: 200-10.
2. Soares CA. Envelhecimento da população paulista: uma análise do período 1970-91. Conjunt Demogr 1994; 29: 17-31.
3. Hernandez Yero A, Diaz O, Rodrigues Garcia J. Valor del certificado de defuncion el la diabetes mellitus. Rev Cubana Med 1987; 26: 144-9.
4. Kirschbaum A, Cornejo Arias E. Mortalidad del senescente en Chile. Cuad Med Soc 1988; 29: 134-8.
5. Camargo ABM. De que morrem os idosos em São Paulo? Conjunt Demogr 1993; 23: 21-42.
6. Fernandes JG. Epidemiologia das doenças cerebrovasculares/Epidemiology of cerebrovascular diseases. Rev Assoc Med Rio Gd do Sul 1989; 33: 353-61. 7. Ramos LR, et al. Doenças cardiovasculares no idoso: implicações clínicas dos
dados epidemiológicos. Rev Soc Cardiol Estado de São Paulo 1991; 1: 6-12. 8. Yazaki LM, Saad PM. Mortalidade da população idosa. In: Fundação Sistema
Estadual de Análise de Dados. O idoso na Grande São Paulo. São Paulo: Realidade Paulista, 1990: 125-9.
9. Chor D, Duchiade MP, Jourdan AMF. Diferencial de mortalidade em homens e mulheres em localidade da região sudeste, Brasil - 1960, 1970 e 1980. Rev Saúde Pública, 1992; 26: 246-55.
10. Kromhout D, et al. Serum cholesterol and 25-Year incidence of and mortality from myocardial infarction an cancer. Arch Intern Med 1988; 148: 1051-5. 11. Pekkanen J, et al. Ten-year mortality from cardiovascular disease in relation to
cholesterol level among men with and without preexisting cardiovascular disease. N Engl J Med 1990; 322: 1700-7.
12. Rosolova H, Simon J, Sefrna F. Impact of cardiovascular risk factors on morbidity and mortality in Czech middle-aged men: pilsen longitudinal study. Cardiology 1994; 85: 61-8.
13. Andersson OK, Almgren T, Persson BS, Samuelsson O, Hednen T, Wilhelmsen L. Survival in treated hypertension: follow up study after two decades. Br Med J 1998; 317: 167-71.
14. Boshuizen HC, Izaks G, Van Buuren S, Ligthart GJ. Blood pressure and mortality
References
in elderly people aged 85 and older: community based study. Br Med J 1998; 316: 1780-4.
15. Glynn RJ, et al. Evidence for a positive linear relation between blood pressure and mortality in elderly people. Lancet 1995; 345: 825-9.
16. Menotti A, Seccareccia SG, Giuli B. The predictive role of systolic, diastolic and mean blood pressures on cardiovascular and all causes of death. J Hypertens 1989; 7: 595-9.
17. Staessen J, et al. Relation between mortality and treated blood pressure in elderly patients with hypertension: report of the European Working Party on High Blood Pressure in the elderly. Br Med J 1989; 298: 1552-6.
18. Taylor JO, et al. Blood pressure and mortality risk in the elderly. Am J Epidemiol 1991; 134: 489-501.
19. Rissanen A, et al. Weight and mortality in finnish men. J Clin Epidemiol 1989; 42: 81-9.
20. Butler WJ, et al. Mortality from coronary heart disease in the Tecumseh Study. Am J Epidemiol 1985; 121: 541-7.
21. Vagero D, Norell SE. Mortality and social class in Sweden - Exploring a new epidemiological tool. Scand J Soc Med 1989; 17: 49-58.
22. Mendes-de-Leon CF, et al. Risk of mortality and coronary heart disease by marital status in middle-aged men in The Netherlands. Int J Epidemiol 1992; 21: 460-6. 23. Olsen O. Impact of social network on cardiovascular mortality in middle aged
Danish men. J Epidemiol Community Health 1993; 47: 174-80.
24. Carandina L, Sanches O, Carvalheiro JR. Análise das condições de saúde e de vida da população urbana de Botucatu (SP). I. Descrição do plano amostral e avaliação da amostra. Rev Saúde Pública 1986; 20: 465-74.
25. Kaplan EL, Meier P. Nonparametric estimation from incomplete observation. J Am Statistical Association 1958; 53: 457-81.
26. OMS. Manual da Classificação Estatística Internacional de Doenças, Lesões e Causas de Óbito: classificação internacional das doenças. São Paulo, 1975; 1: 815. 27. Cox DR. Regression models and life tables (with discussion). J Royal Statistical
Society, Ano??? B; 43: 187-220.
28. Collet D. Modelling survival data in medical research. London: Champman & Hall, 1994: 347p.
In addition, it is important to emphasize that these were the variables that were reported in this study as risk factors for cardiovascular death. Other important variables repor-ted in the literature, such as cholesterol, family history, body mass index, and smoking 10-18, were not investigated becau-se we had no data in the 1983/84 study.
Another bias in the results was the errors in death cer-tificates, which is not insignificant in third world countries, and of which we do not have an exact count.
Therefore, risk factors considered important for car-diovascular death were hypertension for men, and, for fema-les, diabetes mellitus.
To conclude with, in Brazil’s Sistema Único de Saúde (Single Health System) attention is paid to the elderly in the Programa de Saúde do Adulto (Adult Health Program), focu-sing on diabetes and hypertension.
Based on the results achieved, we recommend that
this program is maintained in the short- and mid-term, espe-cially in regards to prevention, which would be the interven-tion recommended to the town, with the purpose of decrea-sing death rates due to cardiovascular diseases in this age group. The selection of social risk groups would be effecti-ve with the aim proposed through family supporting and possessing a car.