OBSERVED AIR POLLUTION SPECIFICS
OF THE VALLEY-BASED TOWNS
ZOLTÁN UTASI1, ILONA PAJTÓK-TARI, JÁNOS MIKA, CSABA PATKÓS, ANTAL TÓTH
ABSTRACT.Observed air pollution specifics of the valley-based towns. There are 21 valley-based towns in the 100 most populated ones of Hungary. This topo-graphical feature may be advantageous due to mezoscale circulation between the valley or basin, containing these settlements and the surrounding hills. On the oth-er hand, the hills form a mechanical obstacle that may limit the voth-ertical mixing of pollution. Final result of these counteracting features are analysed by comparing air pollution characteristics of these settlements with those in two control groups, also counting 21-21 non-valley towns of the country. Each group represents slight-ly over 1 million inhabitants. Nitrogen dioxide (NO2), sulphur-dioxide (SO2) con-centrations and the total particulate matter below 10 µm (PM10) are considered. Annual mean, maxima and median values are analysed in 2007. For NO2 the val-ley-based towns are slightly cleaner, whereas for SO2 the situation is the opposite. The PM10 values do not indicate much difference between valley based and fully plain settlements. For explanation of these results, selected settlement and com-munal statistics are also compared. The paper is terminated by a sub-collection of similar valley-based towns in Central Europe.
Keywords. Valley-circulation, nitrogen-dioxide, sulphur-dioxide, PM10
1. HUNGARIAN TOWNS LOCATED IN VALLEYS
We can group our towns in many ways. Among these cases the distinctive point of view whether that settlement is located in a valley (in a smaller basin) is a rare factor. In turn in Hungary the numerical rate of such settlement is not negligi-ble.
As we can see from Figure 1 (next page) there are 23 valley-based towns in Hungary where population (according to data of 2007) exceeds 10.000 people. With the exception of The Great Hungarian Plain and the Small Hungarian Plain every macro landscape of the country has some towns located in valleys with a sig-nificant population. Hereafter omitting Kőszeg and Bicske, we analyse 21 valley-based towns with the control groups written in the next points in order to state the characteristics of these towns in comparison with not valley located towns.
Placing these towns (Figure 2) along the population list of the country (omitting Budapest, which is bigger by 1-3 orders of magnitude) we can see that the ratio of valley-based towns is high among our most populated towns. In the
1 Eszterházy Károly College, Faculty of Natural Sciences, Department of Geography, 3300 Eger, Eszterházy Square no. 1, Hungary, [email protected], [email protected], [email protected],
first 5 we find two in valley-based towns (40%). In the first 20, eight ones can be found, (40%, again). Among the first 50 we find fifteen in valley-based towns, that is 30%. Finally among the first 100 towns proportionally by far less, 21 such towns can be found. From the 21 analysed towns by turns 7-7 fall to North Transdanubia, South Transdanubia and North Hungary. (See for more details in the next Section.)
Fig. 1. Distribution of towns populated by more than 10.000 inhabitants located in valleys. (The two smallest towns, Kőszeg and Bicske are omitted from the analyses.)
Fig. 2. The distribution of the first one hundred towns according to the number of population in 2007. The chosen 21 valley-based towns are marked by black columns.
2. SELECTION OF CONTROL GROUPS
search-ing from all three regions 7-7 towns, similar to the number of population of the val-ley-based towns and totally similar to the population of the 7 towns. (Table 1) Ac-cording to data per macro regions and to the cumulative data of the three regions it was passed very well. The difference between the population of the 7-7 valley-based and control cities is less than one thousand people in all three cases.
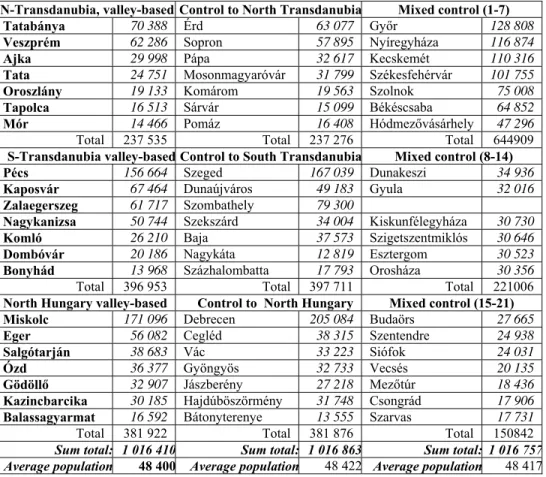
Tab. 1. The selected 21-21 valley-based, control and mixed control towns. The control towns are similar to valley-based ones according to area and population. The mixed control group contains 7 West- and 14 East-Hungarian towns to keep population equity.
N-Transdanubia, valley-based Control to North Transdanubia Mixed control (1-7)
Tatabánya 70 388 Érd 63 077 Győr 128 808
Veszprém 62 286 Sopron 57 895 Nyíregyháza 116 874
Ajka 29 998 Pápa 32 617 Kecskemét 110 316
Tata 24 751 Mosonmagyaróvár 31 799 Székesfehérvár 101 755
Oroszlány 19 133 Komárom 19 563 Szolnok 75 008
Tapolca 16 513 Sárvár 15 099 Békéscsaba 64 852
Mór 14 466 Pomáz 16 408 Hódmezővásárhely 47 296
Total 237 535 Total 237 276 Total 644909
S-Transdanubia valley-based Control to South Transdanubia Mixed control (8-14)
Pécs 156 664 Szeged 167 039 Dunakeszi 34 936
Kaposvár 67 464 Dunaújváros 49 183 Gyula 32 016
Zalaegerszeg 61 717 Szombathely 79 300
Nagykanizsa 50 744 Szekszárd 34 004 Kiskunfélegyháza 30 730
Komló 26 210 Baja 37 573 Szigetszentmiklós 30 646
Dombóvár 20 186 Nagykáta 12 819 Esztergom 30 523
Bonyhád 13 968 Százhalombatta 17 793 Orosháza 30 356
Total 396 953 Total 397 711 Total 221006
North Hungary valley-based Control to North Hungary Mixed control (15-21)
Miskolc 171 096 Debrecen 205 084 Budaörs 27 665
Eger 56 082 Cegléd 38 315 Szentendre 24 938
Salgótarján 38 683 Vác 33 223 Siófok 24 031
Ózd 36 377 Gyöngyös 32 733 Vecsés 20 135
Gödöllő 32 907 Jászberény 27 218 Mezőtúr 18 436
Kazincbarcika 30 185 Hajdúböszörmény 31 748 Csongrád 17 906
Balassagyarmat 16 592 Bátonyterenye 13 555 Szarvas 17 731
Total 381 922 Total 381 876 Total 150842
Sum total: 1 016 410 Sum total: 1 016 863 Sum total: 1 016 757 Average population 48 400 Average population 48 422 Average population 48 417
The other 21 towns, called „the mixed control group”, were chosen to in-clude every towns with more than 30.000 inhabitants which were not figured among the previous 2x21 towns. Towns which were fixed in this way compose in one block the 40 most populated settlements. (The most populated town which is not included in any groups is the No 41, Szentes.)
cardi-nality. That is why that group includes 7 towns from the West and 14 from the East of Hungary. In this way, the number of inhabitants of the three groups, 1.016.000 each, differs from each other with less than 500 people. The average population in the valley-based towns is 48.400 inhabitants.
3. UTILISED CSO AND AIR-QUALITY DATA
In our analysis we used the data of the Hungarian Central Statistical Office of 2007 (CSO, 2008). On the ground of the official county yearbooks we graded the chosen 3x21=63 towns according to considerations performed on the CD-s and to further 16 indicators which standardize the former ones by the number of popu-lation and the area of towns. From the composed indicators finally we retained those 157 statistic indexes on the base of which grading the original 288 towns, the correlation coefficients of the given index against other indexes in neither pairing could reach 0,995. (With this method we wanted to eliminate the redundant, similar indices.)
The results will be stated later in the following six essential groups: hous-ing and population; communal supply; jobs and social net, enterprises and services; tourism, crime, accidents; cultural and education supply.
On these data only the rankings were examined the original quantities typi-cal for the individual towns were not. We analyzed the rankings of the groups hav-ing 21-21 elements from two point of views. We calculated the averages of the rankings, which would be 32 in every group (namely the average of rankings 1-63) in case of totally identical circumstances.
We also examined in what proportion do fall the rankings of the 21-21 towns among the highest, middle and the lowest 21-21 rankings. The correspond-ence of the three-factor (two degree of freedom) distribution that was constituted in this way was examined by χ2 test.
We determined the decision threshold for the difference of the averages of the rankings to reach a ratio of the significant differences identical with the ratio of the χ2 test in case of a 5% significance level. This threshold was indicated by at least a 6.4 difference between the frequency values. This difference at the same time is 20% of the expected value.
The measurement of air quality in 2007 was done by the National Air Pol-lution Observation Network (OLM), which now belongs to the Hungarian Meteor-ological Service. The evaluation was based on the three main components regis-tered in the manual measurement network: nitrogen dioxide, sulphur dioxide and settling dust. In this network in the country level stations in 97 and 86 settlements pursued the measurement of nitrogen dioxide and sulphur dioxide in every second day, and in 120 settlements were stations to collect 30 days particulate matter. Fur-ther details can be found in the articles by Györgyné Váraljai I., (2008 a,b).
correlation coefficients as follows: NO2: 0,69, SO2: 0,71, particulate matter (PM10): 0,80, so these are not too tight.
We note, that earlier we have already analysed the 2007 data on air pollu-tion and CSO of all towns from another point of view. (Makra L. et al., 2009, Ütőné Visi J.et al., 2009)
4. SPECIFICS IN THE AIR POLLUTION
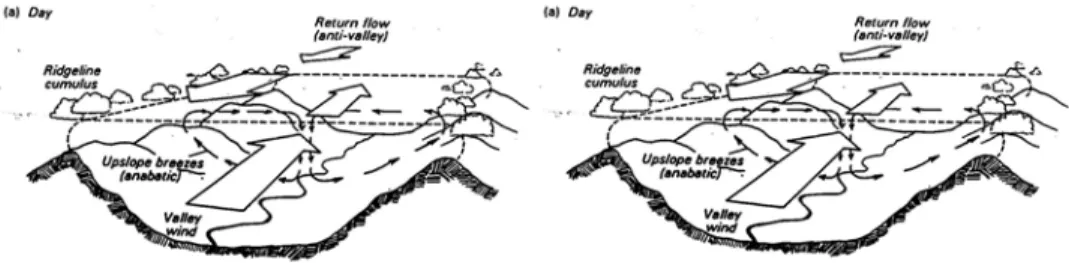
Before presenting the results of air pollution differences between the sets of valley-based and control towns, let us comprehend what kind of differences one may expect a priori. There are two aspects, counteracting to each-other. On one hand, the valleys may worsen the air quality since the surrounding hills form me-chanical barriers to horizontal winds. On the other hand, however, the local hill-valley circulation may mix the city air, which is especially important in anti-cyclonic situations, often accompanied with critical high concentrations elsewhere. The scheme of this circulation is presented in Figure 3. The directions of winds are different during the day and the night. Since this circulation delivers pol-lution out of the valley especially during the day, this may release mainly the summer smog situations. (Ozone observations are not included in the present anal-ysis, unfortunately.
Fig. 3. Scheme of the hill-valley circulation often bringing air quality improvement.
Let us see which factor is stronger in the valleys! As we can see in the fol-lowing tables, the answer in totally different in the three air quality components. We analysed only one year, the 2007 specific weather of which could affect the quantitative differences, bit unlikely the qualitative statements.
One can establish from Tables 2-4, below that the valley-based towns are better equipped by manual air quality observing stations than the control ones. Put-ting together all the three components, there are 55 stations in the 3 x 21 = 63 pos-sible, which is 87 %. The same numbers are 80 stations from the 126 pospos-sible, i.e. 64 %. The difference indicates an a priori expectation of the responsible agency that the valley based stations may be more endangered by high pollution. But the data do not support this prejudice unequivocally.
towns. This is an interesting and unexpected result, since the main source of nitro-gen-dioxide is traffic. However, considering the above data on lower numbers of car accidents may reflect that car usage is not so strong in these valley-based than elsewhere, possibly partly from aging structure, as well.
Tab. 2. Annual mean, maximum and distribution median concentrations of nitrogen-dioxide in the valley (v), control (c), mixed control (mc) and both control groups (cmc), with the number of stations providing data for averaging. Theirmaxima: 21, or 42 in cmc.
NO2 (μg/m 3
) Ann. meanMaxMedian
v (19 stations) 26 95 23
c (12 stations) 29 117 27 mc (14 stations) 30 111 27
cmc (26 stations) 30 114 27
Tab. 3. The same as Table 2 for sulphur dioxide.
SO2 (μg/m 3
) Ann. mean Max Median v (16 stations) 2,39 21,38 1,70
c (11 stations) 2,29 19,33 1,70 mc (14 stations) 2,03 15,28 1,55 cmc (25 stations) 2,14 17,06 1,61
For the SO2, however, the situation is the opposite (Table 3). The concen-trations are higher in the valley-based towns in all the three aspects. Sulphur-dioxide is mainly of heating and energy-production origin with likely distant sources affecting the longer lifetime SO2, as well. Here the differences are the most characteristic in case of maxima the maxima with ca. 20 %, whereas the annual mean differs with ca. 10 % and the median are even closer to each other. Some dif-ferences are between the behaviour of control and mixed control groups. One should also note, however, that these SO2 concentrations are already much less dangerous for the human health or open-air constructions than they were a few decades before.
Tab. 4. The same as Table 2 for particulate matter.
PM10 (μg/m3) Ann. meanMaxMedian
v (20 stations) 6,6 18,7 5,4
c (13 stations) 5,7 19,0 6,1 mc (16 stations) 7,1 16,7 4,7 cmc (29 stations) 6,5 17,7 5,3
that even the shape of the distribution can be different in the control groups. Con-sequently one can only state that no unequivocal differences could be established by the applied tools between the valley based and control stations in case of PM10.
5. SPECIFICS IN SOCIO-ECONOMICAL CHARACTERISTICS
The analyses of CSO data gives evidence on a great number of significant dif-ferences. Due to the lack of space and different scope of the paper, we refer the reader to another recent conference paper by Utasi et al. (2012).
In case of „housing and population” it is striking that valley-based towns are lo-cated on a smaller area, the mobility of flats is smaller, namely less new flats are built, but there are less abandoned ones, as well. The population decreases faster, mainly be-cause of migration, and number of enterprises is relatively high.
In case of the “communal supply” the valley-based location seems to be a nega-tive effect. The consumption of piped gas and some water consumption data are smaller. Only waste transport has better position here than in the plain towns.
In the area of „jobs and social net” on plains are more job-seekers, and the num-ber of regular aid gainers, but less people can get day care. In conformity with this, it is surprising that more people can get pension (i.e. those who can get it).
In the topic of „enterprises and services” there are the far least significant differ-ences between valley-based and plain towns. Only in case of cable televisions and phones have valley-based surplus that point to a relative well-off situation of older gener-ations.
The values in the “cultural and education supply” in case of the number of kin-dergarteners and pupils and libraries mean surplus, while in the higher education a lack related to the plain towns.
In the “tourism, crime, accidents” multicoloured topic we find negative anomaly everywhere in case of the valley-based towns. In reality it is negative only in case of some indicators of tourism. The significantly smaller value of accidents and injured peo-ple is an opportunity, although it also reminds at the high mean age.
Behind the above differences, there is a coherent social background of three main factors. The first one is the past before the changing of regime, when majority of valley-based towns were dominated by favourable economic conditions connected to mining and heavy industry. As a result of these, of the smaller areas, limited by the relief, and the favourable circumstances of subsistence a great population density was devel-oped. Some certain positive elements (high pensions, many library books and phone lines) can be found even today in this settlement group.
The second factor is the devaluation of the products of classic heavy industry, caused by the revolution in informatics, which was strengthened by the new political val-ues of the changing of regime as well. In consequence of it in the valley-based towns life circumstances worsen faster than in plain towns. Many valley-based towns got into the group of disadvantageous settlements or regions.
members of the active generations staying here. The utilization of the statistically existing infrastructure is lower than that of the plain settlements being in a more favourable situa-tion.
6. EUROPEAN OUTLOOK
A marked analysis of valley-based towns can result in interesting outcomes all over Europe, as such towns can be found in all countries. Below we list some counties where such towns were already recognised. In many countries much more settlements can be taken into account. That is, why we choose a population of 50000 for selection threshold in a European dimension.
Tab. 5. Valley-based towns with >50000 inhabitants in some European countries.
Country Pcs Most populated thousand inhab.
Hungary 8 Miskolc 169
Austria 4 Graz 259
Bulgaria 6 Sofia 1 205
Czech Republic 6 Usti nad Labem 120
Greece 2 Ioannina 70
Poland 2 Walbrzych 120
Romania 14 Bacau 188
Switzerland 8 Zürich 372
Slovakia 4 Kosice 235
Slovenia 3 Ljubljana 272
In Table 5 we listed the number of towns per country and the names of the most populated ones. In a further examination we plan to repeat above the Hungar-ian comparison for these and for other European countries.
REFERENCES
1. CSO (2008): County-level Statistical Yearbooks 2007. with CD-supplement. Cen-tral Statistical Office, Budapest (1+19 vol.: in Hungarian)
2. Györgyné Váraljai I. (2008a): Nation-wide assessment on air pollution quality in 2007, based on the data of the manual observation network. (in Hungarian).
(www.kvvm.hu/olm/docs/2007_ertekeles_manualis.pdf - downloaded: 2009. 09.19)
3. Györgyné Váraljai I. (2008b): Nation-wide assessment on air pollution quality in 2007, based on the data of the automatic observation nerwork. (in Hungarian)
(www.kvvm.hu/olm/docs/2007_ertekeles_automata.pdf – downloaded: 2009. 09.19)
4. Makra L., Pajtókné Tari I., Mika J.and Gál A., (2009): Ranking our towns accord-ing to indices of the environmental infra-structure and the air-pollution (2007) In: Changing Earth, changing society, changing knowledge acquiring. (Pajtók-Tari I. – Tóth A. eds.), Eger, October 16, 2009, 297-305 pp.
5. Utasi Z., Patkós Cs.,Tóth A., MikaJ., 2012: Environmental and social geography
characteristics of towns located in valleys. In: Social Geography Challenges in