Use of Secondary Sewage Water as a Culture Medium for
Chaetoceros gracilis
and
Thalassiosira
Sp (Chrysophyceae)
in Laboratory Conditions
.
Rauquírio André Albuquerque Marinho da Costa; Maria Luise Koening
*and Sílvio José
de Macêdo
Department of Oceanography of the Federal University of Pernambuco, Arquitetura Ave. s/nº, Campus Universitário, Cidade Universitária 50. 739-540 - Recife - Pernambuco - Brazil.
ABSTRACT
Experiments were carried out in order to test the efficiency of additions of secondary sewage as a culture medium for Chaetoceros gracilis and Thalassiosira sp (Chrysophyceae) under laboratory conditions. These algae were cultivated in sea water with concentrations of 10%, 20%, 30% and 40% of wastewater. The results were compared with those obtained by the nutritive medium f2 of Guillard (1975). The best results in terms of cellular densities were observed at 40% additions. There were significant differences (significance levels of 5%) between the nutritive medium f2 and the 40% additions for both the species. Maximum cellular densities observed for all additions tested were, 4,125.00 x 103 cells/ml for Chaetoceros gracilis on the ninth day and 834.00 x 10³ cells/ml for Thalassiosira sp on the fifth day. Biomass was higher in the nutritive medium f2 than in the other treatments, reaching average values of 2,363µg/ml for Chaetoceros gracilis. At all experimental units, the best results were registered at 40% addition for Chaetoceros gracilis, where average values of 0.768µg/ml were observed on the fifth day, and at 30% additions for Thalassiosira sp where 0.883µg/ml were observed on the thirteenth day. It was concluded that secondary sewage could be used as a culture medium for the species tested here, after large scale tests.
Key words: Microalgae (Chrysophyceae), Culture, Secondary sewage
*Author for correspondence
INTRODUCTION
The culture of microalgae begun at the end of the 19th century, becoming one of the great discoveries of our time for Botany and for Science in general. In the beginning, research was focused on creating a method of culture that could propitiate the survival and maintenance of clowns in the laboratory, to develop knowledge about the photosynthetic mechanisms of the organisms. After some time, especially after the Second World War, new and varied proposals surged for the utilization of phytoplanktonic organisms.
In Brazil, even though the culture of microalgae is recent, its activity expanded in parallel with the development of aquaculture. The necessity of a great supply of microalgae for the nourishment, direct or indirect, of various larvae
stages of cultivable organisms of high economic value, generated an intensification of studies concerning the development of alternative mediums to reduce the costs of natural and artificial mediums previously in use, which were expensive due to the use of chemical substances of high commercial value.
Data obtained about the studies of the effects of urban and industrial wastewater additions on the phytoplanktonic populations of coastal regions (Taslakian & Hardy, 1976) revealed an interest in specialists of phytoplankton, concerning the use of raw sewage water at different treatment stages, as a source of nutrients for the intensive culture of microalgae.
In Brazil, only a few preliminary studies were carried out on the usage of untreated municipal sewage water for the culture of microalgae (Yoneshigue-Braga et al., 1977; Brazil-Lima &
Aidar, 1996), being this a pioneering study for the Northeast region of Brazil. The study´s objective is to test the efficiency of various secondary wastewater additions, on the monospecific culture of Chaetoceros gracilis
and Thalassiosira sp, species which are
commonly utilized as alimentary diet for organisms raised in this region´s aquaculture.
The study focuses on aspects such as cellular density and microalgae biomass, as well as on the comparison of the results with those obtained through the use of the medium f2 (Guillard, 1975).
MATERIALS AND METHODS
Experiments for Chaetoceros gracilis were
designated as follows:
Cg0 and Cg0'- filtered and autoclaved sea water; Cgl and Cgl’- filtered and autoclaved sea water with the addition of the medium f2 (Guillard, 1975); Cg10 and Cg10'- filtered and autoclaved sea water, with 10% of secondary treated waste water; Cg20 and Cg20'- filtered and autoclaved sea water, with 20% of secondary treated wastewater; Cg30 and Cg30'- filtered and autoclaved sea water, with 30% of secondary treated wastewater; Cg40 and Cg40'- filtered and autoclaved sea water, with 40% of secondary treated wastewater.
For Thalassiosira sp, the same denomination
was used, with the replacement of Cg by Th.
The salinity of the quotas and the replicas tested after the filtration in “cuno” and before the autoclaving process were adjusted at 30‰ by freezing method to avoid errors of interpretation. The salinity of all the experimental units and concurrent replicas were determined by the Mohr-Knudsen method (Strickland & Parsons, 1972).
The initial volume of each experimental unit and of their replicas was 700ml, to which an unialgal clone of 60ml, from each microalgae used, was added according to the respective bioassay.
Water used throughout the course of the bioassays was first filtered using Whatman filters, then in “cuno” filters with an aperture of 5 and 1µm, and later autoclaved (45 minutes, one atmospheric pressure). The wastewater, was filtered using Whatman filters (15 cm) before passing through the same humid sterilization process.
The tested bioassays were maintained at a constant temperature of 22 ± 1ºC, and exposed to a photoperiod of 24 hours under fluorescent lights of 20 Watts.
The analysis of the concentrations of nutrient salts, were carried out in the beginning, on the seventh day and at the end of the testing according to method described by (Strickland & Parsons, 1972; Grasshoff et al., 1983), through
the collection of subsamples of 150ml, which were kept frozen.
Both the results of the concentrations of nutrient salts and of the hydrogenionic potential were expressed in average values.
Aliquotes of 5ml, were collected daily for the determination of the microalgae density in cell/ml. For this, the Neubauer chamber was used, counting the number of cells with the help of the binocular optic microscope Bausch & Lomb, and expressing them in average values of cells/ml.
The daily average growth rates were measured during the exponencial phases of each bioassay through the formula: k=[3,332/(t2
-t1)].(logN2/N1), (Guillard, 1973) ,in which:
k- daily growth rate; t- time; N- number of cells.
The average chlorophyll-a concentrations were
measured through the filtration of subsamples of 2.5 to 10 ml of each unit tested and respective replica, in intervals of 4 days, totaling 5 filtrations throughout the bioassays for each control and tested additions.
For the determination of the chlorophyll-a total
conventional stages of the method were followed, carrying out the readings in a Micronal spectrophotometer, in wavelengths of 630, 645, 665 and 750mm.
The calculations of the chlorophyll-a
concentrations were carried out according to the formula of (Parsons & Strickland 1963):
11.6 . D 665 – (1.31 . D 645 + 0.14 . D630 + D 750)
µg/ml=__________________________________. v V . L
v- acetone volume
V- sample volume filtered
D- optical density at the different wavelengths L- optical way of the cuvette
Statistic analysis of the data of cellular density and biomass
The formula of adjustment of the number of cells/ml in relation to time of culture of the two tested species, using sea water (experimental unit 0), the nutritive medium f2, and additions of 10%, 20%, 30% and 40% of wastewater was the following:
Nº of cells =ββ0 t e-ββ1t + εεI (Santos, 1995), where:
t- time of culture (days),ββ0 e ββ1- parameters of the
model; εεI - error associated to each observation.
To compare the microalgae´s growth model the following equation was used:
W=(n1+n2).LN (SQR1,2 /(n1+n2))-n1.LN
(SQR1/n1)-n2 . LN(SQR2/n2) where:
W- statistic to be compared with 2 ; n1- number
of data from sample 1; n2- number of data from sample 2; SQR1,2- sum of the squares of the
residues of samples 1 and 2; SQR1- sum of the
squares of the residues of sample 1; SQR2- sum of the squares of the residues of sample 2.
The comparative statistic “W” was analysed to the confidence level of 5% (P<0.05). The computer program CAJUS (Santos, 1995) was used for the adjustment of the growth curves. The same method described for population density (cells/ml) was used for the statistical analysis of the biomass.
RESULTS AND DISCUSSION
Nutrient salts
The results concerned with the nutrient concentrations (nitrite-N, nitrate-N, silicate-Si and phosphate-P) presented higher values on the first day and lower on the seventh day of
experiment. On the last day, higher values than the ones registered in the seventh day were observed in most of the experiments. This was due to the non-axenic cultures, which propitiated the nutrient remineralization by the bacteria.
The nitrite-N maximum (8.954µmoles.1-1, in the experimental unit Th40) and minimum (0.016µmoles.1-1, in the experimental units Th30 and Th40) concentrations were registered on the first and seventh days of culture, respectively. For nitrate-N, the maximum concentration obtained was 14.293µmoles.1-1 on the first day (experimental unit Cg40), while the minimum was 0.485µmoles.1-1 on the seventh day of culture (experimental unit Cg10). For silicate-Si, concentrations oscillated between 257.794µmoles.1-1 in the experimental unit Cg40 on the first day, and 11.536µmoles.1-1 in the experimental unit Cg30 on the seventh day of experiment. The maximum concentration of phosphate-P was 29.281µmoles.1-1 on the first day, and the minimum was 0.012µmoles.1-1 on the seventh day.
In the experiments proposed in this study, the concentrations of nutrient salts (nitrite-N, nitrate-N, silicate-Si, and phosphate-P) in some of the tested additions, were higher than the ones supplied by the nutritive medium f2 (Guillard, 1975), especially in the 20%, 30%, and 40%, although, this last medium supplied higher concentrations of nitrate. This fact, can have caused a higher microalgal production in the control enriched bioassays, as the assimilation of nitrogen by these is much greater that the rest of the nutrient salts.
The wastewater also presented high concentrations of silicate, mainly in the 30% and 40% additions, which rendered higher values to the ones obtained by the nutritive medium f2. This also did not constitute a limiting factor for the growth of the tested diatoms during the bioassay.
The nutrient concentrations observed for the various experimental units tested, was higher than most values gathered by other authors, in respect to their use of alternative mediums: small dilutions of wastewater (Yoneshigue-Braga et al., 1977); organic extracts of the
of chicken manure aerobically biodigested (Paniágua-Michel et al., 1987); chicken manure (Lacerda, 1988); mineralized and unmineralized syrup (Koening et al., 1988; 1990), among
others.
Population density and daily growth rate Chaetoceros gracilis
The control bioassay enriched by the nutritive medium f2, presented a minimum density of 26.25 x 10³ cells/ml on the first day, and a maximum of 6,760.00 x 103 cells/ml on the eighth day of culture. For this bioassay the daily growth rates oscillated between 0.038 and 3,664 divisions/day.
For the bioassay treated with 30% wastewater, the minimum density registered was of 40.00 x 10³ cells/ml on the first day, while the maximum was of 3,535.00 x 103 cells/ml on the ninth day of culture. The daily growth rates varied between 0.501and 3.175 divisions/day.
In the highest concentration tested, that of 40% wastewater, a minimum density of 25.00 x 10³ cells/ml was observed on the first day, and a maximum of 4,125.00 x 103 cells/ml on the ninth day of the experiment. The daily growth rates oscillated between 0.027 and 3.016 divisions/day (Table I).
When compared statistically to the significance level of 5% (P<0.05), significant differences were found between all the tested additions and the nutritive medium f2. These differences were also registered when the various additions were compared between themselves (Table IIa).
Thalassiosira sp
The enriched control bioassay presented a minimum density of 8.75 x 10³ cells/ml on the first day, and a maximum of 876.25 x 10³ cells/ml on the twentieth day of the experiment. The daily growth rates oscillated between 0.353 and 2.362 divisions/day.
For the bioassay treated with 30% wastewater, respective minimum and maximum densities of 10.00 x 10³ and 529.00 x 10³ cells/ml were observed on the first and ninth days. The daily growth rates oscillated between 0.004 and 2.852 divisions/day.
In the bioassay with 40% wastewater, a minimum population density of 8.75 x 10³ cells/ml was registered on the first day, while the maximum was registered with 834.00 x 10³ cells/ml on the fifth day. The daily growth rates for this bioassay oscillated between 0.391 and 2.947 divisions/day (Table I).
For this species, the statistical treatment showed similar results to the ones observed for
Chaetoceros gracilis, i. e, all the comparisons
demonstrated significant differences between the varying additions utilized in the experiment (Table IIb).
The data pertaining to the daily population densities obtained during the experiments for the two species can be seen in figures 1a and 1b.
Table I. Minimum and maximum populacional
densities and growth rates of Chaetoceros gracilis
and Thalassiosira sp obtained with different
additions.
Chaetoceros gracilis
ADDITIONS POPULACIONAL GROWTH
DENSITIES (x103) RATES (xd-1)
F2 26.25* - 6,760.00** 0.038*-3.664**
Cg0 33.50 - 2,060.00 0.390 -2.721
Cg10 32,50 - 2,063.00 0.037 -3.016
Cg20 31.25 - 2,995.00 0.011 -5.287
Cg30 40.00 - 3,535.00 0.501 -3.175
Cg40 25.00 - 4,125.00 0.027 -3.016
Thalassiosirasp
ADDITIONS POPULACIONAL GROWTH
DENSITIES (x103) RATES (xd-1)
F2 8.75* - 876.00** 0.353* -2.362**
Th0 15.00 - 123.00 0.407 -1.222
Th10 11.25 - 316.00 1.874 -2.662
Th20 12.50 - 453.00 0.501 - 2.291
Th30 10.00 - 529.00 0.004 -2.852
Th40 8.75 - 834.00 0.391 -2.947
* Minimum values column / ** Maximum values column.
In terms of microalgal densities, the best results when compared with the bioassays provided with enrichments by the nutritive medium f2 were registered in the bioassays Cg40 for
Chaetoceros gracilis with 4, 125 x 103 cells/ml
on the ninth day, and Th40 for Thalassiosira sp
daily growth rates, the best results were observed in Cg20 for C. gracilis with a value of
5.287 divisions/day between the first and second days. This fact doesn´t necessarily imply a greater algal production, as the rates vary daily, thus it is the sum of the daily growth rates that determines a greater or lesser production. In this way, these rates serve only to point out the growth speed of the microalgae in culture.
Yamashita & Magalhaes (1984), in a tentative to reduce the costs for the mass production of C.
gracilis, used for the feeding of shrimp larvae
(zoeae) of the species Penaeus brasiliensis,
studied the use of four alternative mediums (B1, B-2, B-3 and B-4), developed from agricultural fertilizers. According to these authors, the medium B-1 (urea - 60mg/l, supertriplephosphate 30mg/l and sodium silicate -15mg/l) was the one that rendered the highest algal density, reaching 6,415 x 103 cells/ml on the sixteenth day of culture, which was higher than the value obtained by the conventional medium frequently used in the Institution. Although this value is higher than the one obtained by the wastewater for the culture of the same species (4,125 x 103 cells/ml), this small difference doesn´t represent, in practical levels, a greater or lesser efficiency of this medium, when compared to the agricultural fertilizer (medium B-1).
Table II. Non-linear values of the parameters of the mathematical model, used to carry out the statistical analisis (P<0.05) of the density data obtained for the
species C. gracilis (a) and Thalassiosira sp (b).
ADDITIONS MATH. MOD. E.C
(%) n°=ββ0.t.e.ββ1.t
ββ0 ββ1
Pure water 144,062 - 0,003 a*
f2 1428,152 - 0,098 b
10 372,519 - 0,008 c 20 599,670 - 0,008 d 30 760,167 - 0,009 e 40 883,052 - 0,009 f
Table II (cont.)
ADDITIONS MATH. MOD. E.C
(%) n°=ββ0.t.e.ββ1.t
ββ0 ββ1
Pure water 28,273 - 0,126 a*
f2 144,951 - 0,006 b
10 59,972 - 0,008 c 20 75,520 - 0,007 d 30 126,514 - 0,009 e 40 175,792 - 0,009 f
For Salas et al., (1992), when studying the effect
of the microalgae Pavlova lutheri (Droop)
Hibberd -cultivated with agricultural fertilizers-on the growth and survival of Mytilus edulis (L)
larvae, the cellular concentrations of approximatly 1.5 x 10⁶ cells/ml obtained were satisfactory. Besides giving an algal density comparable to many other mediums already tested, the author reenforces the necessity of further studies to search for more efficient mediums for algal production in relation to the maintenance of survival rates, larval and mollusk seed growth, and of other economically important organisms.
Figure 1. Daily population density (cells/ml) in the various additions used for the species Chaetoceros gracilis
(a) and Thalassiosira sp (b) during the experimental period * Different letters between treatments, different parameters of the mathematical model.
0 1 0 0 0 2 0 0 0 3 0 0 0 4 0 0 0 5 0 0 0 6 0 0 0 7 0 0 0 8 0 0 0
1 3 5 7 9 1 1 1 3 1 5 1 7 1 9 2 1
T i m e ( d a y s )
C g 0 C g 1
C g 1 0 C g 2 0 C g 3 0 C g 4 0
0 1 0 0 2 0 0 3 0 0 4 0 0 5 0 0 6 0 0 7 0 0 8 0 0 9 0 0 1 0 0 0
1 3 5 7 9 1 1 1 3 1 5 1 7 1 9 2 1
T i m e ( d a y s )
T h 0 T h 1 T h 1 0
Microalgal biomass (values of chlorophyll-a) Chaetoceros gracilis
The control bioassay enriched with the nutritive medium f2 presented minimum and maximum values of 0.061µg/ml on the first day, and 2,363µg/ml on the ninth day. The minimum concentration registered for the bioassay submited to the treatment of 30% wastewater was of 0.052µg/ml on the first day, and maximum of 0.76µg/ml on the fifth day.
In the bioassay treated with 40% wastewater, the minimum and maximum values were 0.052µg/ml on the first day and 0.768µg/ml on the fifth day, respectively.
For this species, the additions that demonstrated results considered statistically the same, were those of 30% and 40%, the rest of the additions being considered statistically different between themselves (Table IIIa).
Thalassiosira sp
The enriched control bioassay, presented minimum and maximum values of 0.051 and 2,152µg/m, on the first and ninth days, respectively The minimum and maximum concentrations observed in the experimental unit treated with 30% wastewater were 0.066 and 1,156µg/ml, on the first and thirteenth days, respectively In the experimental unit treated with 40% wastewater, the minimum and maximum values were 0.078 on the first day and 0.883µg/ml on the thirteenth day, respectively.
For Thalassiosira sp, the comparisons of the
biomass data demonstrated significant differences between all the tested additions ( Table IIIb). All the values obtained for the species Chaetoceros gracilis and Thalassiosira
sp during the experiments are in figures 2a and 2b.
In relation to biomass, which is another important factor for the choosing of a particular culture medium, the more representative results were the ones treated with 40% and 30% wastewater. These treatments, present maximum chlorophyll-a values of 0.768µg/ml for the species Chaetoceros gracilis (fifth day), and 1,156µg/ml for Thalassiosira sp, on the thirteenth day of the experiment.
The treatment with 40% wastewater, for
Chaetoceros gracilis, rendered the highest
values of population density and microalgal biomass, having the best results in terms of microalgal production. For Thalassiosira sp, the
highest population density was also registered in the 40% addition, while the biomass presented a maximum value in the treatment of 30% wastewater.
The maximum chlorophyll-a values observed by
Koening et al., (1988), when cultivating
Tetraselmis chuii submited to a treatment with
0.66% mineralized syrup, diluted at 50 and 25% (158 and 148.05mg/m3), were inferior to the values registered for the additions of 40%, (0.768 and 0,883µg/ml) for Chaetoceros gracilis
and Thalassiosira sp., respectively Also, by
using extract of chicken manure for the culture of the same species, a maximum microalgal biomass of 332.50mg/m3 was observed, which is a lower value to the obtained by the wastewater. The maximum concentration of chlorophyll-a registered by these authors in the
culture of Dunaliella tertiolecta (1,492.60
mg/m3) with chicken manure, was higher to the obtained by the wastewater in the culture of the two species used in the study. For Tetraselmis
chuii as well as for Dunaliella viridis, the
highest results were those with the addition of 10ml of chicken manure extract.
The values referred above for Tetraselmis chuii
were lower to the ones obtained by Koening et al., (1990), which by using an addition of 30ml
of chicken manure extract in the culture of the same species, obtained a biomass of 1,003.88 mg/m3 on the eighth day of the experiment. This value was still surpassed by the experimental unit Th30. The biomass registered by the same authors for Tetraselmis tetrathele, was of
2,014.16mg/m3 on the ninth day, which was a higher value than any of the additions tested with wastewater.
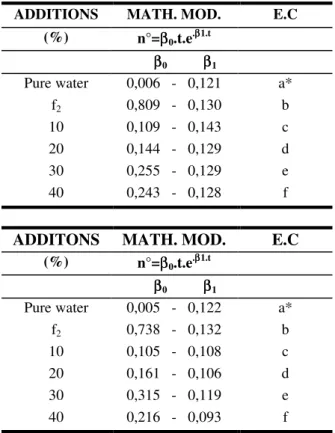
Table III. Non-linear values of the parameters of the mathematical model, used to carry out the statistical analisis (P<0.05) of the biomass data obtained for the
species C. gracilis (a) and Thalassiosira sp (b).
ADDITIONS MATH. MOD. E.C (%) n°=ββ0.t.e.ββ1.t
ββ0 ββ1
Pure water 0,006 - 0,121 a*
f2 0,809 - 0,130 b
10 0,109 - 0,143 c
20 0,144 - 0,129 d
30 0,255 - 0,129 e
40 0,243 - 0,128 f
ADDITONS MATH. MOD. E.C
(%) n°=ββ0.t.e .ββ1.t
ββ0 ββ1
Pure water 0,005 - 0,122 a*
f2 0,738 - 0,132 b
10 0,105 - 0,108 c
20 0,161 - 0,106 d
30 0,315 - 0,119 e
40 0,216 - 0,093 f
* Different letters between treatments, different
parameters of the mathematical model
0 0,5 1 1,5 2 2,5
1 5 9 13 17 21
Time (days)
µµ
g/ml
Cg0 Cg1
Cg10 Cg20 Cg30 Cg40
0 0,5 1 1,5 2 2,5
1 5 9 13 17 21
Time (days)
µµ
g/ml
Th0 Th1 Th10 Th20 Th30 Th40
Figure 2. Microalgal biomass (values of chlorophyll-a) of the various experimental unit tested for the
species Chaetoceros gracilis (a) and Thalassiosira
sp.(b) during the experimental period.
ACKNOWLEGMENTS
Thanks are given to the National Counsel of Scientific and Technological Development (CNPq), which through the concession of a Masters scholarship made this project possible, and to the Oceanography Department of the Federal University of Pernambuco for the disponibility of their laboratories along the course of the experiments, and contribution to the necessary analisis for the completion of the study.
REFERENCES
Brasil-Lima,G. M. S. S., Aidar, E. Avaliação
do efeito do esgoto doméstico sobre o crescimento de Phaeodactylum tricornutum, em bioensaios algais. In: REUNIÃO BRASILEIRA DE FICOLOGIA, 7.,1996, Caxambu,1996, p. 76 Creitz, G.I., Richards, F. A. The estimation and
caracterization of the plankton populations by pigments analyses. III. A note of the use of millipore membrane filters in the estimation of
plankton pigments. Journal of Marine Research,
New Haven, v. 14, n. 3, p. 211-216,1955. Dustan, W. M., Menzel, D.W. Continuous cultures of
natural populations of phytoplankton in dilute
sewage effluent. Limnology and Oceanography,
Lawrence, v. 16, n. 4, p. 623-632, 1971.
Dustan, W. M., Tenore, K. R. Intensive outdoor culture of marine phytoplankton enriched with
treated sewage effluent. Aquaculture,
Amsterdam, v. 1, n. 2, p. 181-192, 1972.
Goldman, J. C., Stanley, H. I. Relative growth of different species of marine algae in
wastewater-sea water mixtures. Marine Biology, Heidelberg,
v. 28, n. 1, p. 17-25, 1974.
Grasshoff, K, Emrhardt, M., Kremling, K. Methods
of seawater analysis. 2. ed. New York: Verlag
Chemie, 1983. 419p.
Guillard, R. R. L. Division rates. In: Stein, J. R.
Handbook of Phycological Methods - Culture methods and measurements. Cambridge University Press, 1973. p. 289-313.
Guillard, R. R. L. Culture of phytoplankton for feeding marine invertebrates. In: SMITH, W. L.,
CHARLEY, M. M. Culture of marine
invertetebrates animals. New York: Plenum,
1975, p.29-60.
Koening, M. L. et al. O vinhoto no cultivo de
microalgas. Gayana Bot., Concepción, v. 45,
n.1/4, p. 253-263, 1988.
Koening, M. L. et al. Cultivo em laboratório de
Tetraselmis chuii e Tetraselmis tetrathele
(Chlorophyceae) com fertilizante orgânico.
Arquivos de Biologia e Tecnologia, Curitiba, v.
Lacerda, S. R. Cultivo em laboratório de Tetraselmis chuii e Tetraselmis tetrathele (Chlorophyceae)
com fertilizante orgânico; Recife, 1988. Monografia apresentada ao Curso de Ciências Biológicas da Universidade Federal Rural de Pernambuco.
Paniagua-Michel, J., Farfan, B. C., Buckle-Ramirez, F. Culture of marine microalgae with biodigested
resources. Aquaculture, Amsterdam, v. 64 n. 3, p.
249-256, 1987.
Parsons, T. R., Strickland, J. D. H. Discussion of spectrophotometric determination of marine plankton pigments with revised equations of as
certaining chlorophyll-a and carotenoids. Journal
of Marine Research, New Haven, v. 21, n. 3, p. 155-163,1963.
Salas, L. S. Mca., Aranda, F. J. O., Pámanes, L. E. G.
Efecto de la microalga Pavlova lutheri (Droop)
Hibberd cultivada con fertilizantes agricolas en el crescimiento y supervivencia de larvas y
postlarvas del mejillon Mytilus edulis (L.).
Ciencias Marinas, México, v. 18, n. 4, p. 57-74, 1992.
Santos, E. P. Ajustamento de curvas: Programa Computacional “CAJUS”, 1995.
Strickland, J. D. H., Parsons, T. R. A manual of sea
water analysis. Bulletin Fisheries Reasearch
Board Of Canada, Ottawa, v. 125, p. 1-205, 1972.
Taslakian, M. J., Hardy, J. T. Seawage nutrient enrichment and phytoplankton ecology along the
central coast of Lebanon. Marine Biology,
Heidelberg, v. 38, n. 4, p. 315-325, 1976.
UNESCO. Determination of photosynthethic pigments in sea waters. Raport of SCOR/UNESCO, Working group 17 with meet from 4 to 6 june 1964. Paris, 1966. (Monographys on Oceanography Methodology, n. 1). 69p.
Yamashita, C., Magalhães, P. M. S. Meios de cultura
para a alga Chaetoceros gracilis. Natal (RN).
EMPARN, 1984. 18 p. (Boletim de Pesquisa, 7).
Yoneshigue-Braga, Y. et al. A preliminary study
using untreated municipal sewage as a basic algal
culture media. Publ. Inst. Pesq. Mar., n. 105, p.
1-6, 1977.