CO
2
Mediated Interaction in Yeast Stimulates Budding
and Growth on Minimal Media
Ilya V. Volodyaev*, Elena N. Krasilnikova, Ruslan N. Ivanovsky Department of Microbiology, Faculty of Biology, Moscow State University, Moscow, Russia
Abstract
Here we show that carbon dioxide (CO2) stimulates budding and shortens the lag-period of Saccharomyces cerevisiae cultures, grown on specific weak media. CO2can be both exogenous and secreted by another growing yeast culture. We also show that this effect can be observed only in the lag-period, and demonstrate minimal doses and duration of culture exposition to CO2. Opposite to the effects of CO2 sensitivity, previously shown for pathogens, where increased concentration of CO2suppressed mitosis and stimulated cell differentiation and invasion, here it stimulates budding and culture growth.
Citation:Volodyaev IV, Krasilnikova EN, Ivanovsky RN (2013) CO2Mediated Interaction in Yeast Stimulates Budding and Growth on Minimal Media. PLoS ONE 8(4): e62808. doi:10.1371/journal.pone.0062808
Editor:Alix Therese Coste, Institute of Microbiology, Switzerland
ReceivedDecember 28, 2012;AcceptedMarch 26, 2013;PublishedApril 26, 2013
Copyright:ß2013 Volodyaev et al. This is an open-access article distributed under the terms of the Creative Commons Attribution License, which permits unrestricted use, distribution, and reproduction in any medium, provided the original author and source are credited.
Funding:The authors have no support or funding to report.
Competing Interests:The authors have declared that no competing interests exist.
* E-mail: [email protected]
Introduction
Cell-cell interactions in microbial cultures have been under particular interest and investigation for more than 80 years. The whole area includes works on the so called ‘‘mitogenetic effect’’ [1,2], ‘‘quorum sensing’’ [3,4], and rather recently discovered NH3signaling in yeast [5] and CO2sensitivity both in prokaryotes [6,7] and fungi [8,9].
The ‘‘mitogenetic effect’’ consists in a distant stimulation of mitosis in prokaryotic and eukaryotic cells by optical contact with other well growing cultures. The effect was shown for bacterial cultures [10], yeast [11], etc., and ultraweak ultraviolet lumines-cence was stated to be the mediator of these cell-cell interactions [12,13]. Altogether several hundred articles and monographies appeared in this area, mostly in 1920–1950s, both verifying [14– 16] and refuting [17,18] original results. Still, the problem of mitogenetic effect remains unsolved till nowadays.
The effects of chemical cell-cell interactions in microbial cultures, most of them denoted by the notion ‘‘quorum sensing’’, are proved much more unequivocally. The ‘‘quorum sensing’’ phenomenon (the name given in [19]) consists in cooperative ‘‘behavior’’ of microbial cultures depending on the population density and composition, and including gene expression, cell differentiation, antibiotic secretion, and various virulence-dealing processes, such as hyphae, biofilm and spore formation, and substrate invasion. The mechanism lies in simultaneous secretion and reception of certain species-specific or more or less universal chemicals (small peptides, alcohols, ethers etc.), which accumulate in the medium and switch on certain intracellular signaling pathways when reaching a certain concentrational threshold (for reviews see [3,4,20,21]). Besides these specific signaling factors, cell interaction can be mediated by such a ‘‘simple’’ molecule as NH3 [5], which is ‘‘used’’ to synchronize cell differentiation and general morphology of neighboring colonies [22] and prevent them from spreading too close to each other [5].
Can CO2also be a factor of cell-cell interaction? CO2sensitivity of mammalian cells has been known for nearly 50 years [23] and investigated in detail [24]. It has also been shown for cyanobac-teria [7], and pathogenic fungi [25], in which it plays the role of ‘‘host tissue sensor’’. But there are practically no works dealing with CO2-mediated cell-cell interaction [9], especially in non-pathogens (discussion of some doubtful data [26] see below). In this work a new case of yeast cell-cell interaction was shown, and the mediator of this was proved to be CO2. Thus the observed effect turned out a new case of CO2sensitivity in microorganisms, and a new type of CO2-mediated processes, where cell cycle is stimulated rather than suppressed ‘‘in favor’’ of cell differentiation, as it had been well shown for pathogens before.
Materials and Methods
Strains
Saccharomyces cereviseae. wild-type diploid wine strain VKM J-542 (from the collection of Microb. Dep., Fac. of Biology, Moscow State University).
Culture Preparation and Media
Suspension cultures were grown on a rotary shaker (120 r.p.m., 30uC) in standard YPD medium (glucose 2%+yeast extract 2%+bactopeptone 1%) till the beginning of stationary phase (18–24 hours), and plated on Petri dishes (1–26108cells per 9 cm Petri dish) with agar medium of various composition:
1. rich growth medium – YPD: glucose 2%+yeast extract 2%+bactopeptone 1%+agar 3%, pH5,5;
3. m i n i m a l m e d i u m w i t h a c e t a t e : C H3C O O N a 0 , 1 %+( N H4)2S O4 0 , 1 %+K H2P O4 0 , 1 %+M g S O4 0,05%+CaCl20,01%+NaCl 0,01%+agar 3%, pH5,5. The plated cultures were cultivated at 30uC.
Measurement
Culture density and budding were measured during experi-ments.
To evaluate density of agar culture, it was carefully washed off the plate with three portions of water, and optical density of the resulting suspension was measured with nephelometer at 650 nm (OD650).
Culture budding was characterized with budding index (BI) – total number of buds divided by the total number of cells counted, in %. To calculate BI of the culture, agar sections of 4 cm2in area were cut off the plates, fixed with formalin, and microphoto-graphed with a phase contrast microscope with 406objective and digital 5 MP camera. The photographs were digitally processed with specially created original software [27], automatically recognizing cells and buds in digital pictures (fig. 1). No less than 1500 cells were counted for each BI calculation.
Both culture density and budding were measured periodically, to obtain growth and budding dynamics of the culture (fig. 2).
Experiment
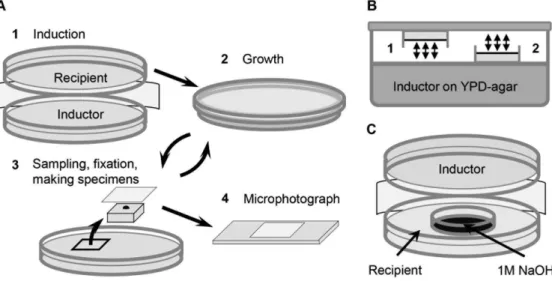
The ‘‘induction’’ experiment. Two open plates with yeast cultures were fixed together, their cell layers directed towards each other, and left for 10–150 min (fig. 3A). After that, one of the
plates (called ‘‘inductor’’) was removed, and the other one (called ‘‘recipient’’) – closed, and left at 30uC for further growth. The recipient density and budding were periodically gauged, every 15– 30 min for 3–5 hours, and compared to budding and culture density in separated single control plates with identical medium and culture.
The inducing factor testing. To test whether the inducing factor was a volatile chemical, two identical plates with the
Figure 1. Digital phase-contrast picture of yeast cells.Cells and buds are automatically recognized with a specially constructed software [27]. Recognized cells are marked with green squares, recognized buds – with red squares. Cells smaller than the threshold set in the program, are skipped. doi:10.1371/journal.pone.0062808.g001
Figure 2. Growth and budding dynamics of S. cereviseaeon YPD-agar medium.1– lag period of budding 2– emergence of first buds. Budding index (BI) increase 3– constant BI 4– lag period of growth 5– exponential phase 6– linear growth 7– beginning of stationary phase.
Figure 3. Scheme of experiments.A. The ‘‘induction’’ experiment. 1– Open plates with the ‘‘recipient’’ and the ‘‘inductor’’ yeast cultures were fixed together, their cell layers directed towards each other (1 cm distance between the cell layers), made airtight with parafilm, and left at 30uC for 10– 150 min. 2– After that, the inductor was removed, and the recipient was left in a closed dish for further growth. 3– Agar sections of 4 cm2in area were
periodically cut off the recipient plate, every 15–30 min, during the first 3–4 hours after the end of induction. Fixing fluid (glycerol : formalin : water, in proportion 50: 25 : 25) was spread onto the surface of these samples, imprinted on the cover glass, put on the slide, and… 4– microphotographed with a phase contrast microscope with 406objective and digital 5 MP camera. B. Testing, whether the inducing factor is a volatile chemical. Hermetically closed airtight container is half filled with YPD-agar and plated with the ‘‘inductor’’ yeast culture. Two open Petri dishes with identical recipient cultures are fixed inside the container. Both recipients are equally available to volatile chemicals (possibly secreted by the inductor). Plate#1 has direct optical contact with the inductor, plate#2 is turned off the inductor and has no direct optical contact with it. Arrows show possible gas exchange. C. Induction in the presence of alkaline trap for (possibly) CO2(1M NaOH) in a small Petri dish, fixed inside the plate with the recipient.
doi:10.1371/journal.pone.0062808.g003
Figure 4. Budding dynamics ofS.cerevisiaeafter induction and in control, on various agar media.A. rich growth medium – YPD (glucose 2%+yeast extract 2%+bactopeptone 1%+agar 3%). B. minimal medium with lowered glucose content (glucose 0,1%+(NH4)2SO40,1%+KH2PO40,1%+MgSO4
0,05%+CaCl2 0,01%+NaCl 0,01%, pH5,5). C. minimal medium with acetate (CH3COONa 0,1%+(NH4)2SO4 0,1%+KH2PO4 0,1%+MgSO4 0,05%+CaCl2
0,01%+NaCl 0,01%, pH5,5). D. minimal medium with acetate, without nitrogen (CH3COONa 0,1%+KH2PO40,1%+MgSO40,05%+CaCl20,01%+NaCl 0,01%,
pH5,5). The experiment scheme is given in fig. 3A. Duration of induction was 60 min, inductor –S.cerevisiaeculture on YPD-agar in early stationary phase (20 hour old), recipient –S.cerevisiaeculture 15 min after inoculation. No effect is observed on YPD (medium A). On minimal media (B–D) induction leads to BI increase, highly reliable in certain time points: B –120–165 min,P,1023; C –210 min,P
,1023, 240–270 min,P
,1025; D –180–270 min,P ,1026.
doi:10.1371/journal.pone.0062808.g004
recipient culture were fixed inside a big airtight container (2062064 cm) half filled with agar medium, and plated with inductor (fig. 3B). Both recipients were equally available to volatile chemical factors from the inductor (arrows in fig. 3B show possible gas exchange), and while one of the recipients had normal optical contact with the inductor, the other one was turned away from it. In fig. 3C a modification of the standard induction experiment is shown. A small Petri dish with 1M NaOH was fixed inside the recipient plate to partially absorb CO2 from the atmosphere inside.
CO2inducing experiments. To check the inducing capacity
of CO2, recipient cultures were put into hermetically closed containers (2062064 cm), and atmosphere with various concen-trations of CO2 (0,1–4%) was created inside by injecting the needed volume of 99,99% CO2 into the container, through an airtight rubber stopper.
Reproducibility
Altogether more than 500 budding curves were registered at various conditions: media content, age of the recipient and inductor cultures, and duration of induction. Each point on the budding curve was obtained by automatic counting of 1500–2000 cells in microphotographs. Each particular experiment was
repeated no less than 7 times; some experiments were repeated up to 20 times.
The main experimental data obtained in our work, were budding curves of yeast cultures, which (although looking like standard S-shaped functions), could not be correctly approximated by functions of a single family. Thus we preferred to compare values of budding index in individual time points on the curves. According to our experimental scheme, each experiment had its own control, and thus criteria for dependent samples could be used. As not all the data were always distributed normally, we preferred to use nonparametric Wilcoxon T-test for dependent samples to calculate the data confidence. Intervals given in tables are effective 99% confident intervals calculated from normal approximation.
Results
1. Distant Stimulation of Budding and Growth
The ‘‘induction’’ experiment, as shown in fig. 3A, was performed under various conditions – age of the inductor and the recipient cultures, their medium content, and the induction length. Under particular conditions (see below) the experiment led to stimulation of budding and growth in the recipient culture (compared to adequate control).
The main conditions for the induction effect are listed below. The ‘‘recipient’’ cultures can be stimulated only on weak media. Plated onto rich growth media (YPD or 2–18u beer worth), the recipient cultures didn’t react to induction, i.e. both
Figure 5. Growth dynamics ofS.cerevisiaeafter induction and in control on minimal agar media with acetate (A) and glucose (B) as the main substrate. The medium content: A. CH3COONa
0,1%+(NH4)2SO40,1%+KH2PO40,1%+MgSO40,05%+CaCl20,01%+NaCl
0,01%, pH5,5. B. Glucose 0,1%+(NH4)2SO40,1%+KH2PO40,1%+MgSO4
0,05%+CaCl2 0,01%+NaCl 0,01%, pH5,5. The experiment scheme is
given in fig. 3A. Duration of induction was 60 min, inductor – S.cerevisiae culture on YPD-agar in early stationary phase (20 hour old), recipient –S.cerevisiaeculture 15 min after inoculation. Culture density is higher at induction than in control: A –250–420 min,P,1024;
B –250–420 min,P,1022,
doi:10.1371/journal.pone.0062808.g005
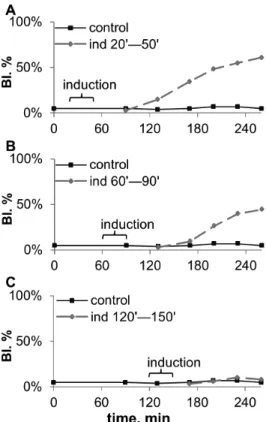
Figure 6. Budding dynamics of S.cerevisiae after 30 min induction, started at different age of the recipient.A. 20 min after inoculation, B. 60 min after inoculation, C. 120 min after inoculation. The experiment scheme is given in fig. 3A. Duration of induction was 30 min, inductor –S.cerevisiaeculture on YPD-agar in early stationary phase (20 hour old). Medium content: CH3COONa
0,1%+KH2PO40,1%+MgSO40,05%+CaCl20,01%+NaCl 0,01%, pH5,5.
budding and growth dynamics of the ‘‘induced’’ culture coincided with control (fig. 4A, growth not shown).
Plated onto minimal medium with 0,1% glucose, yeast showed a slower (suppressed) dynamics of budding (compare control lines in fig. 4A and B). On this medium induction led to budding stimulation, the culture achieving maximal BI ,1 hour earlier
than in control (fig. 4B). Plated onto minimal acetate-containing medium, control culture showed practically no budding (BI,10%) up to 270 min after inoculation (fig. 4C), and the induced culture achieved maximal BI of,50%, which was 5–10 times higher than
in control at the same time (see 210–270 min period in fig. 4C, P,1025
). Budding-stimulation on minimal media led also to growth stimulation (fig. 5). Still, the budding stimulation effect could also be observed even on extremely weak media lacking nitrogen, where subsequent growth was impossible (fig. 4D, growth not shown).
When on similar media, with malate, succinate or fumarate as the only substrate (instead of glucose or acetate), or with no substrate at all, the recipient culture showed no budding either in control or after induction (data not shown).
The recipient cultures can be stimulated only during the lag period of budding, with the induction lasting from 15 to 150 min. The recipient cultures could be stimulated only during the first,2 hours after inoculation, and the earlier the recipient
was subjected to induction, the higher was the observed effect (fig. 6). Notice that the effect of induction exhibited,2 hours after
the beginning of induction, and 1–1,5 hour after its end.
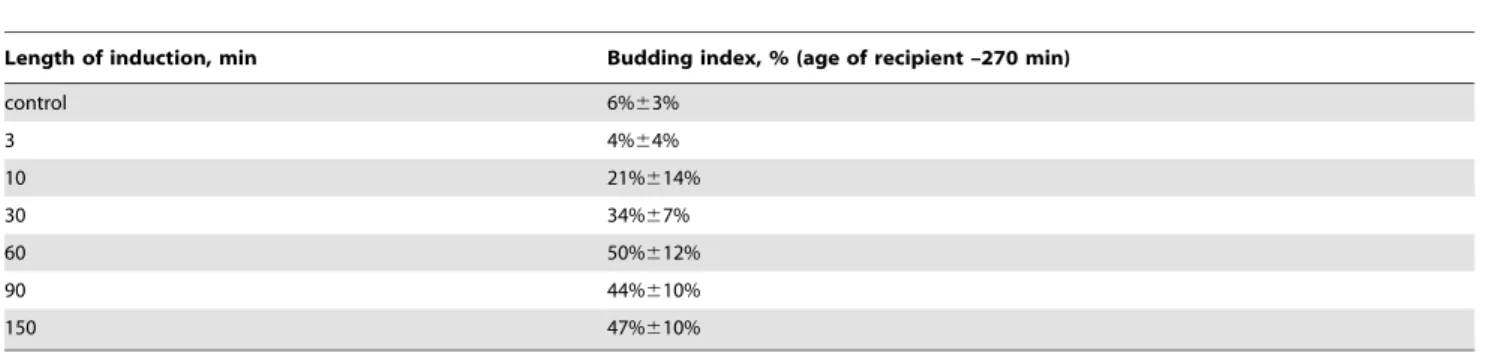
The minimal length of induction that produced any budding-stimulation effect was found to be 10–15 min. The effect was increasing to maximum with the induction length rising up to 60– 90 min, and remained constant for longer inductions (table 1).
Yeast cultures used as inductors must be alive and growing on rich media. Cultures grown on minimal media didn’t produce reliable budding stimulation effect (on any recipient cultures) with induction lasting either 30 or 90 min (data not shown). Yeast of the same strain grown on rich growth media (YPD or beer worth) produced budding stimulation effect (on proper recipient cultures) from exponential phase to the beginning of stationary phase (4–30 hours old – see sect. 4.1.1 and 4.1.2, table 2). Under these conditions, both agar and suspension cultures were good inductors. Lag-period cultures had a much lower induction capacity comparing to older inductors (table 2). Dead (boiled) cultures didn’t stimulate budding at all (data not shown).
The Induction Effect is Caused by a Volatile Chemical Factor that can be Absorbed by Alkaline Solution
To test whether the inducing factor was a volatile chemical, we separated the inductor and the recipient with metal, glass and quartz plates, and the budding-stimulating effect disappeared in any case (data not shown). The effect was also missing if the atmosphere between the inductor and the recipient was being constantly renewed during the experiment (data not shown). Two identical recipient plates fixed inside a big container with inductor, equally accessible to volatile chemicals, but oppositely located Table 1.Budding index of agar cultures ofS.cerevisiae, 270 min after inoculation – in control and after induction of various length (see fig. 4D for the whole budding curve on this medium).
Length of induction, min Budding index, % (age of recipient –270 min)
control 6%63%
3 4%64%
10 21%614%
30 34%67%
60 50%612%
90 44%610%
150 47%610%
The experiment scheme is given in fig. 3A. Inductor –S.cerevisiaeculture on YPD-agar in early stationary phase (20 hour old), recipient –S.cerevisiaeculture 15 min after inoculation.
Medium content: CH3COONa 0,1%+KH2PO4 0,1%+MgSO4 0,05%+CaCl2 0,01%+NaCl 0,01%+agar 3%, pH5,5.
doi:10.1371/journal.pone.0062808.t001
Table 2.Budding index of agar cultures ofS.cerevisiae, 210 min after inoculation – in control and after 120 min induction with various inductors (see fig. 4D for the whole budding curve on this medium).
Inductor Budding index, % (age of recipient –210 min)
Control 5%64%
Agar culture Lag-period (15 min) 18%613%
Exponential phase (7 hour) 50%612%
Early stationary phase (20 hour) 46%69%
Suspension culture Exponential phase (7 hour) 45%66%
Early stationary phase (20 hour) 47%611%
The experiment scheme is given in fig. 3A. Inductor –S.cerevisiaecultures of various age, in YPD (suspension) and on YPD-agar. Recipient –S.cerevisiaeculture 15 min after inoculation.
Medium content: CH3COONa 0,1%+KH2PO4 0,1%+MgSO4 0,05%+CaCl2 0,01%+NaCl 0,01%+agar 3%, pH5,5.
doi:10.1371/journal.pone.0062808.t002
towards the inductor (fig. 3B), showed standard budding stimulation, identical for both recipient plates (fig. 7). Thus the induction effect was definitely caused by a volatile chemical factor secreted by the inductor.
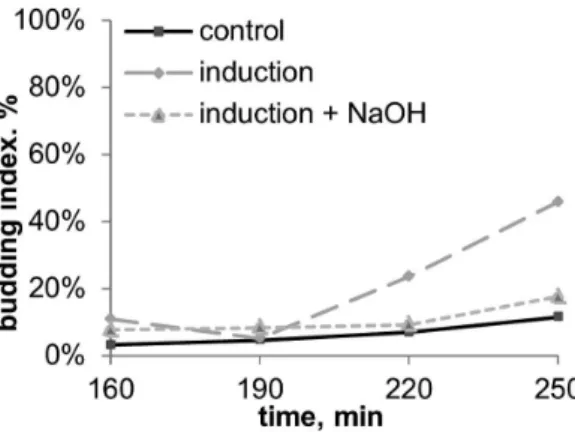
We then tested if the inducing chemical was alkaline or acidic, by fixing a small Petri dish with 1M NaOH solution inside the recipient plate, as a trap for acidic chemicals from the air (fig. 3C). Addition of this trap utterly abolished the stimulation effect at 30 min induction (fig. 8) and decreased the effect more than twice at 120 min induction (data not shown). A separate set of experiments showed that addition of such a trap (Petri dish with 1 M NaOH) didn’t influence budding or growth curves of non-stimulated (control) cultures (data not shown).
Thus the budding stimulation effect was caused by a volatile chemical factor, secreted by yeast cultures from early exponential phase to early stationary phase, and absorbed by alkaline solutions.
Exogenous Carbon dioxide Mimics the Induction Effect
The only known chemical secreted by yeast and corresponding to all the data obtained, is CO2. NH3 and the known quorum sensing factors – tryptophol and phenilethanol – are not absorbed by alkaline solutions. Besides, the quorum sensing factors are not volatile, and NH3is not secreted by yeast colonies till rather late stationary phase (4–10 days old [5]).
Measured with infrared CO2 sensor, the rate of CO2 production by our inductor cultures was found ,0,1
micro-mole/sec from 1 cm2of agar medium (V. Ptushenko, unpublished data). This rate of CO2production leads to accumulation of,1%
CO2in 10–20 min, in the atmosphere between the recipient and the inductor. To check the inducing capacity of CO2, the recipient cultures were put into hermetically closed containers, and atmosphere with various concentrations of CO2 (0,1–4%) was created inside. Exogenous CO2 stimulated budding in the recipient at least in the concentrations from 0,1% to 4% (table 3), and at induction length more than 10 min (table 4). These conditions generally corresponded to the amount of CO2 secreted by the inductor culture.
Thus the effect of budding stimulation, observed inS.cerevisiae cultures on specific poor media, when in contact with another actively growing yeast culture, was caused by CO2, secreted by the latter, and exerting the stimulating influence in concentrations 0,1–4% in the atmosphere, and at the induction length$10 min.
Some Evidences for Signaling Action of CO2
There can be three general mechanisms of CO2action on yeast:
1. medium acidification,
2. heterotrophic fixation of CO2[9,28,29], 3. signaling action (through adenylyl cyclase [7,8]).
To test the first opportunity, we performed the main budding stimulation experiments on media with different pH. Budding stimulation, both by inductor yeast cultures, and exogenous CO2, was equally observed (on appropriate minimal media – see section 4.1.1) at pH from 4,5 to 6 (data not shown). The medium pH in the recipient culture after the end of induction was equal to pH in the control culture (and not changed comparing to initial pH of the medium). Thus, the stimulation effect was not connected to any CO2-induced change of the medium pH.
Metabolic CO2fixation is for the greatest part taking place in reactions of phoshptryose carboxylation, generating oxaloacetate (OA) and ‘‘supporting’’ the Krebs cycle [30]. This way is important on media with glucose, and practically useless on media with acetate, as all OA is generated through glyoxylate bypass
Figure 7. Budding dynamics of S.cerevisiae after 30 min induction in a big airtight container with inductor (the experiment scheme is given in fig. 3B). induction chem+light –
plate No 1 in fig. 3B, induction chem – plate No 2 in fig. 3b (no optical contact with the inductor). Inductor –S.cerevisiaeculture on YPD-agar in early stationary phase (20 hour old). Medium content: CH3COONa
0,1%+KH2PO40,1%+MgSO40,05%+CaCl20,01%+NaCl 0,01%, pH5,5.
doi:10.1371/journal.pone.0062808.g007
Figure 8. Budding dynamics of S.cerevisiae after 30 min induction with and without alkaline trap for acidic volatile chemicals (the experiment scheme is given in fig. 3C).Inductor – S.cerevisiaeculture on YPD-agar in early stationary phase (20 hour old). Medium content: CH3COONa 0,1%+KH2PO4 0,1%+MgSO4 0,05%+CaCl2
0,01%+NaCl 0,01%, pH5,5.
doi:10.1371/journal.pone.0062808.g008
Table 3.Budding index of agar cultures ofS.cerevisiae, 270 min after inoculation – in control and after induction with CO2of various concentration (see fig. 4D for the whole budding curve on this medium).
CO2concentration Budding index, %
control 5%64%
0,13% 17%67%
0,25% 36%69%
0,5% 45%616%
1% 37%612%
2% 30%610%
4% 25%67%
Duration of induction –150 min.
Medium content: CH3COONa 0,1%+KH2PO4 0,1%+MgSO4 0,05%+CaCl2 0,01%+NaCl 0,01%+agar 3%, pH5,5.
[30]. To test whether the budding stimulation effect was connected to metabolic CO2fixation, we performed our main experiments on glucose and acetate containing minimal media (see fig. 1B and C), with addition of 0,1% oxaloacetate. This led to increase of both control and CO2-stimulated budding dynamics on both media (comparing to identical media without OA – see table 5), but didn’t decrease the culture sensitivity to CO2. Absolute increase of budding, caused by CO2, was equal or even slightly higher on media with OA than on identical media without OA (table 5, columnDBI). Thus, OA was used as additional substrate, important for the culture budding (table 5) and growth (data not shown), but didn’t ‘‘substitute’’ exogenous CO2. Besides, CO2 action on yeast was equally high on glucose and acetate containing media, with or without additional OA.
Thus, the CO2-induced budding stimulation effect in our experiments was not connected to non-specific stimulation of metabolism through CO2fixation, and remained as high (or even higher) on media containing excessive amount of oxaloacetate, the key product of CO2fixation.
Discussion
In the last decade a number of works appeared, showing CO2 sensitivity for a vast number of microorganisms [9]. Two general mechanisms of CO2action on the cell are known: (1) metabolic – heterotrophic fixation, and (2) regulatory – participation in
signaling pathways. Heterotrophic fixation of CO2, long known forS.cerevisiae[30],Schizosacharomyces pombe[29], and other species, is essential for culture growth on minimal media, mainly by supporting Krebs cycle through phosphotriose to oxaloacetate carboxylation. This way is not active when the culture is grown on rich media, or on minimal acetate-containing media, as all the needed oxaloacetate is produced in Krebs cycle (rich media) or glyoxylate bypass (acetate-containing media).
Regulatory action of CO2goes through class IIIb (soluble or cytoplasmic) adenylyl cyclases by direct binding with their catalytic domain. This way is shown for mammals, cyanobacteria [7], and pathogenic fungi [25], in which it stimulates cell differentiation and virulence [31]. Regulatory pathway of CO2 sensitivity was also supposed forS. pombe[29], and argued forS.cerevisiae[26], but disproved by the same authors in [32], where they showed that the effect of HCO3– stimulated spore formation, observed in their work, was caused by alkalization of the medium [33].
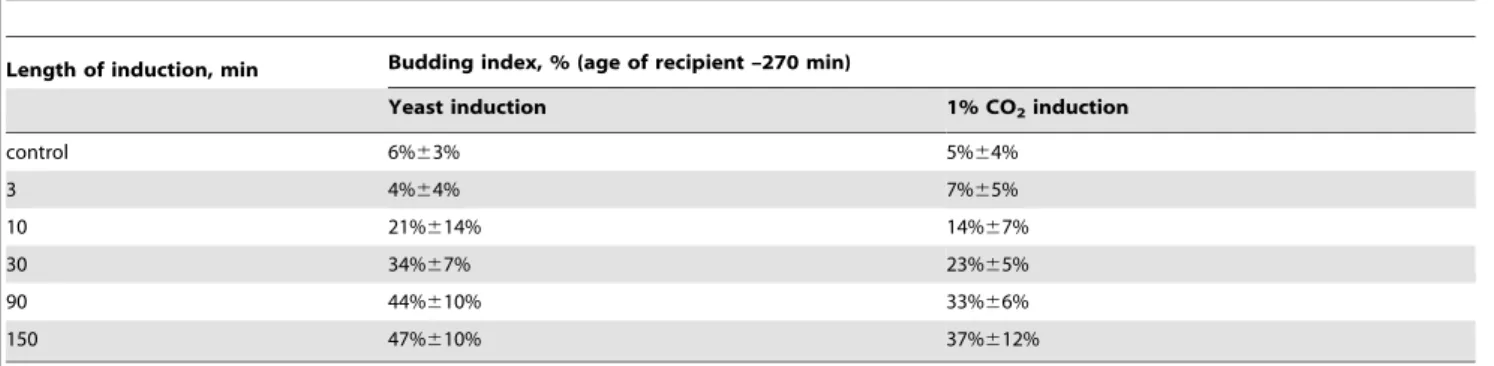
The present work is the first to show significant effects of CO2-mediated interaction of cells onS.cerevisiae. We cannot make any direct statements concerning mechanisms of our effect yet. Still we can conclude that (1) it is not connected to the medium pH shift, and (2) it is not connected to heterotrophic fixation and metabolic use of CO2. This allows us to suppose the budding-stimulation effect going through regulatory, rather than metabolic pathways. Table 4.Budding index of agar cultures ofS.cerevisiae, 270 min after inoculation – in control and after induction withS.cerevisiae culture, or with 1% exogenous CO2(see fig. 4D for the whole budding curve on this medium).
Length of induction, min Budding index, % (age of recipient –270 min)
Yeast induction 1% CO2induction
control 6%63% 5%64%
3 4%64% 7%65%
10 21%614% 14%67%
30 34%67% 23%65%
90 44%610% 33%66%
150 47%610% 37%612%
Inductors:S.cerevisiaeculture in early stationary phase (20 hour); 1% exogenous CO2. Various duration of induction. Medium content: CH3COONa 0,1%+KH2PO4 0,1%+MgSO4 0,05%+CaCl2 0,01%+NaCl 0,01%+agar 3%, pH5,5.
doi:10.1371/journal.pone.0062808.t004
Table 5.Budding index of agar cultures ofS.cerevisiaeon different media with and without oxaloacetate – in control and after induction with 4% CO2.
Medium Age of recipient, min Budding index, % DBI (induction – control), %
Control 4% CO2induction
Medium A 150 15%66% 40%68% 25%,P,1024
Medium A+oxaloacetate 26%610% 58%67% 32%,P,1024
Medium B 240 5%65% 25%67% 20%,P,1025
Medium B+oxaloacetate 15%65% 47%610% 32%,P,1025
Medium B 270 5%64% 30%610% 25%,P,1025
Medium B+oxaloacetate 30%65% 61%610% 31%,P,1025
Medium content:
A – Minimal medium with glucose (glucose 0,1%+(NH4)2SO40,1%+KH2PO40,1%+MgSO40,05%+CaCl20,01%+NaCl 0,01%, pH5,5), B – Minimal medium with acetate, without nitrogen (CH3COONa 0,1%+KH2PO40,1%+MgSO40,05%+CaCl20,01%+NaCl 0,01%, pH5,5). Inductor –4% CO2, length of induction –120 min. Recipient –S.cerevisiaeculture 15 min after inoculation.
doi:10.1371/journal.pone.0062808.t005
Besides, the effect is observed 1,5–2 hour later than the interaction is finished.
The main difference of our results from the effects of CO2 action, known for pathogenic fungi, is that here CO2 increase stimulates cell division, rather than mitosis block and cell differentiation [9,31].
Anyway, the effect of distant CO2-mediated interaction of S. cerevisiaecultures, shown in this work, can be interpreted as cell-cell interaction, regulating cell behavior according to the culture density, i.e. a quorum sensing effect.
Acknowledgments
We thank Lev V. Beloussov and Dmitry Knorre for regular discussions and valuable advice and Vasily Ptushenko for useful advice and CO2
measurement.
Author Contributions
Conceived and designed the experiments: IV RI. Performed the experiments: IV RI. Analyzed the data: IV. Contributed reagents/ materials/analysis tools: IV EK. Wrote the paper: IV.
References
1. Rahn O (1936) Invisible radiations of organisms. Berlin: Gebruder Borntraeger. 2. Gurwitsch AG (1932) Die mitogenetische Strahlung. Berlin: Julius Springer. 3. Bassler BL (2002) Small talk. Cell-to-cell communication in bacteria. Cell 109:
421–424. Available: http://www.ncbi.nlm.nih.gov/pubmed/12086599. Ac-cessed 5 October 2011.
4. Hogan DA (2006) Talking to themselves: autoregulation and quorum sensing in fungi. Eukaryotic cell 5: 613–619. Available: http://www.pubmedcentral.nih. gov/articlerender.fcgi?artid = 1459667&tool = pmcentrez&rendertype = abstract. Accessed 19 July 2011.
5. Palkova´ Z, Janderova´ B, Gabriel J, Zika´nova´ B, Pospı´sek M, et al. (1997) Ammonia mediates communication between yeast colonies. Nature 390: 532– 536. Available: http://dx.doi.org/10.1038/37398. Accessed 17 October 2011. 6. Hammer A, Hodgson DRW, Cann MJ (2006) Regulation of prokaryotic adenylyl cyclases by CO2. The Biochemical journal 396: 215–218. Available: http://www.pubmedcentral.nih.gov/articlerender.fcgi?artid = 1462721&tool = pmcentrez&rendertype = abstract. Accessed 16 October 2011.
7. Chen Y, Cann MJ, Litvin TN, Iourgenko V, Sinclair ML, et al. (2000) Soluble adenylyl cyclase as an evolutionarily conserved bicarbonate sensor. Science (New York, NY) 289: 625–628. Available: http://www.ncbi.nlm.nih.gov/pubmed/ 10915626. Accessed 21 September 2011.
8. Klengel T, Liang W-J, Chaloupka J, Ruoff C, Schro¨ppel K, et al. (2005) Fungal adenylyl cyclase integrates CO2 sensing with cAMP signaling and virulence. Current biology: CB 15: 2021–2026. Available: http://www.ncbi.nlm.nih.gov/ pubmed/16303561. Accessed 24 June 2011.
9. Hall R a, De Sordi L, Maccallum DM, Topal H, Eaton R, et al. (2010) CO(2) acts as a signalling molecule in populations of the fungal pathogen Candida albicans. PLoS pathogens 6: e1001193. Available: http://www.pubmedcentral. nih.gov/articlerender.fcgi?artid = 2987819&tool = pmcentrez&rendertype = abstract. Accessed 21 September 2011.
10. Wolf LK, Ras G (1931) Einige Untersuchungen uber die mitogenetischen Strahlen von Gurwitsch. Centr Bact IOrig 123: 257.
11. Baron M (1930) Analyse der mitogenetischen Induktion und deren Bedeutung in der Biologie der Hefe. Planta 10: 28–83. Available: http://www.springerlink. com/content/ln101x8p08857688/. Accessed 30 September 2011.
12. Audubert R (1939) Emission of ultra-violet rays by chemical reactions. Transactions of the Faraday Society 213: 197–206.
13. Frank G, Rodionow S (1931) Uber den physikalischen Nachweis mitogen-etischer Strahlung und die Intensitat der Muskelstrahlung. Die Naturwis-senschaften 19: 659–659. Available: http://www.springerlink.com/content/ h2g06104267104l4/. Accessed 6 October 2011.
14. Tuthill JB, Rahn O (1933) Zum Nachweis mitogenetischer Strahlung durch Hefesprossung. Archiv f Mikrobiol 4: 565–573.
15. Acs L (1932) U¨ ber die mitogenetische Strshlung der Bakterien. Centr F Bakt I Abt Orig 120: 216.
16. Trushin M V (2004) Light-mediated ‘‘conversation’’ among microorganisms. Microbiological research 159: 1–10. Available: http://www.ncbi.nlm.nih.gov/ pubmed/15160601. Accessed 5 January 2012.
17. Hollaender A, Claus WD (1937) An experimental study of the problem of mitogenetic radiation. Washington: National research council of the National academy of sciences.
18. Quickenden TI, Que Hee SS (1976) The spectral distribution of the luminescence emitted during growth of the yeast Saccharomyces cerevisiae and its relationship to mitogenetic radiation. Photochemistry and photobiology 23: 201–204. Available: http://www.ncbi.nlm.nih.gov/pubmed/772727. Ac-cessed 17 October 2011.
19. Fuqua WC, Winans SC, Greenberg EP (1994) Quorum sensing in bacteria: the LuxR-LuxI family of cell density-responsive transcriptional regulators. Journal of
bacteriology 176: 269–275. Available: http://www.pubmedcentral.nih.gov/ articlerender.fcgi?artid = 205046&tool = pmcentrez&rendertype = abstract. Ac-cessed 4 October 2011.
20. Visick KL, Fuqua C (2005) Decoding microbial chatter: cell-cell communication in bacteria. Journal of bacteriology 187: 5507–5519. Available: http://www.pubmedcentral. nih.gov/articlerender.fcgi?artid = 1196057&tool = pmcentrez&rendertype = abstract. Ac-cessed 17 October 2011.
21. Wuster A, Babu MM (2010) Transcriptional control of the quorum sensing response in yeast. Molecular bioSystems 6: 134–141. Available: http://www. ncbi.nlm.nih.gov/pubmed/20024075. Accessed 17 July 2011.
22. Palkova´ Z, Forstova´ J (2000) Yeast colonies synchronise their growth and development. Journal of cell science 113 (Pt 1: 1923–1928. Available: http:// www.ncbi.nlm.nih.gov/pubmed/10806103. Accessed 17 October 2011. 23. Ueno T (1964) Respiration in hypothermia. II. CO2 sensitivity in respiratory
system. Nihon seirigaku zasshi Journal of the Physiological Society of Japan 26: 156–161. Available: http://www.ncbi.nlm.nih.gov/pubmed/14143049. Ac-cessed 27 November 2012.
24. Sharabi K, Lecuona E, Helenius IT, Beitel GJ, Sznajder JI, et al. (2009) Sensing, physiological effects and molecular response to elevated CO2 levels in eukaryotes. Journal of cellular and molecular medicine 13: 4304–4318. Available: http://www.ncbi.nlm.nih.gov/pubmed/19863692. Accessed 17 Oc-tober 2011.
25. Mitchell AP (2005) Fungal CO2 sensing: a breath of fresh air. Current biology: CB 15: R934–6. Available: http://www.ncbi.nlm.nih.gov/pubmed/16303555. Accessed 21 September 2011.
26. Ohkuni K, Hayashi M, Yamashita I (1998) Bicarbonate-mediated social communication stimulates meiosis and sporulation of Saccharomyces cerevisiae. Yeast (Chichester, England) 14: 623–631. Available: http://www.ncbi.nlm.nih. gov/pubmed/9639309. Accessed 21 September 2011.
27. Nekrasov K, Laptev D, Vetrov D (2010) Automatic detection of cell division intensity in budding yeast. 10th International Conference on Pattern Recognition and Image Analysis: New Information Technologies. St. Peters-burg: Politechnika. 335–338.
28. Creanor J, Mitchison JM (1982) Patterns of protein synthesis during the cell cycle of the fission yeast Schizosaccharomyces pombe. Journal of cell science 58: 263–285. Available: http://www.ncbi.nlm.nih.gov/pubmed/7183688. 29. Novak B, Halbauer J, Laszlo E (1988) The effect of CO2 on the timing of cell
cycle events in fission yeast Schizosaccharomyces pombe. J Cell Sci 89: 433–439. Available: http://jcs.biologists.org/cgi/content/abstract/89/3/433. Accessed 21 September 2011.
30. Oura E, Haarasilta S, Londesborough J (1980) Carbon Dioxide Fixation by Baker’s Yeast in a Variety of Growth Conditions. Microbiology 118: 51–58. Available: http://mic.sgmjournals.org/content/118/1/51.short. Accessed 10 February 2013.
31. Bahn Y-S, Cox GM, Perfect JR, Heitman J (2005) Carbonic anhydrase and CO2 sensing during Cryptococcus neoformans growth, differentiation, and virulence. Current biology: CB 15: 2013–2020. Available: http://www.ncbi. nlm.nih.gov/pubmed/16303560. Accessed 8 August 2011.
32. Hayashi M, Ohkuni K, Yamashita I (1998) Control of division arrest and entry into meiosis by extracellular alkalisation in Saccharomyces cerevisiae. Yeast (Chichester, England) 14: 905–913. Available: http://www.ncbi.nlm.nih.gov/ pubmed/9717236. Accessed 21 September 2011.