N. Sad Chemloul
[email protected]K. Chaib
K. Mostefa
University of Ibn Khaldoun of Tiaret Research Laboratory of Industrial Technologies AlgeriaSimultaneous Measurements of the
Solid Particles Velocity and
Concentration Profiles in Two Phase
Flow by Pulsed Ultrasonic Doppler
Velocimetry
In this experimental study, the pulsed ultrasonic Doppler velocimetry was used to measure simultaneously the local velocity and the local concentration in a flow of solid-liquid suspension in a horizontal pipe. In order to distinguish between the Doppler signals coming from the continuous phase, water and those of the glass bead particles larger than the Kolmogorov length scale and the wavelength of the ultrasonic wave, a threshold is imposed on the integral of the power spectral density of the Doppler signal. The new approach measurement of the local concentration was used. It consists of counting a number NP of the Doppler signals of the solid particles crossing the measurement volume and a number NPt of the Doppler signals of the solid particles crossing the control volume. The concentration profile is then represented by the ration NP / NPt.
The results obtained show that the suspension of fine particles, which represents a tracer, behaves as a homogenous fluid. For large particles, we confirmed the existence of the slip velocity and the effects of both concentration and size particle on the turbulence. The use of two distinct measurement volumes allows the direct determination of the turbulent length scales. The results show that the turbulence characteristics of the carried fluid are modified by the presence of the solid particles.
Keywords: solid-liquid suspension, measurement volume, control volume, ultrasonic transducer
Introduction
1
The improvement of knowledge which governs the transport of the solid-liquid suspensions is the subject of many works having generally led to empirical or semi-empirical models which are valid only for specific conditions. Research carried out on solid-liquid suspensions has investigated the continuous phase and particularly the influence of turbulence modulation.In the works by Elghobashi and Truesdell (1993), Michaelides and Stock (1989), Owen (1969), and Parthasarathy and Faeth (1990a, 1990b), dissipation or production of turbulent kinetic energy in the continuous phase were reported. The effects of particles on the carrier flow turbulence was investigated numerically by Varaksin and Zaichik (2000) and Lei, Taniguchi and Kobayashi (2000).Recently, PUDV was applied to study fluid flow alone or with solid particles by Takeda (1995), Aritomi et al. (1996), Nakamura (1996), Rolland and Lemmin (1996, 1997), Cellino and Graf (2000), Brito et al. (2001), Eckert and Gerbeth (2002), Kikura, Takeda, Sawada (1999), Kikura, Yamanaka, Aritomi (2004), Xu (2003), Alfonsi, Brambilla, Chiuch (2003). Note that the measurement techniques cited in the above references are limited by the nature of the suspensions
The aim of this experimental study is the simultaneous measurement of the local parameters which are the velocity and the concentration fields of the solid particles in flows in a horizontal pipe, the influence of these particles on the turbulence intensity of the carrying fluid and the determination of the turbulent length scales. The difference between our application of PUDV and those cited in the above references resides in the use of a new measurement approach of the local concentration of the solid particles. This approach consists of the representation of the local concentration profile by the ratio of the number of solid particles crossing the measurement volume to the number of solid particles crossing the control volume. PUDV technique was selected rather
Paper accepted July, 2009. Technical Editor: Francisco R. Cunha
than hot wire or film, or Laser, or the PIV technique, because the first would be destroyed by the particles, and with the second the ultrasonic signal is more attenuated when the volumetric concentration of particles increases. The third technique as reported by Jensen (2004) requires many conditions for its application.
Nomenclature
v
C = volumetric concentration, dimensionless
D = pipe diameter, m
max
E = minimal value of the integral of the power spectral density, dimensionless
Np = number of particles crossing the measurement volume, dimensionless
pt
N = total number of particles crossing the control volume,
dimensionless
P f = power spectral density of the Doppler, dimensionless ( ) R = pipe radius, m
e
R = Reynolds number, dimensionless
( , + ∆ )
R x x x = spatial correlation function, dimensionless
sup
S = higher threshold, dimensionless
inf
S = lower threshold, dimensionless
U = axial velocity component, m/s
g
U = solid-liquid slip velocity, m/s
moy
U = flow mean velocity, m/s
t
U =tangential velocity, m/s +
U = dimensionless velocity *
s
U = suspension friction velocity, m/s
p
d = particle diameter, m
D
f = Doppler shift frequency, Hz
e
f = emitted frequency by the transducer, Hz
D
f = average Doppler frequency, Hz r = variable pipe radius, m y = wall normal distance, m
'
u = fluctuation velocity, m/s +
y = dimensionless wall distance
u'o2 = turbulence intensity of water, m/s
u'2 = turbulence intensity of water with the presence of the
solid particles, m/s
u'2 u'o2 = ratio which represents a reduction of turbulence
intensity
Greek Symbols δ = Dirac’s impulse
η
= Kolmogorov length scale, mm
µ = suspension dynamic viscosity, kg/ (m s)
θ = angle between the ultrasonic beam and the pipe axis, deg.
m
ρ = suspension density, kg/m3
p
τ
= wall shear stress, N/m2
Abbreviations
PUDV Pulsed Ultrasonic Doppler Velocimetry PIV Particle Image Velocimetry
Experiment
In this study, PUDV technique originally applied in the medical field is used only for the emission and the reception of the ultrasonic signal. This technique was combined with a data processor for the flow measurement of solid-liquid suspension. This combination allows the determination of a local velocity and a local concentration of the solid particles larger than the wavelength of the ultrasonic wave.
Flow Circuit
The flow circuit is shown in Fig. 1a. It consists of a closed loop made of glass pipes with an internal diameter D of 20 mm. The flow is driven by a variable speed centrifugal pump (1). The suspension is kept at a constant temperature by the heat exchanger (2) during measurement. The test section (Fig 1b), realized in a Plexiglas box which is 150 mm long, 100 mm wide, and 50 mm high, was located at 75D downstream of the pump where the flow was fully-developed. Plexiglas was chosen in order to reduce the reflection of the ultrasonic beam when it crosses the wall. The pressure differential along the test pipe given by two differential pressure transducer (3) allows the determination of the wall shear stress.
This study was performed using water as the continuous phase and glass beads for solid particles. The particles are spherical with a 5% sphericity defect and density of 2640 kg/m3. Four samples of different particle size distributions were tested. The volume-averaged mean particle diameters corresponding to these samples are 0.27, 0.3, 0.4, and 0.7 mm. These particles were chosen to be larger than the Kolmogorov length scale η, estimated to 206.6 µm
near the wall. The particle diameter is ranging between 1.30ηand 3.38η. The volumetric concentrations of the glass beads used in the suspension are 0.5%, 1%, 1.5% and 2%, and were determined from the volume of the flow circuit.
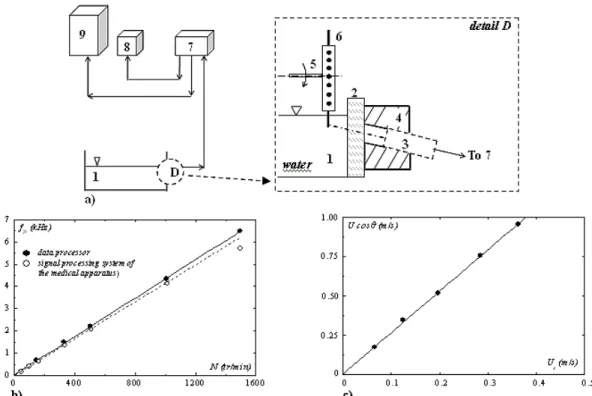
Figure 1. Experimental setup: a) Flow circuit: 1 pump, 2 heat exchanger, 3 differential pressure transducer, 4 test section, 5 tank of suspension; b) Detail of the test section 4: ( ) glass pipe, ( ) Plexiglas box, ( ) Ultrasonic transducer; c) Ultrasonic measurement with acquisition and treatment system: 6 displacement system of the measurement volume, 7 ultrasonic Doppler velocimeter (ECHOVAR CF8, ALVAR), 8 digital storage oscilloscope, 9 data processor (plurimat S), 10 computer.
Performed measurements within this work consider a two way coupling, i.e., taking into account the effects of the particles on the carrier fluid and vice versa. The classification of the suspension flow used is made according to Sato (1996), Elghobashi (1994) and Crowe, Troutt, and Chung (1996) who proposed the particle volume fractions as the criterion of classification. The particle volume fractions are ranging between 1.25 x 10⁻³ and 5 x 10⁻³.
Fine starch particles with 6 µm of diameter and density of 1530 kg/m3 were used as a tracer. The maximum concentration of the starch was fixed at 3% in order to reduce the attenuation of the Doppler signal. The flow mean velocity Umoyis ranging from 1 m/s to 2.5 m/s.
Ultrasonic Measurement System of the Velocity Profiles
The method used for measurement of local velocity of the large particles (larger than the wavelength of the ultrasonic wave) is based on a combination of the measurement technique PUDV (7) (type ECHOVAR CF8) used in medical physics, and a data processor (9). The technical specifications of the velocimeter are: emission frequency of 8 MHz, pulse durations of 0.5 µs, 1 µs, 2 µs, and pulse repetition frequency of 64 µs and 32 µs. The maximum measurable distance of these two pulse repetition frequency are respectively 48 mm and 24 mm.
The position adjustment of the measurement volume is done by time step of 0.5 µs between the emission and reception of the ultrasonic wave. This time step corresponds to the penetration depth of the measurement volume of 0.37 mm for an angle θof 67° (θangle between the internal pipe wall and the direction of the propagation of the ultrasonic waves). The value of θ is nearly equal to that determined by the calibration of the ultrasonic transducer (67.4°). The dimensions of the cylindrical measurement volume are the same as those of the ultrasonic transducer, diameter of 2 mm and length of 0.8 mm.
=
2
D e c f U
f cosθ (1)
with fD being the Doppler shift frequency,fe the emitted frequency by the transducer,
c
speed of the sound in the water, andθthe angle between the ultrasonic beam and the pipe axis.
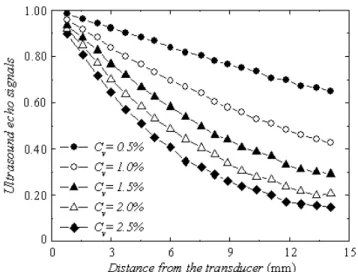
The use of the PUDV technique for the solid-liquid suspensions remains, however, limited by the concentration of the solid particles. Indeed, the preliminary study results show that the concentration of the solid particles and depth of the measurement volume affect the ultrasonic signal. Figure 2 shows that for a concentration higher than 2.5%, the attenuation of the signal is about 20%, and thus the maximum volumetric concentration of solid particles used in this study was Cv= 2%.
Figure 2. Signal attenuation function of the distance from the ultrasonic transducer and the volumetric concentration of particle, dp= 0.7 mm.
Because of the non-uniform distribution of the concentration in the test section, the flow is divided into two regions, having the horizontal line passing through the position of the maximum concentration as a boundary. To obtain this boundary line, which corresponds to the great number of the Doppler signal visualised by a digital storage oscilloscope (Fig. 1c), we have scanned the test section by the displacement of the ultrasonic transducer along the vertical diameter. Before each measurement, the boundary line is located to be taken as the first measurement point.
The first measurements with two identical ultrasonic transducers (one fixed on the pipe top wall and the other on the pipe bottom wall) showed that, at the same position of the measurement volume, the velocity measured presents a difference about 3 - 4 %. For the high concentration, this difference is more significant.
Signal Processing
The treatment of the Doppler signal is done using a data processor associated with ultrasonic velocimeter. The successive Doppler signals received by the ultrasonic transducer are result from either the same particle reached by the successive impulses, or various particles crossing the measurement volume. These signals depend on the particles size, the dimensions of the measurement volume, and the velocity of the particles.
To avoid the spectrum overlap phenomenon and thus the loss of information, the output signal of the velocimeter is sampled with a sampling frequency about 5 to 10 times the greatest frequency of the signal spectrum. The numerical data of the sampling process are stored in the memory of the data processor to be treated. The signal processing is made by an elaborate software where frequency domain and Fourier transform were used.
Figure 3 shows that the power spectral density obtained from different wall distance have the same trend as that of Gauss with a value correlation coefficient close to 0.97. To satisfy the symmetry condition of the power spectrum, a threshold was fixed, only the values greater than 2/3 of the maximum power spectrum were taken into account. The peak amplitude of the power spectra increases with increasing particle diameter; this confirms the difference in energy between the signals coming from the bead glass and those from the starch particles.
The separation between the Doppler signals of the continuous phase and large particle is made using two fixed thresholds on the integral of the power spectral density. The higher threshold Ssup
and the lower threshold Sinf are respectively given by the following
relations: 3 3 − ⎧ = − ⎪⎪ ⎨ − ⎪ = + ⎪⎩ max min sup max max min inf min E E S E E E S E (2)
where Emax and Emin are, respectively, the maximal and the
minimal value of the integral of the power spectral density. The sampled function x tˆ( ) of the Doppler signal x t( ) is given by:
( )= ( )
∑
( − ))
e K
x t x t t
f
δ (3)
where K is a constant and
δ
the Dirac’s impulse. According to the formula of Poisson, we have:ˆ( )
x t
⇄
X( )νΣ
δ(ν - nfe) (4)where X( )ν is the Fourier transform of the Doppler signal
x t
( )
.The values treated using the Fourier transform allow the calculation of the power spectral density P f( ) of the Doppler signal from the product of the frequency spectrum and its conjugate.The average frequency Doppler
f
D is given by the normalizedmoment of order 1 of the ensemble average spectrum.
1 1 ( ) ( ) N n n n D N n n
f G f f G f = = =
∑
∑
(5) where 1(
)
(
)
Nk n k
n
G f
P f
=
=
∑
andk = 1, 2, 3, ..., N
.Considering that the enlargement of the spectrum is due only to the turbulent velocity fluctuations, we can calculate the normalized moment of second order of the energy spectrum integral associated with the Doppler signals. This moment with a Gaussian trend represents the turbulent intensity given by the relation:
' 2 2 1 2
1 1
[
(
)
(
) /
(
)]
= =
=
∑
N−
∑
ND n D n n
n n
f
f
f
G f
G f
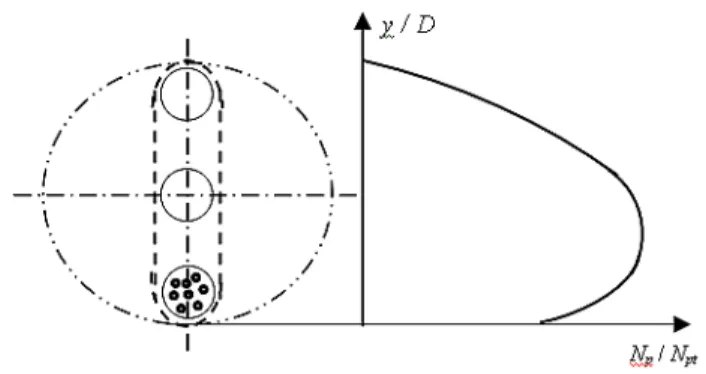
(6)Measurement Method of the Local Concentration Profile
This method consists of determining the ratio of the number of particles Npcrossing the measurement volume to the total number
of particles Nptcrossing the control volume. This control volume is
obtained by the displacement of the measurement volume along the vertical diameter of the test section (Fig. 4).
Figure 4. Determination of the concentration profile:( ) measurement volumeNp, ( ) control volumeNpt, ( ) test section.
The numbers of particles Np and Nptare obtained by
counting the number of the Doppler signal respectively in the volume measurement and in the control volume. For this counting made for each measurement point of the particle velocity, two thresholds are fixed, one on the amplitude of the Doppler signal and the other on the integral of the power spectral density.
The total number of particles Npt is given by:
1
( ) = =
∑
npt p i
i
N N (7)
with n the number of the measurement point.
The local concentration profile is obtained by the plot of the variation of the ratioNp Npt versus the depth of the measurement volume along the vertical diameter of the test section (Fig. 4).
Validation of the Processing Signal Method and Calibration of the Ultrasonic Transducer
Figure 5. Validation of the signal processing method and calibration of the ultrasonic transducer: a) Calibration system: 1 glass tank of calibration, 2 lateral wall of the tank, 3 ultrasonic transducer, 4micrometric displacement system of the transducer, 5 plastic disc, 6 Abrasive cloth band or cylindrical metal rods, 7 ultrasonic Doppler velocimeter, 8 digital storage oscilloscope, 9 Data processor (Plurimat S). b) Validation curve of the signal processing method. c) Calibration curve of the ultrasonic transducer.
For the calibration of the ultrasonic transducer (3), which consists of determining the exact value of the inclination angle of the ultrasonic transducer, the same device as that of the validation of the signal processing method was used, except for the plastic disc where the abrasive cloth band is replaced by cylindrical metal rods (6) of 1 mm diameter and 15 mm length. Figure 5c shows a good linearity between a known tangential velocity Ut of the rods crossing the measurement volume and the value of U cosθdetermined from the signal processing. The inclination angle of the ultrasonic transducer (θ = 67.4°) determined from the calibration curve is very close to that used in the medical apparatus (θ = 67°).
Measurement System of the Scale Length of Turbulence
In addition to the analysis of the fluctuating velocity that generates the spectrum distribution ofenergy. The measurement of the turbulent scale allows the study of the particle-turbulence interactions and the characterization of the turbulent flows.
The integral turbulent length scaleLt is determined from the two-point spatial correlation functionR x x( , + ∆x)for statistically steady turbulence. R x x( , + ∆x) given by Eq. (8) is obtained by simultaneously measuring the velocity in two distinct points distant from∆x.
' '
' 2 ' 2 ( ) ( , ) ( , )
( ) ( , ) + ∆ + ∆ =
+ ∆
i i
i i
u x u x x x R x x x
u x u x x x
(8)
For homogeneous isotropic turbulence, the integral length scale is given by:
1 ( ) 3 = t
L L x (9)
where ( )L x is the length scale tensor given by:
1
( ) ( , ) ( )
2 +∞ −∞
=
∫
+ ∆ ∆L x R x x x d x (10)
The direct measurement of the turbulent length scales is carried out by taking measurements of fluctuation velocity simultaneously in two measurement volumes. These measurements are obtained by using two identical ultrasonic transducers placed on the same vertical plane of the test section (Fig. 1b). The first measurement volume, corresponding to the ultrasonic transducer placed on the pipe bottom wall, is fixed on the pipe axis. The second measurement volume, corresponding to the ultrasonic transducer placed on the pipe top wall, is moving. Note that this measurement of the velocity fluctuation simultaneously is made along the propagation axis of the ultrasonic wave emitted by the ultrasonic transducer placed on the pipe bottom wall.
Experimental Results
Measurement of the Velocity and the Concentration Profiles of the Fine Particles
The rheological study of the starch suspension in water made in a rotating viscometer of coaxial cylinders (Haake RV12), showed that the suspension have a shear thickening behaviour described by the power law rheological model.
n = k
τ ε (11)
where τ is the shear stress, k is the flow consistency index and n is the flow behaviour index. These two rheological parameters determined from the flow curves, k= 0.33 x 10⁻³ kg/ms and n = 1.1, are necessary to determine the velocity profile using the model of Pai (Brodkey, Lee, Chase (1961) and Brodkey (1963)) valid for the Newtonian and non-Newtonian fluids when the Reynolds number is lower than 105. This model is given by:
1
2
1 2
1
+
⎛ ⎞ ⎛ ⎞
= + ⎜ ⎟ + ⎜ ⎟
⎝ ⎠ ⎝ ⎠
n
m n
max
U ( r ) r r
a a
U R R (12)
where Umax is the maximum velocity generally taken on the pipe
axis, R the pipe radius, andr = R - ythe variable pipe radius (yis the wall normal distance). The constantsa1, a2 and m depend on the nature of the fluid, the boundary conditions and the flow mean velocity.
Figure 6 shows the velocity and the concentration profiles of the water-starch suspension obtained along the test section diameter. The velocity profile coincides well with the theoretical profile of Pai, and the concentration profile has a uniform distribution. According to Furuta et al. (1977), we can thus assume that fine particle suspension which represents a tracer behaves as a homogeneous fluid and the slip velocity of the solid-liquid suspension is negligible. In the following results the velocity profile of water alone will be represented by the model of Pai.
Figure 6. Velocity and concentration profiles of water-starch suspension, e
R = 42000, the volumetric concentration of the starchis Cv= 0.3%.
Measurement of the Velocity and the Concentration Profiles of the Large Particles
Large particles of high density compared to the carrier fluid, i.e., those where the diameter exceeds the wavelength of the ultrasonic wave, do not follow the flow. In this paper, only the results corresponding to the particles of diameter 0.13 and 0.4 mm are presented.
Effect of the Mean Flow Velocity
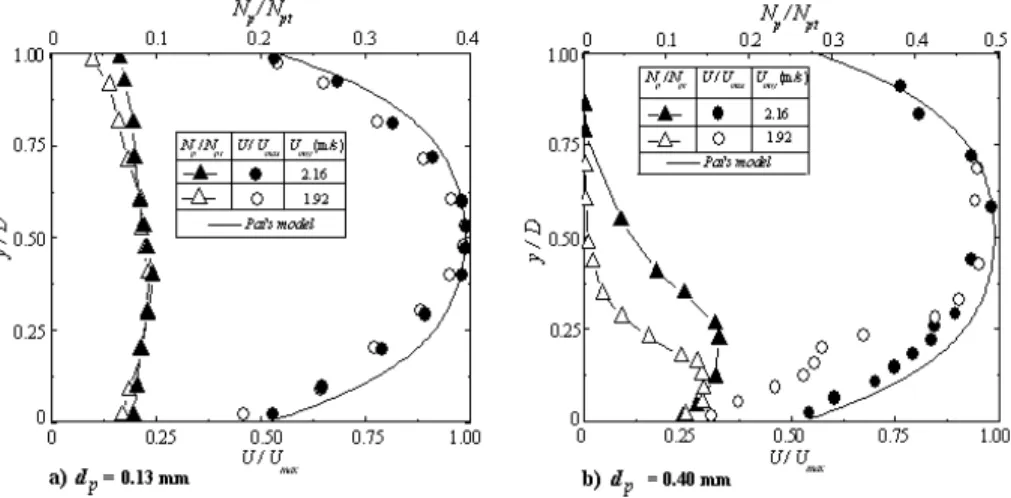
A mean flow velocity range of 1 m/s to 2.5 m/s was used. This range corresponds to the heterogeneous and saltation flow regimes. Figure 7 shows the influence of the mean flow velocity on the velocity and the concentration profiles of the solid particles of diameter 0.13 and 0.4 mm respectively.
The velocity profiles are parabolas with a top around the pipe axis, very near for dp= 0.13 mm and below for dp= 0.4 mm. For
the other particle diameter of 0.27 mm and 0.7 mm (which are not presented in this paper), the tops are below the pipe axis. The presence of the particles near the top wall was observed only for
p
d = 0.13 mm and Umoy= 2 m/s.
The concentration profiles are in a good agreement with the observations of the flow made during the experimental tests. Indeed, for a constant volumetric concentration and a mean flow velocity ranging between 1 and 2 m/s, the flow of the particles suspension of diameter 0.27 mm, 0.4 mm and 0.7 mm is a saltation regime. It becomes heterogeneous when the flow means velocity exceeds 2 m/s. For the particles of diameter 0.13 mm, the flow suspension is heterogeneous regime.
Effect of the Particle Volumetric Concentration
Figure 8 shows the influence of the volumetric concentration of the solid particles on the velocity and local concentration profiles. Note that the difference between the velocity profile of the solid particles and that of the carrying fluid (Fig. 8a), which represents the solid-liquid slip velocity, increases with the increase in the volumetric concentration.
The local concentration profiles (Fig. 8b) present a maximum value whose position moves away from the internal pipe bottom wall, when the volumetric concentration decreases. For the lower volumetric concentration, the local concentration profile tends to that of the carrying fluid (or the fine particles) which is almost uniform. The presence of the particles near the pipe top wall was observed for the volumetric concentration lower than 0.5 %.
Figure 8. Effect of the particle volumetric concentration on: a) the velocity profiles, dp= 0.27 mm, Re= 44600; b) the local concentration profiles,
p
d = 0.4 mm, Re= 44600.
Effect of the Particle Diameter
The Figure 9a shows that for all the particle diameters used, the velocity profiles of the solid particles have the same trend as that of the carrying fluid. The difference between the velocity profile of continuous phase and that of the solid phase confirms the existence of the solid-liquid slip velocity which increases with increasing particle diameter.
Figure 9b shows that for the solid particles of diameter 0.13 mm and 0.27 mm, the local concentration profiles tend to that of the carrying
fluid. The maximum of local concentration profile appears for dp= 0.4
mm and dp= 0.7 mm. The solid particles are present near the pipe top
wall only for the small diameter (0.13 mm).
Figure 9. Influence of the particle diameter on: a) the velocity profiles Cv= 1%, Re= 44600; b) the concentration profiles Cv= 1%, Re= 44600.
Results Analysis
The above results show that the concentration distribution of large particles depends on the flow regime of the suspension. This regime being initially by saltation then hetero-saltation to become finally heterogeneous. In the first regime, the concentration increases until some millimeters from the pipe bottom wall, and takes an exponential trend thereafter. These results are similar to those of Ohashi and Sugawara (1980), and Roco and Shook (1980). The velocity profile is part of parabola with a maximum value located above the pipe axis. In the transition flow regime, hetero-saltation, the maximum concentration moves towards the pipe axis with the same trend, the velocity profile preserves the same trend with more particles which migrate to the wall top pipe. The heterogeneous flow regime is characterized by a parabolic profile of both concentration and velocity with the maximum located respectively below and above or on the pipe axis. We can thus see that the velocity profile, the concentration profile, and the solid-liquid slip velocity are influenced by the flow regime of the suspension.
Concerning the trend of the profiles, the maximum position of both local velocity
max U
Y and local concentration
max C
Y is studied.
Figure 10 shows that, contrary to
max C Y ,
max U
Y is always located
above the pipe axis. Similar results are obtained for other volumetric concentations. It is noticed that for the same flow mean velocity,
max U Y and
max C
Y tend to the axis pipe when the particle diameter
decreases, but
max C
Y is always below. For dp= 0.7 mm,
max U
Y approaches the axis only when Umoyexceed 2.23 m/s, and
for dp= 0.4 mm and 0.7 mm,
max C
Y does not exceed D/4. Similar
results have been obtained for other volumetric concentrations.
Figure 10. Variation of YUmaxand YCmaxversus the flow mean velocity
and particle diameter, Cv = 1%.
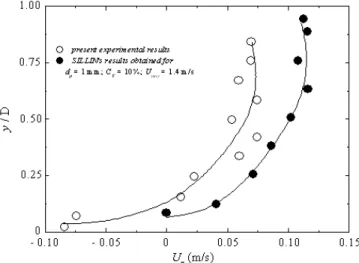
Figure 11 shows the variation of the solid-liquid slip velocity
g
U from the pipe bottom wall. These results are compared to those of
Sillin (1964); the solid-liquid slip velocity is negative for y < 3 mm, increases for 3 mm < y < 13 mm, and is equal to zero for y = 3 mm as founded by Sillin (1964). The negative slip velocity for y < 3 mm is due to the high velocity gradient and to the particle inertia.
Figure 11. Variation of the slip velocity along the test section diameter,
p
d = 0.4 mm, Cv = 1.5%, Umoy = 2.1 m/s.
The obtained results show that the velocities of the glass beads depend on the flow mean velocity, the concentration and the particle diameter. To analyze the distribution of local mean velocities of the solid particle quantitatively and to study the influence of each parameter referred above, we have to examine the variations of the
dimensionless velocity profiles U+:
( )
+= +
U f y (13)
with y+ as the dimensionless wall distance.
Figures 12a and 12b show that for 30 <y+< 300, the dimensionless velocity profiles of the solid particles are all located below the dimensionless velocity profile of water alone, as given by the universal law.
5 75 5 5
+= ++
U . log y . (14)
valid for y+> 30.
The dimensionless velocity profiles of the solid particles can be put in the form
+= ++
U Alog y B (15)
with
+= * s U U
U
(16)
where U*s= τp ρm is the friction velocity of a solid-liquid suspension determined by analogy with ahomogeneous fluid, τp is
the wall shear stress determined from the differential pressure measured by a piezoelectric pressure transducer (Fig. 1a), andρm the suspension density.
The dimensionless wall distance in the case of the suspension is given by:
+= *s m m yU
y ρ
µ (17)
The suspension viscosity µm depends on the volumetric
concentration Cv. The models proposed by Mooney (1951), Ford (1960), and Thomas (1953) for the suspension dynamic viscosity according to the volumetric concentration, are applied. The results shown for volumetric concentrations lower than 5%, the suspension dynamic viscosity can be represented by the carrying fluid viscosity. The coefficients A and B of Eq. (15) decrease with increasing concentration and the diameter of the solid particles. The difference between the dimensionless velocity profile of water alone and profiles of the solid particles, which increase with concentration, is related to the increase of solid-liquid slip velocities. The same observations were made by Idrissi (1987) by using ultrasound velocimetry. He established a model of coefficients A and B which is a function of the diameter and the concentration of the solid particles.
Figure 12. Dimensionless velocity profiles of the solid particles: a) for various volumetric concentration (dp= 1 mm); b) for different particle diameter
Particles Concentration Effect on the Turbulence Intensity
Considering that the widening of the power spectrum associated with the Doppler signal is only due to the turbulence, we have calculated the turbulence intensity from the second order moment. Figure 13 shows that for water alone, the turbulence intensity in the parietal area is greater than that near the pipe axis. The turbulence intensity decreases when the glass beads concentration increases along the test section diameter.
Figure 13. Turbulence intensity of water and solid particles, Re= 44000,
p
d = 0.4 mm.
For each particle diameter used (0.13 mm, 0.27 mm, 0.4 mm and 0.7 mm), the ratio of particle diameter (dp) to turbulent length
scale Lt(determined by Eq. (9)) is less than 0.1. According to Gore and Crowe (1989), the turbulent kinetic energy of the continuous phase is dissipated.
Figure 14 shows that the turbulence intensity decreases with concentration and increases with distance from the wall. We noticed a reduction from 2.1 % to 5 % of the turbulence intensity at 2% of volumetric concentration. This result is similar to those of Bouvard and Petkovic (1973). Kulick, Fessler, and Eaton (1994) have shown that fluid turbulence was attenuated by the addition of particles smaller than the Kolmogorov length scale, and that the degree of attenuation decreased with the distance from the wall. According to Ahmed and Elghobashi (2000), this decrease is due to the change of turbulent kinetic product rate of the continuous phase, which is caused by the particle effect on the vorticity dynamic.
Particle Concentration Effect on the Turbulence Integral Length Scale
Figure 15 represents the spatial correlation of water alone and the solid particles of diameter 0.4 mm and volumetric concentration
v
C = 1% obtained by the use of two identical ultrasonic transducers (Fig. 1b). The lateral integral length scale was calculated by using a 10 mm separation between two measurement volumes that correspond to the radius of the pipe. From Eqs. (8)-(10), the determined lateral integral length scale of water alone and solid
particles was respectively 3.75 mm and 3.32 mm. It is apparent that the lateral integral scale decreases when the solid particles concentration increases. We noticed a reduction of the turbulence scale of 9.75% for a 1% concentration.
Figure. 14 Reduction of turbulence intensity Re= 44600, dp= 1 mm.
Figure 15. Reduction of the lateral integral scale of turbulence, e
R = 44600, dp= 0.4 mm.
Conclusion
In this experimental study, we have tested a new approach measurement in order to determine simultaneously the velocity profiles and the concentration profiles of the solid particles (glass bead) and the continuous phase (water) of two phase flow in horizontal pipe. The distinction between the Doppler signals coming from the solid phase and the continuous phase was obtained by imposing a threshold on the integral of the power spectral density.
The results obtained show that for the fine particles, the suspension behaves like a homogeneous fluid; the velocity profile is in a good agreement with the Pai’s model, and the concentration profile is almost uniform.
For the large particles, saltation and heterogeneous flow regimes were obtained. These two regimes depend on the diameter and volumetric concentration of the particle, and on the flow mean velocity. The slip velocity, which is responsible for the fluid-particle interaction, depends on the flow regime.
The dimensionless velocity profiles of the large particles follow a logarithmic law with slope depending on the concentration and particle diameter. The turbulence characteristics are also affected by the presence of the solid particles. Indeed, the results show that the turbulence intensity is reduced when the volumetric concentration of particles is increased.
The use of two identical ultrasound transducers and thus two distinct measurement volumes allows the determination of the turbulent length scale of the continuous phase and solid particles. The results show that the presence of particles can modify the turbulent length scale of the continuous phase.
In our next study concerning the solid liquid suspension, PUDV and Particle-Tracking Velocimetry (PTV) will be applied together. The best advantage of PTV is the possibility of measurements of large particles, by which the fluid-particle interactions and the particle-response property will be able to be examined. This allows us perhaps a better understanding of the phenomenon caused by the fluid-particle interactions, and also probably by the particle-particle interactions because of high concentration near the wall. It is also necessary to investigate interactions between these phenomenon and particle motion due to two-way and four-way couplings in a wide range of particle diameter, specific density, and sediment concentration, and then to develop reasonable computer simulation models of two phase horizontal pipe flow.
Acknowledgments
This work has been supported by Research Laboratory of Industrial Technologies, University of Ibn Khaldoun of Tiaret. The first author would like to thank Professor S. Hadj Ziane, Institute of Physics, University of Ibn Khaldoun of Tiaret, for useful discussions as well as for providing support to perform this work.
References
Ahmed, A.M., Elghobashi, S.E., 2000, “On the mechanisms of modifying the structure of turbulent homogeneous shear flows by dispersed particles”, Phys. Fluids, Vol. 12, No. 11, pp. 2906-2930.
Alfonsi, G.,Brambilla, S., Chiuch, D., 2003, “The use of an ultrasonic doppler velocimeter in turbulent pipe flow”, Experiments in Fluids Vol. 35, pp. 553-559.
Aritomi, M., Zhou, S., Nakajima, M., Takeda, Y., Yoshioka, Y., 1996, “Measurement system of bubbly flow using ultrasonic velocity profile monitor and video data processing unit”, J. Nucl. Sci. Technol, Vol. 33, pp. 915-923.
Bouvard, M., Petkovic, S., 1973, “Modification of a Turbulence Characteristics under the Influence of Solid Particles in Suspension”, La Houille Blanche, Vol. 1.
Brito, D., Nataf, H.C., Cardin, P., Aubert, J., Masson, J.P., 2001, “Ultrasonic doppler velocimetry in liquid Gallium.” Experiments in Fluids, Vol. 31, No. 6, pp. 653-663.
Brodkey, R.S., Lee, J., Chasse, R.C., 1961, “A generalized velocity distribution for non-newtonian fluids” A. I. Ch. E. Journal, Ohio.
Brodkey, R.S., 1963, “Limitations on a generalized velocity distribution” A. I. Ch. E. Journal, Ohio.
Cellino, M., Graf, W.H., 2000, “Experiments on suspension flow in open channels with bed forms”, Journal of Hydraulic Research, Vol. 38, No. 4, pp. 289-298.
Crowe, C.T., Troutt, T.R., Chung, J.N., 1996, “Numerical models for two-phase turbulent flows”, Annu Rev Fluid Mech., Vol. 28, pp. 11–43.
Eckert, S., Gerbeth, G., 2002, “Velocity measurements in liquid Sodium by means of ultrasound doppler velocimetry”, Experiments in Fluids, Vol. 32, No. 5, pp. 542-546.
Elghobashi, S.E., 1994, “On predicting particle-laden turbulence flows,”
Appl Sci Res., Vol. 52, pp. 309-329.
Elghobashi, S.E., Truesdell, G.C., 1993, “On the two-way interaction between homogeneous turbulence and dispersed solid particles. I: turbulence modification,” Phys Fluids A, Vol. 5, No. 7, pp. 1790-1801.
Gore, R.A., Crowe, C.T., 1989, “Effect of particle size on turbulent intensity,” Int J Multiphase Flow, Vol. 15, pp. 279-285.
Furuta, T., Tsujimoto, S., Toshima, M., Okasaki, M., Toei, R., 1977, “Concentration distribution of particles solid-liquid two phase flow through vertical pipe”. Memoirs of the Faculty of Engineering, Kyoto University, Vol. 36, Part 4.
Ford, T.F., 1960, “Viscosity and fluidity concentration, relation ships for suspension of spherical particles in newtonian liquids”, J. Phys. Chem. Flight, Vol. 64, pp. 1168.
Idrissi, B.A., 1987, “Solid-liquid Mixture Flow in Pipe. Velocity profiles in Vertical Flow,” Thesis of Doctorate, University of Louis Pasteur, Strasbourg, France.
Jensen., K.D., 2004, “Flow measurements”, J. Braz. Soc. Mech. Sci. & Eng., Vol. 26, No. 4, pp. 400-419.
Kikura, H., Takeda, Y., Sawada, T., 1999, “Velocity profile measurements of magnetic fluid flow using ultrasonic doppler method”,
Journal of Magnetism and Magnetic Materials, Vol. 201, pp. 276-280. Kikura, H., Yamanaka, G., Aritomi, M., 2004, “Effect of measurement volume size on turbulent flow measurement using ultrasonic doppler method”, Experiments in Fluids, Vol. 36, No. 1, pp. 187-196.
Kulick, J.D., Fessler, J.R., Eaton, J.K., 1994, “Particle response and turbulence modification in fully-developed channel flow,” J Fluid Mech, Vol. 277, pp. 109-134.
Lei, K., Taniguchi, N., Kobayashi, T., 2000, “LES of particle-laden turbulent channel flow considering SGS coupling,” Trans JSME B, Vol. 66, No. 651, pp. 2807-2814.
Michaelides, E.E., Stock, D.E., 1989, “Turbulence modification in dispersed multiphase flows,” FED, Vol. 80, ASME, New York.
Mooney, M., 1951, “The viscosity of concentrated suspension of spherical particles,” Journal Colloid Science, Vol. 6, pp. 162-170.
Nakamura, H., 1996, “Simultaneous measurement of liquid velocity and interface profiles of horizontal duct wavy flow by ultrasonic velocity profile meter”, 1st International Symposium on Ultrasonic Doppler Methods in Fluid Mechanics and Fluid Engineering, Villigen PSI, Switzerland.
Ohashi, A., Sugawara, T., 1980, “Average particle velocity in solid-liquid two phase flow through flow vertical and horizontal tubes”, Journal of Chemical Engineering of Japan, Vol. 13, No. 5.
Owen, P.R., 1969, “Pneumatic transport”, J Fluid Mech., Vol. 39, pp. 407-432.
Parthasarathy, R.N., Faeth, G.M., 1990(a), “Turbulence modulation in homogeneous dilute particle-laden lows,” J. Fluid Mech., Vol. 220, pp. 485-514.
Parthasarathy, R.N., Faeth, G.M., 1990(b), “Turbulent dispersion of particles in self-generated homogeneous turbulence,” J Fluid Mech., Vol. 220, pp. 515-537.
Roco, M.C., Shook, C. A., 1980, “Modeling of slurry flow, the effect of particle size”, Canadian Journal of Chemical Egineering, Vol. 61, pp. 494-503.
Rolland, T., Lemmin, U., 1996, “Acoustic doppler velocity profilers: application to correlation measurement in open-channel flow”, 1st International Symposium on Ultrasonic Doppler Methods in Fluid Mechanics and Fluid Engineering, Villigen PSI, Switzerland.
Rolland, T., Lemmin, U., 1997, “A two-component acoustic velocity profile for use in turbulent open-channel flow”, J. Hydraulic Res., Vol. 35, pp. 545-561.
Sato, Y., 1996, “Turbulence Structure and Modelling of Dispersed Two-Phase Flows”, Keio, Ph.D. Thesis, Keio University, Japan.
Sillin, N.A., Ocheretko, V. F, 1964, “Experimental study of distribution of velocity, concentration and size grain in two-phase flow”, Hydrotechnic and Hydromécanic, pp. 63-69, ed. Ukrainian, Ac. of Sci., Kiev, Russian.
Takeda, Y., 1995, “Velocity profile measurement by ultrasonic doppler method”, Experimental Thermal and Fluid Science, Vol. 10, No. 4, pp. 444-453.
Thomas, B., 1953, “Viscosity of suspension”, Proc. of 3rd Midwestern Conf. Fluid Mech.
Varaksin, A.Y, Zaichik, L.I., 2000, “Effect of particles on the carrier flow turbulence”, Thermophys Aeromech, Vol. 7, pp. 237-248.