Article
Printed in Brazil - ©2016 Sociedade Brasileira de Química 0103 - 5053 $6.00+0.00
*e-mail: [email protected]
Integrated Synthesis of Zeolites Using Coal Fly Ash: Element Distribution in the
Products, Washing Waters and Effluent
Suzana F. Ferrarini,* Ariela M. Cardoso, Alexandre Paprocki and Marçal Pires
Programa de Pós-Graduação em Engenharia e Tecnologia de Materiais, Pontifícia Universidade Católica do Rio Grande do Sul, Av. Ipiranga 6681, 90619-900 Porto Alegre-RS, Brazil
Coal fly ash has been proposed as an alternative raw material for zeolite synthesis, however, the mobilization of toxic elements of this material into zeolite products, washing water and effluent is rarely addressed. In this study, Brazilian coal fly ash was used in the integrated synthesis (two steps) of zeolites Na-P1 and 4A and the distribution of approximately 40 major, minor and trace elements was investigated in all the input and output flows involved in the process. The mobilization of several elements was observed in the zeolite products, a number of which are highly toxic, such as As, Cd, Cr, Ni and Pb. With regard to the amount present in the ash, both zeolites were enriched in several elements, such as Ni in zeolite Na-P1 and As in zeolite 4A. The latter exhibited high purity, with most of the elements investigated having concentrations close to those measured in commercial zeolite 4A. Important information was gathered regarding zeolite synthesis using fly ash, which will ensure safer application of these materials and, if necessary, propose a contaminant-free synthesis route.
Keywords: zeolite, coal fly ash, toxic element, element distribution
Introduction
The coal combustion process, particularly in thermoelectric power plants, generates a significant amount of pollutants, including ashes.1,2 Of the total annual
amount generated worldwide (750 million tons), less than 50% is reused.3 Several toxic elements present in this
residue are easily leached into the environment, potentially contaminating the soil as well as surface and groundwater in disposal areas.4,5
Reviews conducted by Ahmaruzzaman1 and
Moreno et al.6 highlight the different uses of coal fly ash
(CFA), primarily in the concrete and cement manufacturing industries, as well as ceramic applications, additives for the immobilization of industrial wastes and of water treatment wastes, land stabilization in mining areas, sorbents for flue gas desulfurization, filter material in the construction of roads, embankments and structural fill among other applications. In Brazil, potential uses for CFA are little explored, with the exception of applications in the pozzolanic cement, paving and bricks.7-9 However, given
the amount generated annually (ca. 3 million tons), these applications utilize a relatively small percentage (ca. 30%),
with the rest disposed of in ash ponds, landfills or exhausted mines.9,10 An important application of this waste, which has
garnered scientific interest, is its use in zeolite synthesis due to a number of CFA characteristics, including high silicon and aluminum content (the main components of zeolites), elevated levels of reactive (amorphous) phases and small particle size, as well as its low cost and wide availability.1,11
Zeolites are non-toxic hydrated crystalline aluminosilicate frameworks used worldwide and known for their remarkable thermal and chemical stability, versatility, low cost and uniform porosity.12 The conversion of CFA into
zeolitic material has long been studied by researchers from different countries.13-23 Yields for CFA direct conversion
(one step synthesis process) into zeolites can vary from 50 to 75%.24
Applications for zeolites synthesized using CFA are the same as those of natural zeolites and zeolites made from natural materials (kaolin, diatomites) or other aluminosilicate industrial wastes.25-28 Both natural zeolites
and those directly synthesized (one step or one-pot process)29,30 from less pure materials limit their possible
uses to (i) removing metals from industrial wastewater;31-33
(ii) acid mine drainage.22,34-37 Some other specific
applications (catalysis,38 food packaging,39 biomaterials,40
purity zeolites, which can be an impediment for the use of residues on their synthesis.
A major problem associated with the use of CFA for zeolite synthesis is the presence of a large amount of potentially toxic coal-derived compounds.4,43,44 In
hydrothermal zeolite synthesis, the reagent used to extraction of Si and Al may not be selective for these elements alone and ultimately carries additional undesirable elements into the obtained product. Once incorporated into the zeolites, these elements can eventually mobilize into the environment during the useful life of these materials.
There are few studies in the literature on the transfer of undesirable elements from ash into zeolite.45-48 To the best of
our knowledge, only Belviso et al.45 conducted a complete
characterization of CFA and synthetizes zeolites, including determining trace elements, whereas other authors46-48
assessed only major elements. Recent studies conducted by Behin et al.49 related to transfer of trace elements from
zeolites NaP type. These authors studied the behavior of this zeolite in leaching tests using deionised water.
Distribution and mobility of both structural (Si, Al and Na) and extra framework elements were evaluated during hydrothermal zeolite synthesis in one-step (one-pot)45 and
two-steps processes.46 Assessing the presence of extra
framework elements and how they behave during zeolite application may provide answers to several questions regarding the quality of the product generated. These studies can also provide insights in free-contaminants synthesis routes even when using alternative raw materials. Thus, proving unequivocally the safe application of zeolites produced from wastes.
The aim of this study was to evaluate the presence and distribution of structural elements and contaminants (metalloids and nonmetals) in precursor ash, synthesized zeolites (Na-P1 and 4A), washing water and final effluent of the integrated alkaline hydrothermal process (two-step). Commercial zeolites produced using conventional reagents were also analyzed and the results compared to the produced zeolites.
Experimental
Material
For zeolite synthesis, CFA samples collected from the electrostatic precipitator of the Presidente Médici Thermoelectric Power Plant (UTPM), in the city of Candiota (Southern Brazil), were used. The UTPM has three units (A, B and C); tests in this study were conducted using fly ash from Unit B (CFA-UB) which, given its greater combustion efficiency, generates ash with a lower
level of unburned material than the other two units.22 The
samples were dried in an oven (105 ºC, 2 h) and stored in a dry place at room temperature in opaque, colorless plastic bottles until use. Commercial zeolites 4A and Na-P1 were dried and stored in the same way of the produced zeolites. The following certified reference materials (CRMs) were used to determine chemical analyses accuracy: Coal Fly Ash-SRM 2690; Zeolite Y-RM 8850; Zeolite A-RM 8851 from the NIST (National Institute of Standards and Technology) in Gaithersburg, Maryland.
All the chemicals used were analytical grade. The solutions and samples were prepared with high purity deionized water (resistivity of 18.2 MΩ cm, obtained from a Milli-Q system, Millipore). Calibration solutions for flame atomic absorption spectrometry (FAAS) were prepared using appropriate dilutions of standard single-element solutions with 1,000 mg L-1 (Titrisol, Merck)
of the analytes in HNO3 solution. For inductively coupled
plasma mass spectrometry (ICP-MS), calibration solutions were prepared from appropriate dilutions of standard single-element solutions with 10 mg L-1 (PerkinElmer Pure
Plus) of the analytes in HNO3 solution. The HNO3 content
in the calibration solutions was varied to ensure it was close to that of the sample. Rh was used as an internal standard at a concentration of 5 µg L-1. The Rh solution was added to the
samples, blanks and calibration solutions.50 The flasks and
glassware used were washed beforehand with 5% neutral detergent (Extran®) and then decontaminated with 10% HNO3 solution (v/v). The polytetrafluoroethylene (PTFE)
bombs used in sample digestion were decontaminated with concentrated HNO3 and heating to 150 °C for a period of
10 hours in an oven. To ensure that the PTFE pumps were free of contaminants, blank tests were subjected to the same digestion process in all batchs.
Integrated synthesis of zeolites
The integrated synthesis process followed the procedure optimized by Cardoso et al.23 and is shown in Figure 1.
Synthesis is triggered by the activation of CFA (B) through a conventional hydrothermal process using a 3.0 mol L-1 NaOH solution (A) and L/S ratio of 6 L kg-1,
in a closed reactor at 100 °C for 24 hours. The first solid product (E) obtained was separated by filtration (glass membrane, Millipore, 0.22 µm) and washed with deionized water (25 L kg-1) under magnetic stirring at
by FAAS (model AA 55, Varian) and concentrations of other elements in the washing water were established by ICP-MS (model 7770X, Agilent). The molar ratio was adjusted to 1.0 (for zeolite 4A formation) by adding an NaOH alkaline solution (3.0 mol L-1) containing Al (G),
previously dissolved from aluminum metal powder. The resulting solution was transferred to the reactor and stirred manually (2 minutes at 25 ºC) and immediately heated in an oven at 90 ºC for 1.5 h, followed by an additional 2.5 h at 95 ºC. After this process, the second solid product (K) was submitted to the same filtration (effluent H) and washing (washing waters I and J) previously described.
The supernatant from the first stage (F), washing waters (C, D, I and J) and final effluent (H) was diluted with a 5% HNO3 solution (v/v) as needed and analyzed by ICP-MS.
In order to determine synthesis reproducibility and obtain higher zeolite product mass, fifteen integrated syntheses were performed under the conditions shown in Figure 1. The products (15 Na-P1 and 15 4A zeolites) were individually characterized (scanning electron microscope (SEM) equipped with an energy dispersive system (EDS) and cation exchange capacity (CEC)) recombined and homogenized into two bulk samples containing zeolites Na-P1 and 4A, after formation and purity were confirmed.
Ash and zeolite characterization
To determine the initial amount of the elements under study, the CFA-UB samples, zeolites and CRMs (B, E and K) were submitted to acid digestion in an oven with air circulation (model MA 035-Marconi) using Teflon®
bombs. To that end, 0.20 g of the samples was mixed with 7 mL of HNO3 conc., 3 mL of HF conc. and 2 mL of H2O2
conc. The mixture was allowed to stand for 1.5 h. Next, the
bombs were closed and heated at 150 °C for 10 h in an oven. Once the mixture had cooled, 4 mL of 20% H3BO3 solution
(m/v) was added to eliminate HF, preventing damage to the ICP-MS torch. Next, the samples were quantitatively transferred to polypropylene vials, which were topped up to 50 mL with deionized water.43,51 For ICP-MS analysis
the samples were diluted with a 5% HNO3 solution (v/v)
as needed. Method accuracy was assessed using CRMs and indicated absolute errors (in three determinations) lower than 10% (for elements with certified values) and recoveries within the acceptable measurement range, demonstrating that the above method can be extended to samples with similar frameworks (see Supplementary Information section for more details of these results).
The samples were homogenized for X-ray fluorescence (XRF) (MiniPal4, PANanalytical), and the mineral composition of CFA-UB samples was analyzed by X-ray diffraction (XRD) (D-Max 2000, Rigaku Dengi) with Cu Kα radiation generated at 30 kV and 15 mA, using
Jade Plus 5 software (MDI, 2000). The crystalline phases in the samples were identified using the Joint Committee on Powder Diffraction Standards (JCPDS) file for inorganic compounds.
The CFA-UB samples and zeolites were morphologically characterized using a SEM (Philips, XL 30) equipped with a system EDS.
The CEC of the zeolites was tested by adding 50 mL of 0.1 mol L-1 NH
4Cl or CaCl2 solutions to 0.5 g of
previously dried zeolite in falcon centrifuge tubes.23,52
Next, the mixture was stirred using a device that rotates the extraction vessel end-over-end (MA 160, Marconi) for 30 minutes and then centrifuged (206 R FANEM). Na+ and Ca2+ ions (for zeolite 4A) were quantified using
ion-exchange chromatography (IC) (Dionex DX 500) and detected by electrical conductivity (ED40). NH4+ ions
(for zeolite Na-P1) were quantified by ultraviolet-visible spectrophotometer (UV-Vis) (HP 8456).
Results and Discussion
The fly ash characterization
Morphology
Figure 2 shows SEM images demonstrating the morphology of CFA-UB samples. There is a notable presence of heterogeneous particles ranging from spherical (Figure 2c) to unevenly shaped characteristic of unburned coal (Figure 2d), amorphous particles that have undergone diffusion in contact with other particles or rapid cooling (Figure 2e), magnetic iron oxide particles (Figure 2f) and minerals (Figures 2g and 2h). Literature data indicate
Figure 1. Flow diagram of the integrated zeolite synthesis. Ellipses
similar structures for CFA obtained from coal burned in other countries.53,54 EDS spectra (results not shown)
indicated the chemical composition of these particles. The predominant elements were silicon and aluminum, with lower quantities of iron, calcium, potassium and magnesium. Figure 3 shows that aluminum is primarily associated with silicon and that the relative amount of these components varies from particle to particle. These particles are commonly found in CFA samples and, due to their morphology, are known as cenospheres (Figure 3a), hollow particles resulting from the expansion of inner gas during solidification, and plerospheres, hollow particles formed in the same manner as cenospheres but containing small ash particles.
Chemical composition
The Si/Al ratio in raw materials is a determining factor in the type of zeolite formed, with the presence of other elements also influencing zeolite application. The results of quantitative chemical composition for major elements in CFA-UB (XRF) are shown in Table 1, expressed in the standard format (as oxides). Al and Si are the major elements, corresponding to approximately 89% of the material (expressed as Al2O3 and SiO2). It is important to
note that in fact these elements are present in the form of different minerals, for instance silicon is mainly present in quartz (SiO2) and in mullite (3Al2O3.2SiO2). Other relevant
constituents (> 1.5%) are calcium, iron and potassium. As a result of this composition, the ash is classified as sialic, with high alumina and silica contents and low levels of impurities such as Fe, Ca and S.22 According to
Bieseki et al.54 the presence of these compounds diminishes
the potential application of this material in zeolite synthesis. Other CFA with similar amounts of these components shows good conversion yields into zeolitic material.31
The Si/Al ratio obtained for CFA-UB (2.6) indicates the possibility of direct synthesis (one step) of the zeolites
Figure 2. SEM images showing the different morphologies identified
for the particles in CFA-UB ash (a and b), ranging from spherical (c) to differentiated morphology: (d) unburned coal; (e) amorphous particles that has suffered diffusion with other ash particles; (f) particle composed of magnetic iron oxide; (g) mineral particle exhibiting high Ti content, partially fused; (h) quartz; (i) mullite particle cluste.
Figure 3. SEM images and elemental composition (EDX) of the typical
amorphous aluminosilicate spheres: (a) cenosphere and (b) plerosphere.
Table 1. Average concentrations for major and minor elements in coal fly
ash from Candiota, obtained by different authors
Oxide This study (B)
Izidoro
et al.48
(m/m) /%
Depoi
et al.43
Pires and Querol44
Al2O3 22.45 22.90 20.10 38.40
CaO 1.85 2.40 1.00 1.10
Fe2O3 5.00 4.90 6.55 2.50
K2O 1.69 3.00 1.79 0.60
MgO 0.23 1.10 0.84 0.20
MnO 0.04 0.03 na 0.02
Na2O 0.48 1.30 0.31 0.04
P2O5 0.26 0.09 0.06 0.02
Rb2O 0.01 na na na
SiO2 66.47 62.40 67.20 56.70
SO3 0.64 0.50 0.31 0.20
SrO 0.02 na na na
TiO2 0.75 1.10 0.77 0.50
V2O5 0.12 na na na
ZnO 0.01 0.02 na na
ZrO2 0.04 na na na
SiO2/Al2O3 2.96 2.72 3.34 1.50
Si/Ala 2.61 2.40 2.95 1.30
LOIb 0.30 1.44 na na
with intermediate silica levels, such as Na-P1, whose Si/Al ratio is between 2 and 5 and has potential for a variety of applications. The ratio value points out to a predominance of silicon, suggesting the need to use an additional aluminum source to synthesize Linde Type A (LTA) zeolites, whose Si/Al molar ratio ca. 1.23,55
Table 1 also shows a comparison between the chemical composition (major and minor elements) results obtained in this study and those from the literature using the same CFA (UTPM-Candiota). In general, results are similar for most of the elements, with the exception of those found by Pires and Querol,44 who reported higher Al levels and
lower Si and Fe content. It is important to underscore that the studies cited do not indicate the exact origin (UTPM unit) of the ash studied, meaning the discrepancy in results may be related to the different origin of the ash studied by Pires and Querol.44
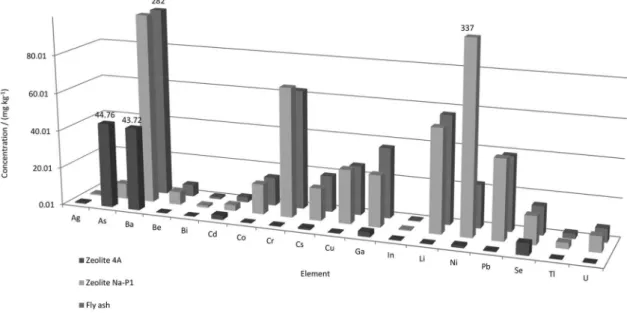
In order to conduct a detailed characterization of CFA-UB, the sample was digested and analyzed by ICP-MS for trace elements (Table 2). Elements present in higher concentrations were Ba, Cr, Li, Mn, Rb, Sr, V and Zn, with lower levels of As, Cu, Ga, Ni and Pb. These results were compared against two studies of CFA from UTPM-Candiota43,44 and are shown in Figure 4.
Comparisons were made based on the mean and standard deviation calculated for the concentration of each element in the three studies. In general, there were no discrepancies for most of the elements, with standard deviation lower than 30%. Exceptions are Ag, Cd and Se, with standard deviations greater than 50%; however, these elements are among those with the lowest concentrations, which may explain the greater inaccuracy of measurements. As previously discussed, the differences observed between the studies may also be associated with the different origins (UTPM Units) of the ash analyzed or the different quantification techniques employed (ICP-MS, inductively coupled plasma optical emission spectroscopy (ICP-OES), FAAS), which can influence the analytical quality of results.
Mineralogical characterization
Mineralogical characterization of ash provides information on the amorphous portion of crystalline phases, making it possible to predict the ease of dissolution of Al and Si during synthesis. Figure 5 shows the diffractogram obtained for CFA-UB. The most important crystalline phases identified were quartz (SiO2) and mullite
(3Al2O3.2SiO2), as well as small amounts of hematite
(Fe2O3). These results corroborate the data reported in the
literature,22 indicating the presence of only three crystalline
phases shown in the figure.
Table 2. Average concentrations for trace elements in coal fly ash
from Candiota. Results obtained by inductively coupled plasma mass spectrometry
Element CFA
a (B)
Average / (mg kg-1) SDc
Ag 0.85b 0.03
As 20.06 1.00
Ba 282.85 5.00
Be 6.22 0.80
Bi 1.10 0.010
Cd 2.71 0.10
Co 15.05 0.80
Cr 63.19 1.20
Cs 19.06 2.10
Cu 26.08 1.50
Ga 37.11 1.00
In 0.47 0.01
Li 57.17 1.30
Mn 376.00 1.40
Ni 22.77 1.70
Pb 39.12 1.40
Rb 95.00 0.90
Se 15.05 0.50
Sr 75.00 0.70
Tl 2.7 0.1
U 7.12 0.4
V 93 0.02
Zn 73 0.04
aCoal fly ash; bamount represents the mean of three triplicates (n = 3); cSD = standard deviation.
Figure 4. Average concentrations of trace elements in fly ash from the
Cardoso et al.22 estimated the amorphous portion of
Si and Al oxides in CFA-UB based on the concentration of these elements (XRF) and on the quartz and mullite content (XRD). The authors found high levels of amorphous material for both Si (81%) and Al (79%), favoring their dissolution in alkaline medium and thus the production of zeolites.
The detailed characterization of CFA-UB ash revealed favorable properties for its application in zeolite synthesis. In light of previous study22 on this same material, the ash
used here was not pre-treated. Possible contaminants, such as unburned carbon and iron, should not significantly affect the quality of the zeolites produced, particularly for the higher grade zeolite (4A) obtained in the second step of the integrated synthesis process.23
Zeolite characterization
Identification and purity of zeolite products
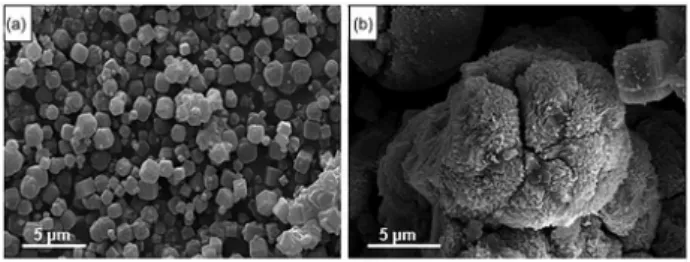
The morphology of the zeolites produced in each of the fifteen zeolitization tests was analyzed by SEM (Figure 6). In all samples, typical cubical structure, that may belong to zeolite A or zeolite X, were observed (Figure 6a).23,55,56 The
presence of zeolite X was also observed by XRD analysis (Figure S1), but in very low levels. For the second zeolite product investigated, SEM images (Figure 6b) illustrate first stage of zeolite Na-P1 formation over a partially activated CFA spheres. Other authors observed similar behavior in the synthesis of this same zeolite using CFA.22,57 The XRD
analysis (Supplementary Information section) confirmed the high purity of zeolite 4A produced (Figure S1), only with the presence of trace of zeolite X. On the other hand, the presence of unreacted quartz and mullite, originally present in the fly ash, was observed in the low grade Na-P1 zeolite diffractogram (Figure S2). This result could compromise the use of this zeolitic product in specific applications requiring less contamination.38-40
The CEC was tested with a view to exchanging the Na+
ions originally present in the zeolites for NH4+ and Ca2+ ions.
These ions were chosen for their easy exchangeability and selectivity for Na-P1 and 4A zeolites, respectively. CEC provides information on the maximum ion uptake capacity and selectivity of a mixture of ions per unit mass of the material. This is usually expressed as milliequivalents of ion X per unit mass of the zeolite (meq X g-1), where X can
represent different ions.58 For zeolite 4A an average CEC
of 5.3 ± 0.3 meq Ca2+ g-1 (n = 30) was obtained, an amount
close to that measured for the commercial zeolite of the same type (5.8 ± 0.2 meq g-1, n = 3). The second zeolite produced
(Na-P1) exhibited a CEC of 2.7 ± 0.3 meq g-1 (n = 30) for
NH4+, indicating lower purity compared to commercial
zeolite Na-P1 (4.6 ± 0.3 meq g-1, n = 3).
As previously discussed and confirmed by the above characterizations (SEM, CEC), the samples obtained in the 15 zeolitization tests exhibited very similar characteristics. As such, they were combined into two bulk samples (K-4A, E-Na-P1, Figure 1), which were used for quantification analysis (chemical composition).
Chemical composition
The characterization of the raw material used for zeolite synthesis revealed significant levels of several elements, some of which are highly toxic. In this respect, it is important to evaluate the behavior of these elements under the synthesis conditions used (moderate temperature and alkaline medium). In addition to Al and Si, other elements may also be mobilized in the zeolite structure. Table 3 and Figure 7 show the concentrations of major and minor elements (XRF) as well as trace elements (ICP-MS), respectively, in the produced zeolites.
As expected, the major elements present in both types of zeolites were Al and Si. Zeolite Na-P1, in turn, exhibited higher levels of Ca, Fe and K, indicating the presence of unreacted ash, confirming the results of SEM and CEC analyses. The Ca and Fe oxide levels in this zeolite are higher (3.92 and 12.20%) than those found in the ash (1.85 and 5.00%) (Table 1). This behavior suggests the enrichment of these elements during the first stage of synthesis due to their lower solubility when compared to Al and Si.
0 400 800 1200 1600 2000
5 15 25 35 45 55 65
I /
c
o
u
n
t
2 / degreeθ
M Q M M
Q
H M H
Q M M
Q Q
Q M Q
Figure 5. Diffractogram of Candiota coal fly ash (CFA-UB). M = mullite;
Q = quartz; and H = hematite.
Figure 6. SEM image of the typical morphologies observed in the two-step
Zeolite 4A showed higher Al and Na levels than zeolite Na-P1. This is attributed to the addition of an external Al source in alkaline medium during the second stage of synthesis.
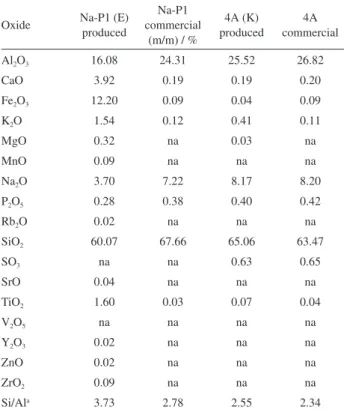
Table 3 also shows results for the composition of commercial zeolites with the same structure as that
of obtained zeolites in this study, but produced using conventional raw material (sodium aluminate and silicate). Similar compositions were observed for commercial and produced zeolites in terms of major structural elements (Al, Na and Si), primarily for zeolites 4A. Commercial zeolites also contain similar levels of minor elements (Ca, P and S), whereas K, Mg and Ti contents are higher in produced zeolite 4A. However, Fe levels were twice as high (0.09%) in commercial zeolite 4A. Thus, despite coming from waste, zeolite 4A produced in this study shows low levels of contamination, comparable to those of commercial zeolite produced from purer sources.
With respect to zeolites Na-P1, significant differences were observed for all the elements assessed. The high Ca, Fe and K contents suggest the presence of unreacted ash in produced zeolite Na-P1, substantiated by XRD analysis (Figure S2, Supplementary Information section). The Na content of this produced zeolite also demonstrates its low purity, which was twice as low as that of the commercial Na-P1 zeolite (7.22%). It is important to underscore that, despite being produced using conventional reagents (with low contaminant levels), several unexpected elements (Ca, Fe, K, P and Ti) were present in commercial zeolite Na-P1. The low concentrations of these elements are unlikely to compromise the use of this zeolite, but demonstrate the difficulty of producing the high purity zeolites required for certain applications (medical uses, food packaging, etc.).
Figure 7 shows the levels of trace elements for produced and commercial zeolites Na-P1 (Figure 7a) and 4A (Figure 7b). It can be observed that several elements were transferred from the ash (Table 2) to both of the produced zeolites. However, most of the elements were present at low levels (< 10 mg kg-1) in produced zeolite 4A, with
the exception of As (45 mg kg-1) and Ba (44 mg kg-1). On
the other hand, concentrations of most of the elements in produced zeolite Na-P1 were above 10 mg kg-1, particularly
Ni (337 mg kg-1), Ba (310 mg kg-1), Cr (68.1 mg kg-1) and Li
(54.5 mg kg-1). The significant enrichment of As (6 times) in
produced zeolite 4A, compared to produced zeolite Na-P1, was unexpected. This is worrying given the high toxicity of this element, suggesting the need for further investigation. As expected, significant differences were observed between commercial and produced zeolites Na-P1, with higher levels of most (ca. 70%) of the elements studied recorded in the produced zeolite. These findings reinforce the suggestion that some contaminants from the ash were incorporated during the first stage of the synthesis process. Zeolites 4A (commercial and produced) exhibited similar low levels of most of the elements, with the exception of higher As, Ba, and Se concentrations in the produced zeolite (10-60 times) and increased Ga, Cr, Cu and Li
Table 3. Average concentrations for major and minor elements in
commercial and produced zeolites. Results obtained by X-ray fluorescence
Oxide Na-P1 (E) produced
Na-P1 commercial
(m/m) / %
4A (K) produced
4A commercial
Al2O3 16.08 24.31 25.52 26.82
CaO 3.92 0.19 0.19 0.20
Fe2O3 12.20 0.09 0.04 0.09
K2O 1.54 0.12 0.41 0.11
MgO 0.32 na 0.03 na
MnO 0.09 na na na
Na2O 3.70 7.22 8.17 8.20
P2O5 0.28 0.38 0.40 0.42
Rb2O 0.02 na na na
SiO2 60.07 67.66 65.06 63.47
SO3 na na 0.63 0.65
SrO 0.04 na na na
TiO2 1.60 0.03 0.07 0.04
V2O5 na na na na
Y2O3 0.02 na na na
ZnO 0.02 na na na
ZrO2 0.09 na na na
Si/Ala 3.73 2.78 2.55 2.34
aMolar ratio; na = not analysed.
Figure 7. Average concentrations for trace elements in produced and
levels (3-15 times) in the commercial zeolite. These results corroborate previous data indicating the good quality of produced zeolite 4A.
As commented previously, the characterization of zeolites in terms of trace elements is relatively unexplored in the literature.45,59 Most studies60,61 investigate only the
main components (Al, Na and Si) of zeolite structure, with only a few45,47,48 also characterizing majority elements. The
presence of trace elements in zeolites obtained from CFA is even more unusual and only two studies were found.45,49
In one of these studies,45 the authors used fly ash from two
Italian power plants in conventional hydrothermal synthesis at low temperatures (25 to 60 °C). Mixtures of zeolites (type X, sodalite and ZK-5), geopolymers and unreacted ash were obtained. Twelve trace elements were quantified in the zeolites, with high concentrations of Ni, Cr, Pb, Cu and Co (200-50 mg kg-1). Direct comparisons between
these products and the produced zeolites in the present study should be made with caution given the differences in synthesis processes and the composition of ash used. However, the produced zeolite Na-P1 (obtained in our study) exhibits characteristics similar to those observed by the aforementioned authors, with similar or lower levels for most of the elements assessed (Figure 7). It is important to underscore that As levels (7-13 mg kg-1) obtained by
Belviso et al.45 were also significant in the zeolite products
when compared to produced zeolite 4A (44 mg kg-1).
Element distribution
Figure 8 shows the concentration of elements in the initial raw material (CFA-UB) and the two zeolites
produced. Zeolite synthesized in the first stage (Na-P1) retained most of the elements present in the ash. Levels of Ba, Be, Bi, Cd, Co, Cr, Cs, Cu, Ga, Li, Pb, Tl and U in this zeolite are close to those found in the initial ash, indicating high mobilization of these elements with the alkaline reagent used. These results further reinforce the low purity of zeolite Na-P1, since most of the contaminants present in the original ash remained in the zeolite product. The Ni content recorded in zeolite Na-P1 (337 mg kg-1)
was higher (ca. 15 times) than that present in the ash. It is possible that this element is enriched during this stage, considerably increasing its concentration, which did not occur in subsequent stages (zeolite 4A, washing water, synthesis effluent).
Zeolite 4A, in turn (Figure 8), retained a far lower amount of these elements compared to the initial concentrations in the ash. Only As (45 mg kg-1) exhibited
enrichment (2-fold). With respect to the highly toxic elements (As, Cr, Ni and Pb) present in the two zeolites, it is important that these be submitted to standard leaching tests to determine their possible mobility and, if necessary, propose a contaminant-free synthesis route for the safe application of these materials.
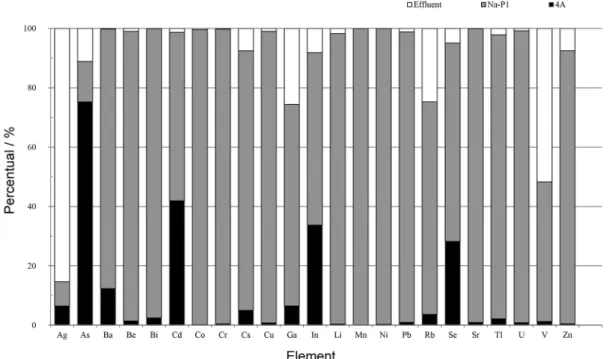
Figure 9 shows the percentage distribution of trace elements among the zeolite products and final effluent, demonstrating their significant concentration in zeolite Na-P1. Ba, Be, Bi, Co, Cr, Cs, Cu, Ga, Li, Mn, Ni, Pb, Rb, Sr, Tl, U and Zn were highly concentrated (> 75%) in this zeolite. Increased levels of As (75%), Cd (40%), In (35%) and Se (30%) were found in zeolite 4A, while Ag (85%) and V (55%) were transferred in greater volume to the final effluent.
The distribution of elements during zeolite synthesis using CFA is reported by Du Plessis et al.46 The authors
used South African fly ash for zeolite synthesis and, as occurred in our study (for the elements quantified in both works), reported that Mn, Mg, Ca, Ti, S, Ba, Ce, Co, Cu, Sr, Y and Zn present in the ash were fully incorporated into the zeolite formed (Na-P1). In this same study, toxic elements such as Pb, Hg, Al, As and Nb were found in the supernatant (synthesis effluent) and washing water, indicating the need for reuse or the appropriate treatment before disposal. Du Plessis et al.46 found that large amounts of the elements
comprising the basic structure (framework) of zeolites (Al, Na and Si) are wasted in the supernatant, indicating that the synthesis process can be improved to use these remaining components. In the present study, this realization prompted the reuse of the supernatant from the first stage (F), generating zeolite 4A and therefore improving the performance of the zeolitization process.
Characterization of washing waters and synthesis effluent
Two rinse cycles were applied to Na-P1 (wash C and D) and 4A (wash I and J). In addition to reducing zeolites residual alkalinity, the aim was also to simulate their behavior in more severe conditions (80 °C). The results obtained are shown in Table 4. For both zeolites, the highest concentrations observed in washing waters were for Al (0.31-3.87 mg L-1), Ca (0.25-3.0 mg L-1),
Fe (0.037-0.26 mg L-1), K (2.20-2.70 mg L-1) and
Na (41-149 mg L-1). Greater Al solubility was recorded for
both zeolites in the second rinse cycles (D and J). This is
likely because access to the zeolite structure is easier after the first wash, favoring the release of this element. The high Na content was expected due to the addition of NaOH during synthesis. Rinsing favors the release of sodium, thus reducing residual alkalinity and improving the exchange capacity of the material for future applications.
Du Plessis et al.46 investigated the distribution of
elements during zeolite synthesis and reported that, according to the mass balance, 42% of the initial quantity of Na was found in the washing water. Belviso et al.45
used the same rinse solution (at ambient temperature) employed in the present study and recorded concentrations of As, Cr, Cu, Mn, Pb, Se, V and Zn ranging from 0.0010 to 0.0203 mg L-1, similar to those obtained in the present
study (Table 4). Thus, results shown in Table 4 demonstrate the low solubility of the elements under these conditions. With respect to alkalinity (results not presented), two rinse cycles were needed to reduce this parameter to levels close to those obtained using similar commercial products (0.63% Na2O). It is important to note that,
despite submitting zeolites to temperatures higher than the average ambient temperature (25 oC), mobilization of
toxic elements was not significant. None of the elements exhibited concentrations higher than those stipulated under current legislation regarding effluent disposal62
(CONAMA 430/11, see Table 5), requiring only pH adjustment for their safe disposal. In addition, these results suggest that washing waters can be reused for additional synthesis, lowering the volume of effluents and costs associated with the process.
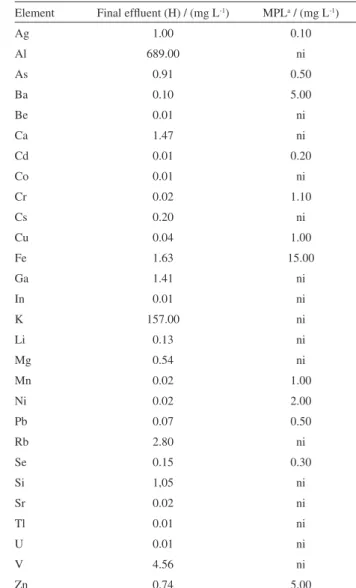
Table 5 shows the concentrations of elements in the final effluent (H) after synthesis of the second zeolite (4A). As expected, this effluent is rich primarily in Si, Al and K (1000-150 mg L-1), in addition to displaying a high Na
content (ca. 75 g L-1) due to the use of sodium hydroxide in
synthesis. Lower concentrations of Ag, As, Ca, Fe, Ga, Rb and V (5-1 mg L-1) were also observed. Given the recorded
levels of As (0.9 mg L-1) and Ag (1.0 mg L-1), the wastewater
must be treated, since both elements exceeded Brazilian discharge standards (As 0.5 mg L-1 and Ag 0.1 mg L-1).61
Moreover, in addition to containing residual Al and Si, the effluent also exhibited high pH (ca. 14) and Na content, which is relevant for its reuse in the synthesis process.
Conclusions
The results demonstrated that using coal fly ash for zeolite synthesis produced two types of zeolite products
with different purities. The first zeolite formed (Na-P1) contains most of the impurities present in the initial raw material. In this zeolite, levels of Ba, Be, Bi, Cd, Co, Cr, Cs, Cu, Ga, Li, Pb, Tl and U were close to the concentrations found in the original ash. The significant retention of these elements suggests high mobilization with the alkaline reagent used. The second zeolite (4A) exhibited high purity, with concentrations of most of the elements investigated close to those obtained for a commercial zeolite of the same type and obtained from pure reagents. The exception was As, whose concentration was twice as high as that found in the original ash. As with Ni in zeolite Na-P1, this element was significantly enriched. The presence of highly toxic elements (As, Cd, Cr, Ni and Pb) in both zeolites demonstrates the need to apply specific leaching
Table 4. Average concentrations for elements in washing waters from
integrated zeolite synthesis
Element Na-P1 wash
a / (mg L-1) 4A washa / (mg L-1)
1st step (C) 2nd step (D) 1st step (I) 2nd step (J)
Ag 0.002 0.009 0.011
Al 0.313 1.33 2.77 3.87
As 0.018 0.012 nd nd
Ba 0.014 0.016 0.002 0.004
Ca 0.25 0.60 3.00 2.20
Cr 0.010 0.002 nd nd
Cs 0.003 nd 0.001 nd
Cu 0.003 0.002 0.002 nd
Fe 0.260 0.210 0.192 0.037
Ga 0.009 0.005 nd nd
K 2.30 2.40 2.70 2.20
Li 0.020 0.012 0.001 nd
Mg 0.079 0.052 0.027 nd
Mn 0.004 0.002 nd nd
Na 145.00 149.00 141.00 41.00
Ni 0.003 0.001 0.004 nd
Pb 0.001 nd nd nd
Rb 0.054 0.009 0.010 0.003
Se 0.001 nd nd nd
Sr 0.002 0.001 0.001 nd
U 0.003 0.001 nd nd
V 0.057 0.003 nd nd
Zn 0.001 0.014 nd nd
aResults obtained by ICP-MS and FAAS for Al, Ca, K and Na; nd = not
detected.
Table 5. Average concentrations of elements in the final effluent and
maximum permissible limits (MPL) according to the Brazilian standarda
Element Final effluent (H) / (mg L-1) MPLa / (mg L-1)
Ag 1.00 0.10
Al 689.00 ni
As 0.91 0.50
Ba 0.10 5.00
Be 0.01 ni
Ca 1.47 ni
Cd 0.01 0.20
Co 0.01 ni
Cr 0.02 1.10
Cs 0.20 ni
Cu 0.04 1.00
Fe 1.63 15.00
Ga 1.41 ni
In 0.01 ni
K 157.00 ni
Li 0.13 ni
Mg 0.54 ni
Mn 0.02 1.00
Ni 0.02 2.00
Pb 0.07 0.50
Rb 2.80 ni
Se 0.15 0.30
Si 1,05 ni
Sr 0.02 ni
Tl 0.01 ni
U 0.01 ni
V 4.56 ni
Zn 0.74 5.00
aBrazilian wastewater discharge standards (CONAMA 430/2011);
tests in order to assess the possible migration of these elements and, if necessary, propose a contaminant-free synthesis route for the safe use of these materials in more important applications. Characterization of the washing waters indicated that, with the exception of Na (149 mg L-1),
the elements showed low solubility, making the reuse of washing waters relevant. However, in addition to containing residual Al and Si, synthesis effluent also displayed high pH (ca. 14) and elevated Na content (75 g L-1) as well as As
and Ag levels above those stipulated by current legislation governing wastewater disposal. These results suggest that wastewater treatment is necessary prior to disposal, given the high levels of As and Ag. However, the most appropriate solution would be to reuse this effluent to reduce its volume and lower the costs associated with synthesis, thus avoiding the need for additional treatment before disposal.
Supplementary Information
Supplementary information ( F i g u r e s S 1 - S 2 a n d Ta b l e s S 1 - S 2 ) is available free of charge at http://jbcs.sbq.org.br as a PDF file.
Acknowledgments
The authors thank CNPq for financial support and LabCEMM/PUCRS for microscopy analyses. M. P. thanks CNPq for research productivity grant. S. F. thanks FAPERGS/CAPES for post-doc grant. A. C. thanks FAPERGS for doctorate grant.
References
1. Ahmaruzzaman, M.; Prog. Energy Combust. Sci.2010, 36, 327. 2. Yao, Z. T.; Ji, X. S.; Sarker, P. K.; Tang, J. H.; Ge, L. Q.; Xia,
M. S.; Xi, Y. Q.; Earth-Sci. Rev. 2015, 141, 105. 3. Izquierdo, M.; Querol, X.; Int. J. Coal Geol. 2012,94, 54. 4. Medina, A.; Gamero, P.; Querol, X.; Moreno, N.; de León, B.;
Almanza, M.; Vargas, G.; Izquierdo, M.; Font, O.; J. Hazard. Mater.2010,181, 82.
5. Schobert, H. H.; Coal: The Energy Source of the Past and Future; American Chemical Society: Washington, DC, 1987. 6. Moreno, N.; Querol, X.; Andrés, J. M.; Stanton, K.; Towler, M.;
Nugteren, H.; Janssen-Jurkovicová, M.; Jones, R.; Fuel2005,
84, 1351.
7. Kalkreuth, W.; Levandowski, J.; Delgado, T.; Scheffer, R.; Maia, S. M.; Peralba, M. C. R.; Barrionuevo, S.; Energy Explor. Exploit.2014,32, 423.
8. Santana, E. R. R.; Sampaio, C. H.; Teixeira, E. C.; Andréani, P.-A.; Benezet, J.-C.; Adamie, P.; Benhassaine, A.; Schütz, R.;
Rev. Bras. Geocienc. 2011,41, 220.
9. Bertolini, T. C. R.; Izidoro, J. C.; Magdalena, C. P.; Fungaro, D. A.; Orbital: Electron. J. Chem. 2013, 5, 179.
10. Kalkreuth, W.; Holtz, M.; Kern, M.; Machado, G.; Mexias, A.; Silva, M. B.; Willett, J.; Finkelman, R.; Burger, H.; Int. J. Coal Geol.2006, 68, 79.
11. Querol, X.; Alastuey, A.; López-Soler, A.; Plana, F.; Andrés, J. M.; Juan, R.; Ferrer, P.; Ruiz, C. R.; Environ. Sci. Technol.
1997,31, 2527.
12. Luna, F. F.; Schuchardt, U.; Quim. Nova2001,24, 885. 13. Höller, H.; Wirsching, U.; Fortschr.Mineral. 1985, 63, 21. 14. Kato, Y.; Jpn. PIJP 61178416 A2 860811 1985.
15. Shigemoto, N.; Hayashi, H.; Miyaura, K.; J. Mater. Sci.1993,
28, 4781.
16. Shigemoto, N.; Sugiyama, S.; Hayashi, H.; J. Mater. Sci.1995,
30, 5777.
17. Steenbruggen, G.; Hollman, G. G.; J. Geochem. Explor.1998,
62, 1998.
18. Hollman, G. G.; Steenbruggen, G.; Janssen-Jurkovicova, M. A.; Fuel1999,78, 1225.
19. Wang, J.; Li, D.; Ju, F.; Han, L.; Chang, L.; Bao, W.; Fuel Process. Technol.2015, 136, 96.
20. Musyoka, M. M.; Petrik, L. F.; Fatoba, O. O.; Hums, E.; Miner. Eng.2013, 53,9.
21. Sommerville, R.; Blissett, R.; Rowson, N.; Blackburn, S.; Int. J. Miner. Process. 2013,124, 20.
22. Cardoso, A. M.; Paprocki, A.; Ferret, L. S.; Azevedo, C. M. N.; Pires, M.; Fuel2015, 139, 59.
23. Cardoso, A. M.; Horn, M. B.; Paprocki, A.; Ferret, L. S.; Azevedo, C. M. N.; Pires, M.; J. Hazard. Mater.2015, 287, 69.
24. Singer, A.; Berkgaut, V.; Environ. Sci. Technol.1995,29, 1748.
25. Gougazeh, M.; Buhl, J. C.; J. Assoc. Arab Univ. Basic Appl. Sci.2014,15, 35.
26. Hung, P. A.; Hai, N. X.; ARPN J. Agric. Biol. Sci.2013,8, 599. 27. Hildebrando, E. A.; Angélica, R. S.; Neves, R. F.;
Valenzuela-Diaz, F. R.; Ceramica (Sao Paulo, Braz.) 2012,58, 453. 28. Mignoni, M. L.; Petkowicz, D. I.; Fernandes Machado, N. R.
C.; Pergher, S. B. C.; Appl. Clay Sci.2008,41, 99.
29. Hartmann, A.; Petrov, V.; Buhl, J. C.; Rübner, K.; Lindemann, M.; Prinz, C.; Zimathies, A.; Adv. Chem. Eng. Sci.2014,4, 120. 30. Zhang, H.; Chu, L.; Xiao, L. O.; Zhu, L.; Yang, C.; Menga, X.;
Xiao, F.-S.; J. Mater. Chem.2013,1, 3254.
31. Wang, Y.; Guo, Y.; Yang, Z.; Cai, H.; Querol, X.; Sci. China, Ser. D: Earth Sci. 2003,46, 967.
32. Wang, S.; Soudi, M.; Li, L.; Zhu, Z. H.; J. Hazard. Mater. 2006,
133, 243.
33. Penilla, R. P.; Bustos, A. G.; Elizalbe, S. G.; Fuel 2006,85, 823.
35. Moreno, N.; Querol, X.; Ayora, C.; Alastuey, A.; Fernández-Pereira, C.; Janssen-Jurkovicová, M.; J. Environ. Eng. 2001,
127, 994.
36. Fungaro, D. A.; Izidoro, J. C.; Quim. Nova2006,29, 735. 37. Motsi, T.; Rowson, N. A.; Simmons, M. J. H.; Int. J. Miner.
Process. 2011, 101, 42.
38. Weckhuysen, B. M.; Yu, J.; Chem. Soc. Rev. 2015, 44, 7022. 39. Dogan, H.; Koral, M.; Inan, T. Y.; J. Plast. Film Sheeting2009,
25, 207.
40. Namekawa, K.; Schreiber, M. T.; Aoyagi, T.; Ebara, M.;
Biomater. Sci.2014, 2, 674.
41. Rayalu, S. S.; Udhoji, J. S.; Meshram, S. U.; Naidu, R. R.; Devotta, S.; Curr. Sci.2005,89, 2147.
42. Ajirloo, G. S.; Jadid, A. P.; Nasirtabrizi, M. H.; Mansoor, S. R.;
Tech.J. Eng. Appl. Sci.2013, 3, 970.
43. Depoi, F. S.; Pozebon, D.; Kalkreuth, W. D.; Int.J. Coal Geol.
2008,76, 227.
44. Pires, M.; Querol, X.; Int.J. Coal Geol.2004,60, 57. 45. Belviso, C.; Cavalcante, F.; di Gennaro, S.; Palma, A.; Ragone,
P.; Fiore, S.; Fuel 2015,144, 369.
46. du Plessis, P. W.; Ojumu, T. V.; Fatoba, O. O.; Akinyeye, R. O.; Petrik, L. F.; Materials 2014, 7, 3305.
47. Fungaro, D. A.; Magdalena, C. P.; Environ. Ecol. Res.2014, 2, 97.
48. Izidoro, J. C.; Fungaro, D. A.; dos Santos, F. S.; Wang, S.; Fuel Process. Technol.2012,97, 38.
49. Behin, J.; Bukhari, S. S.; Kazemian, H.; Rohani, S.; Fuel2016,
171, 195.
50. Yuan, R.; Li, D.-M.; Jiang, M.; Chin. J. Health Lab. Technol.
2015, 25, 650.
51. Bentlin, F. R. S.; Pozebon, D.; J. Braz. Chem. Soc.2010,21, 627.
52. ASTM D1426-08: Standard Test Methods for Ammonia Nitrogen in Water, ASTM: United States, 2008.
53. Gross, M.; Soulard, M.; Caullet, P.; Patarin, J.; Saude, I.;
Microporous Mesoporous Mater.2007,104, 67.
54. Vassilev, S. V.; Menendez, R.; Alvarez, D.; Diaz-Somoano, M.; Martinez-Tarazona, M. R.; Fuel2003,82, 1793.
55. Bieseki, L.; Penha, F. G.; Pergher, S. B. C.; Mater. Res. 2013,
16, 38.
56. Hui, K. S.; Chao, C. Y. H.; J. Hazard. Mater.2006,137, 401. 57. Querol, X.; Plana, F.; Alastuey, A.; López-Soler, A.; Fuel1997,
76, 793.
58. Inglezakis, V. J.; J. Colloid Interface Sci. 2005,281, 68. 59. Pickhardt, C.; Brenner, I. B.; Becker, J. S.; Dietze, H. J.;
Fresenius’ J. Anal. Chem. 2000,368, 79.
60. Novembre, D.; Sabatino, B. D.; Gimeno, D.; Clay Miner.2005,
53, 28.
61. Novembre, D.; Sabatino, B. D.; Gimeno, D.; Pace, C.; Clay Miner.2011,46, 339.
62. National Environmental Council (CONAMA); Resolução No. 430/2011, Dispõe Sobre Condições e Padrões de Lançamento de Efluentes, Complementa e Altera a Resolução No. 357, de 17 de Março de 2005, Publicação Diário Oficial da União No. 92, de 16/05/2011, pp. 89.
Submitted: January 8, 2016 Published online: March 29, 2016