Article
Printed in Brazil - ©2012 Sociedade Brasileira de Química0103 - 5053 $6.00+0.00
A
*e-mail: [email protected]
Determination of Bromine, Fluorine and Iodine in Mineral Supplements using
Pyrohydrolysis for Sample Preparation
Ticiane Taflik,a Fábio A. Duarte,b Éder L. M. Flores,c Fabiane G. Antes,a José N. G. Paniz,a Érico M. M. Floresa and Valderi L. Dressler*,a
aDepartamento de Química, Universidade Federal de Santa Maria,
97105-900 Santa Maria-RS, Brazil
bEscola de Química e Alimentos, Universidade Federal do Rio Grande,
96203-900 Rio Grande-RS, Brazil
cCoordenação de Engenharia de Alimentos, Universidade Tecnológica Federal do Paraná,
85884-000 Medianeira-PR, Brazil
Neste trabalho foi utilizada a piroidrólise para a decomposição de suplemento mineral utilizado na nutrição animal, para a posterior determinação de F, Br e I. Flúor foi determinado por potenciometria utilizando eletrodo íon-seletivo para fluoreto, enquanto que Br e I foram determinados por espectrometria de massa com plasma indutivamente acoplado. Os principais parâmetros que influenciam a piroidrólise foram investigados e, após a devida avaliação dos mesmos, foram fixadas as seguintes condições: a temperatura do reator em 1000 °C durante 10 min; a proporção entre a massa de amostra e a massa de acelerador em 1 + 5 e a vazão do gás carreador em 200 mL min-1. A exatidão do método foi avaliada usando teste de recuperação do analito e análise de materiais de referência certificados de rocha fosfática e de solo. O método foi aplicado para análise de suplemento mineral. Os limites de quantificação foram de 16, 0,3 e 0,07 µg g-1 para F, Br e I, respectivamente. Assim, usando-se um método relativamente simples e de baixo custo é possível a decomposição de até 5 amostras por hora. Portanto, a piroidrólise pode ser usada como um método de rotina para o preparo de amostra de suplemento mineral para a determinação de F, Br e I.
Pyrohydrolysis was employed for mineral supplements decomposition prior to F, Br and I determination. Fluoride determination was carried out by potentiometry using a fluoride-ion selective electrode, whereas Br and I were determined by inductively coupled plasma mass spectrometry. The main parameters that influence on pyrohydrolysis were investigated. After evaluation, the following conditions were established: reactor temperature of 1000 °C during 10 min; sample plus accelerator mass ratio of 1 + 5 and carrier gas (air) flow rate of 200 mL min -1. The accuracy of the proposed method was evaluated by analyte recovery tests and analysis of certified reference materials of phosphate rock and soil. Commercial mineral supplement samples were analyzed. The limits of quantification were 16, 0.3 and 0.07 µg g-1 for F, Br and I, respectively. By using a relatively simple and low cost pyrohydrolysis system up to 5 samples can be processed
per hour. The developed sample preparation procedure can be routinely employed for F, Br and I determination in mineral supplements.
Keywords: pyrohydrolysis, halogens determination, mineral supplement
Introduction
Several elements are essential for animals growing and breeding. Those elements required in high amounts are called macronutrients (Ca, Cl, K, P, Mg, Na, and S) and those elements required in low concentrations are
called micronutrients (Co, Cu, Fe, I, Mn, Mo, Se, Zn,
and eventually Cr and F are included in this group).1 The
main functions of essential elements in the organism are associated to the structural composition of body and enzymatic and hormonal processes.
Although F usually increases the strength of bones and
teeth, this element is generally not considered as essential.1
naturally found in phosphate rocks used in animal feed.2
Fluorine has an ambiguous effect on the animal health; while at low concentrations it prevents dental caries, at high concentration it can damage bones and even the teeth. Minor morphologic lesions were observed in young cattle receiving
20 mg kg-1 F per day. The maximum tolerable F content
was set to 40 mg kg-1. Bromine is a non-essential element
that is usually toxic to animals. The exposure to relatively high doses of Br may lead to liver and kidney injury within a short period. Low coordination and growth decrease of hepatic function and damages on intestine can be observed if animals are exposed to bromine compounds. Besides, bromine can be converted into bromide, which attacks the central nervous system when concentrations higher than 1
to 2 g day-1 are ingested.3 On the other hand, iodine is an
essential element for several animals, mainly for the synthesis of the thyroid hormones (thyroxine and triiodothyronine) that regulate metabolism. Because iodine is naturally found at low concentrations, the element supplementation
is recommended (0.4 to 1.3 mg day-1, the maximum is
10 mg day-1).4 Deleterious effect caused by iodine has been
reported in dairy cows that received 50 mg of iodine per day.5
Therefore, taking into account the adverse effects caused by Br, F, and I in animals, the concentration of these elements in mineral supplements have to be controlled.
Techniques such as spectrophotometry,6 potentiometry
using ion-selective electrode (ISE),7 ion chromatography,8,9
inductively coupled plasma optical emission spectrometry
(ICP OES),10,11 and inductively coupled plasma mass
spectrometry (ICP-MS)12-15 can be employed for Br, I
and F determination. Fluorine can also be determined by
graphite furnace molecular absorption spectrometry,16
ion chromatography10,17 and capillary electrophoresis.18 It
is worth citing that ICP-MS is a powerful technique for halogens determination (except for fluorine) due to the
high sensitivity observed.19 However, the high salt content
in mineral supplements used for animal nutrition causes serious interferences and, therefore, matrix separation is necessary.20,21
Sample preparation is usually the bottleneck in halogen determination by ICP-MS, due to memory effects caused
by high volatility of halogens in acidic solutions.22-24
Therefore, alkaline fusion,20 dilution or dispersion in
alkaline solution, distillation (for fluorine), combustion
in bombs,25 microwave-induced combustion (MIC)9,26-29
and pyrohydrolysis7,17,30-32 are used for sample preparation.
Pyrohydrolysis is a simple alternative for decomposition
of organic7,19,31,33 and inorganic34-36 materials when halogens
determination is intended. The main advantages are the possibility of matrix separation and the use of a diluted alkaline solution for analytes absorbing. Application of
pyrohydrolysis for analytical purposes was first investigated
by Warf et al.37 In their experiment, water steam passed over
a heated sample in a platinum assembly furnace was used. Volatile Cl and F species formed during pyrohydrolysis reaction were condensed and further determined by titration. The pyrohydrolysis reaction can be accelerated in presence of U, V, Al, and W oxides. The volatile halogen
species evolved can be simply condensed33,37 or collected
in alkaline solutions such as Na2CO3, Na2CO3/NaHCO3
and (NH4)2CO3. 24,31
The purpose of the present work was to develop a method for F, Br and I determination in mineral supplements using pyrohydrolysis for sample preparation. Pyrohydrolysis was investigated in view of the difficulties associated with F, Br and I determination in such complex matrix. The main features of the proposed method are the simplicity of sample preparation, low analyte losses and the relatively high sensitivity and sample throughput of ICP-MS for Br and I determination. Fluorine determination was performed by potentiometry because this element cannot be measured by ICP-MS.
Experimental
Pyrohydrolysis apparatus
The pyrohydrolysis apparatus employed is described
elsewhere,7,33 excepting the collector flask. In the
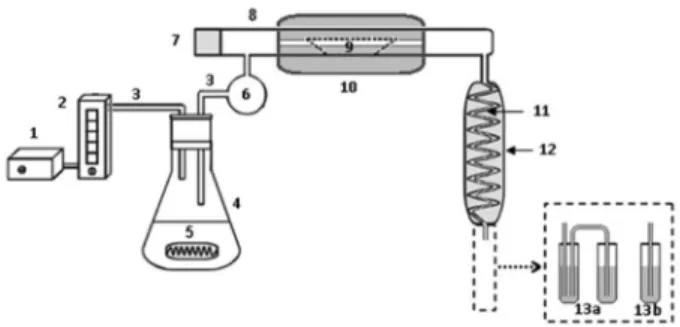
present work two flasks were used and connected by a polytetrafluoroethylene (PTFE) tube. The pyrohydrolysis apparatus employed is shown in Figure 1.
Briefly, the system (Figure 1) consists of a water vapour generator unit, an electrothermal furnace, a quartz tube used
Figure 1. Pyrohydrolysis apparatus used for preparation of mineral supplement samples prior to F, Br and I determination. 1) air pump; 2) flow meter (0.1 to 1.0 L min-1); 3) PTFE tubes (i.d. = 5 mm); 4) 500 mL
as reactor where a quartz holder for the sample is placed, a vapour condenser and a collector (one or two flasks) of the products from the pyrohydrolysis reaction. All parts of the system were interconnected with PTFE tubes. An air pump is used in order to force the water vapour through the reactor. The water trap, which is made of glass, avoids the introduction of water drops into the reactor. The condensed solution is collected separately: for F determination the vapour can be simply condensed using one flask, while for Br and I determination the vapour is condensed and trapped in an alkaline medium in two collection flasks connected in series. The determination of Br, F and I was carried out directly in the collected solution, with or without dilution.
Instrumentation
Bromide and I were determined using an inductively coupled plasma mass spectrometer (Perkin-Elmer-SCIEX, model Elan DRC II, Thornhill, Canada) equipped with a concentric nebulizer (Meinhard Associates, Golden, CO), a cyclonic spray chamber (Glass Expansion, Inc., West Melbourne, Australia), and a quartz torch with a quartz injector tube (2 mm i.d.). Instrumental performance optimization, including nebulizer gas flow rate and ion lens voltage, was performed following the instructions of the instrument manufacturer. Plasma was operated at 1300 W, while the flow rates of plasma gas, auxiliary
gas, and nebulizer gas were 15.0, 1.20, and 1.15 L min-1,
respectively. Argon of 99.996% purity (White Martins-Praxair, São Paulo, Brazil) was used. The monitored isotopes were 79Br, 81Br, and 129I.
Fluoride was determined using a potentiometer (model 781 pH/ion meter, Metrohm, Herisau, Switzerland) equipped with a fluoride ISE (model 6.0502.150, Metrohm). The method used for F determination is
described elsewhere.33
Reagents
All chemicals used were of analytical grade. Solutions were prepared using distilled/deionised water previously
purified in a Milli-Q system (18.2 MΩ cm, Millipore,
Billerica, MA, USA). Nitric acid (65% m/m) from Merck (Darmstadt, Germany) was doubly distillated in a quartz still (model duoPUR 2.01E, Milestone, Sorisole, Italy). A 10% (v/v) solution of this acid was used for vessel cleaning.
Vanadium pentoxide (V2O5) used as accelerator was
obtained by heating ammonium vanadate (NH4VO3 from
Merck) in a platinum crucible during 4 h at 550 °C.7
Total ionic strength adjustment buffer (TISAB) was prepared by mixing 58 g of sodium chloride (Merck), 4 g
of 1,2-cyclohexilenediaminetetraacetic acid (Merck) and 57 mL of acetic acid (Merck) in 500 mL of water. The pH of this solution was adjusted to 5.5 with a 10% (m/v) sodium hydroxide (Merck) solution. Then, the volume of the solution was completed to 1000 mL with water.
A stock solution of sodium carbonate/sodium bicarbonate was prepared by dissolution of 10.6 g of
Na2CO3 (Merck) and 10.6 g NaHCO3 (Merck) in water and
the volume completed to 1000 mL. Tetramethylammonium hydroxide (25% v/v from Sigma-Aldrich,) and 25% (v/v) ammonium hydroxide (Merck) were also evaluated to be used as absorbing solution for Br and I. All alkaline solutions were diluted as necessary for analyte collection or preparation of calibration solutions.
A 1000 mg L-1 F− solution was prepared in water (by
dilution of a Titrisol-Merck solution). Fluoride calibration
solutions ranging from 0.25 to 10.0 mg L-1 were prepared
in water, by serial dilutions of the 1000 mg L-1 F− stock
solution. In order to obtain the F− calibration curve,
equal volumes of each calibration solution and TISAB
were mixed. Stock solutions containing 1000 mg L-1
of Br−and I− were obtained from KBr (Merck) and KI
(Merck), respectively. Calibration solutions of Br− and
I−were prepared by serial dilution of the stock solution
in (NH4)2CO3/NH4HCO3 50 mmol L-1. The calibration
solutions were in the range of 1.0 to 20 mg L-1 for Br and
0.1 to 20 µg L-1 for I.
Samples
Four samples of mineral supplements (named as A, B, C, and D) were obtained in local market. Prior being submitted to pyrohydrolysis, all samples were ground in an agate mortar in order to obtain particle sizes lower than
100 µm. A certified sample of phosphate rock (IPT-18)
from Instituto de Pesquisas Tecnológicas (IPT), São Paulo, Brazil, and a certified soil (Montana Soil SRM 2711) from the National Institute of Standards and Technology (NIST, Gaithersburg, MD, USA) were used for accuracy evaluation.
Procedures
Aliquots of sample in the range of 30 to 150 mg and up to
450 mg of V2O5 were weighed in quartz holders. Sample A
100 to 600 mL min-1. For Br and Icollection, a solution
containing Na2CO3 and NaHCO3 with concentration
ranging from 0 to 50 mmol L-1 was used. In this case, it was
necessary to use two flasks containing absorbing solution (Figure 1(13a)); one with 5 mL and the other with 3 mL. After pyrohydrolysis reaction, the solutions collected in both flasks were mixed and the volume was completed to 15 mL using ultrapure water. For F determination, about 8 mL of water vapour were collected and the volume was completed to 10 mL using ultrapure water. An aliquot of 10 mL of TISAB was mixed with this solution before F determination. A blank sample was obtained by submitting
the sample holder containing V2O5 to the same conditions
used for the samples. All flasks used were thoroughly
washed with 10% (v/v) HNO3 and water prior use. Recovery
tests were carried out by spiking Br−, F− and I− to 50 mg of
samples A, B, C, and D.
Statistical analysis, including one-way analysis of variance (ANOVA), was performed using GraphPad InStat (GraphPad InStat Software Inc., Version 3.00, 1997) software. A significance level of 95% was used.
Results and Discussion
The influences of alkaline solution concentration used to collect Br and I species, vanadium pentoxide used as accelerator, sample mass, air flow rate through the reactor, temperature and reaction time were firstly studied.
Solution used for analyte collection
According to the literature, the F species (released from samples submitted to pyrohydrolysis) present in the water vapour can be just condensed and then
collected.7,33,37 However, alkaline solutions are necessary
for Br and I collection to avoid analyte losses and circumvent memory effects in their determination by ICP-MS. Therefore, solutions of tetramethylammonium hydroxide, ammonium hydroxide, and sodium carbonate/
sodium bicarbonate with concentrations up to 50 mmol L-1
were investigated for collecting the volatile Br and I species obtained from pyrohydrolysis. For comparison, the use of pure water was also evaluated. For these tests,
the mass of sample + mass of V2O5 (sample A was used
for these tests), air flow rate and reaction time were fixed
at 1 + 3, 300 mL min-1, and 10 min, respectively. The
results obtained showed that the best Br and I recoveries
were achieved using Na2CO3/NaHCO3 solution to
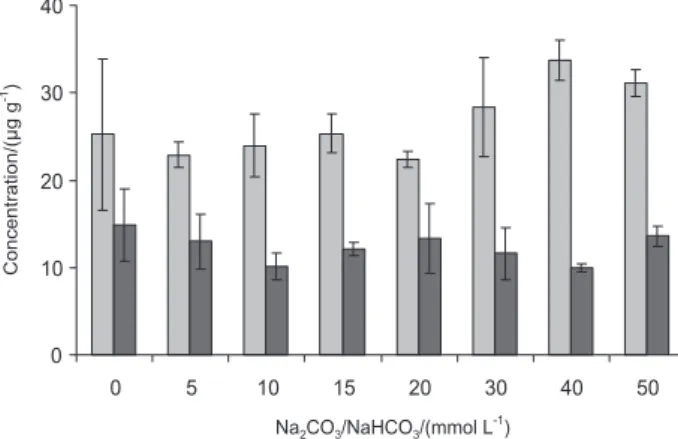
collect both elements. According to Figure 2, when the
concentration of the Na2CO3/NaHCO3 solution was higher
than 40 mmol L-1 the relative standard deviation for Br and
I decreased (RSD lower than 8%). For Br, recoveries close
to 100% were obtained using Na2CO3/NaHCO3 solutions
with concentration higher than 40 mmol L-1. For iodine,
no significant difference was found (one-way - ANOVA, P < 0.05) for all absorbing solutions investigated. Thus,
a 50 mmol L-1 Na
2CO3/NaHCO3 solution was used in
subsequent experiments. It is important to point out that in case of F none absorbing solution is necessary. Quantitative recoveries of this element were also obtained using all absorbing solutions evaluated for Br and I. In this sense, it is possible to suggest that if only F should be determined, pyrohydrolysis can be performed without using any absorbing solution. On the other hand, all
analytes can be determined by using a 50 mmol L-1
Na2CO3/NaHCO3 solution.
Influence of accelerator on analyte recoveries
According to early applications of pyrohydrolysis for analytical purposes, the reaction is faster in the presence
of certain oxides of U, W, Al and V.37 In the present work,
V2O5 was used due to its relatively low melting point
(about 750 °C) and suitability for different matrices. In order to evaluate the analytes release, 50 mg of the sample A were mixed with aliquots up to 450 mg of
V2O5 (up to 1 + 9). For these experiments, air flow rate,
reaction time and Na2CO3/NaHCO3 concentration were
300 mL min-1, 10 min and 50 mmol L-1, respectively.
It was observed that the precision improved with V2O5
amount increasing. Therefore, the sample + V2O5 mass
ratio was kept in 1 + 5 for subsequent experiments. These results are in agreement with results obtained in previous
works.7,33 According to the literature, usually the use of
an accelerator is necessary for halogens release from
inorganic sample matrixes.7,24,33,36 However, for other
samples, like coal and petroleum coke, halogens are
released without any auxiliary reagent.19,33,38
Influence of air flow rate
Air saturated with water vapour was employed for analyte transport from the pyrohydrolysis reactor to the condenser. For these experiments, the reaction time,
sample mass + V2O5 mass proportion and Na2CO3/NaHCO3
concentration were set in 10 min, 1 + 5, and 50 mmol L-1,
respectively. Air flow rates from 100 to 600 mL-1 were
evaluated and no significant difference was found for F and I (one-way - ANOVA, P < 0.05). In the case of Br, the
results obtained for air flow rate higher than 200 mL min-1
were statistically different (one-way - ANOVA, P < 0.05). The volume of water that passes through the pyrohydrolysis unit is dependent on the air flow rate. Thus, the water vapour volume increase with the air flow rate increasing. As a consequence a more diluted solution is produced, worsening the limit of detection (LOD). Therefore, the air
flow rate selected was 200 mL min-1.
Influence of temperature and reaction time
The presence of V2O5, appropriate temperature and time
of heating were mandatory for achieving good accuracy and precision. The temperature inside the reactor was varied from 700 to 1100 °C and it was verified that both precision and accuracy were better for 1000 °C. The temperature was gradually increased until the fusion of the mixture sample + accelerator was completed, which occurred at 750 °C and after 2 min of heating at this temperature. Then, the temperature was increased up to 1000 °C. For
these experiments, the air flow rate, sample mass + V2O5
mass proportion and Na2CO3/NaHCO3 concentration
were 200 mL min-1, 1 + 5 and 50 mmol L-1, respectively.
The results obtained are shown in Figure 3. In case of Br, no significant differences were found for reaction time up to 10 min (one-way - ANOVA, P < 0.05). For iodine, significant difference was found for reaction time up to 7.5 min (one-way - ANOVA, P < 0.05). Higher iodine concentration was found for 2.5 min of reaction but the precision was worst. For fluorine, no significant difference was found (one-way - ANOVA, P < 0.05) in all tests. Therefore, 10 min was established for further studies. It is important to mention that the pyrohydrolysis time must be enough for complete halogens release from sample matrix and to wash out the system in order to carry the analytes from reactor, capillaries and condenser to the collection flask. Therefore the time necessary for pyrohydrolysis can change according to sample matrix, analyte concentration and also the characteristics of the pyrohydrolysis system
employed.17,19,32,37,39 In comparison with other sample
preparation techniques10,20,25 for subsequent halogens
determination, the pyrohydrolysis method proposed in this work can be considered relatively fast because up to 5 samples can be decomposed in 1 h.
Sample analysis, precision and accuracy
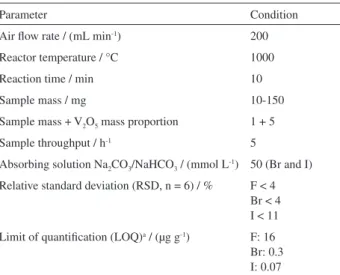
The characteristics of the proposed pyrohydrolysis method, for sample preparation and determination of F, Br and I are shown in Table 1.
The limit of quantification (LOQ) of F was calculated considering the lower Nernstian response of the ISE
electrode (0.15 mg L-1 of F−), the sample amount (50 mg)
and the final dilution of the sample solution (10 mL). Although the sample mass employed ranged from 10 to 150 mg, it is possible to use higher amount of sample that improves the LOQ. The LOQs of Br and I were calculated
according to the 3σ criterion. The use of 50 mg of sample
Figure 3. Influence of reaction time on analyte recovery. F (¢), Br (¢) and I (¢); error bars represents the standard deviation, n = 5.
Table 1. Characteristics of the developed pyrohydrolysis method for mineral supplement preparation prior to F, Br and I determination
Parameter Condition
Air flow rate / (mL min-1) 200
Reactor temperature / °C 1000
Reaction time / min 10
Sample mass / mg 10-150
Sample mass + V2O5 mass proportion 1 + 5
Sample throughput / h-1 5
Absorbing solution Na2CO3/NaHCO3 / (mmol L-1) 50 (Br and I)
Relative standard deviation (RSD, n = 6) / % F < 4 Br < 4 I < 11
Limit of quantification (LOQ)a / (µg g-1) F: 16
Br: 0.3 I: 0.07
aLOQ calculated for 50 mg of sample in 10 mL of solution for F (using
and a final volume of 15 mL were also taken into account for the LOQs calculation. The LOQs of F, Br and I achieved by using ISE and ICP-MS were sufficiently low for these elements quantification in the analyzed samples.
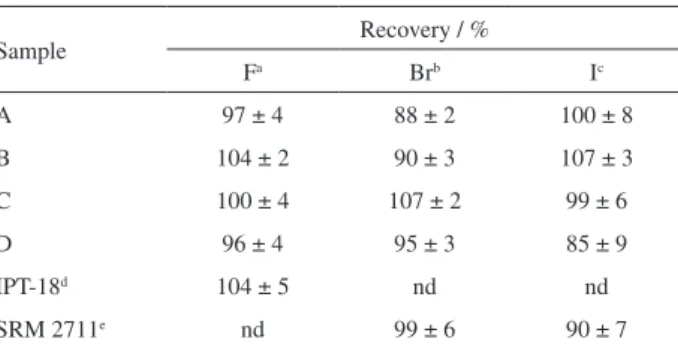
Memory effects of Br and I in ICP-MS are usually observed when using pneumatic nebulization. However, the accuracy and precision achieved were good. This was mainly due to the use of alkaline solutions for calibration and as absorbing solution in pyrohydrolysis. The precision, expressed as the relative standard deviation (RSD) was better than 11% for all analytes. No certified reference materials with similar matrix of the analyzed samples were available. Therefore, the accuracy was checked by analyte recovery tests and analysis of certified phosphate rock and certified soil. Accuracy was better than 85%, as shown in Table 2. It is important to mention that, although the matrix of certified reference materials used was not the same as the sample matrix, mineral supplements are prepared from phosphate rocks, which enable to suppose that this matrix is similar to sample matrix. The sample throughput
is 5 samples per hour, which is good if one consider the
difficulties related to the determination of F, Br and I in mineral supplement. In addition, pyrohydrolysis is easy to be implemented and no toxic waste is generated.
After establishing the most important parameters of the developed method, it was applied to analysis of commercial mineral supplement samples used for animal nutrition. Fluorine determination in all samples was carried out using potentiometry with ISE, while Br and I were determined by ICP-MS. The results are shown in Table 3 where it can be observed that F concentrations in samples A, B, C, and D
are relatively high (ranging from 600 to 1100 µg g-1). This is
attributed either to the addition of F to the supplement formula or to the fact that F is naturally present in the phosphate rock
used in formulation of the mineral supplements.40 Bromide
concentrations found were similar for all samples (26 to
31 µg g-1). The mineral supplement producer did not inform
the Br concentration but it was lower than the maximum concentration allowed. Iodide concentrations found in all samples were lower than the concentrations given by the
producer (between 14 and 77 µg g-1), but it was in agreement
with the legislation.4 In general, the concentrations of F
and I determined after decomposition using pyrohydrolysis were different of those informed by the mineral supplements producer. However, it is not possible to suggest the reasons for the differences found. The producer does not inform which method was used to determine the concentrations of the investigated elements.
According to the Brazilian legislation, Br, F and I concentrations found are in agreement and the mineral supplements could be given to animals.
In general, the determination of halogens in mineral supplement is challenging due to matrix complexity mainly the high concentration of salts, contamination and risk of analyte losses by volatilization during sample preparation (even using closed vessels). In this sense, the main drawback related to digestion methods is the high concentration of acid in the final solution. For halogens determination using ISE and ICP-MS techniques the pH of the solution must be 5.5 or higher. Fusion methods would increase matrix complexity due to the presence of additional electrolytes. The relatively high concentration of salts in the final solution can interfere in ICP-MS determinations. Pyrohydrolysis is more feasible because a diluted alkaline solution can be used for analytes collection and the analytes
Table 2. Recoveries of F, Br and I in spiked samples and in reference materials (mean ± standard deviation, n = 6)
Sample Recovery / %
Fa Brb Ic
A 97 ± 4 88 ± 2 100 ± 8
B 104 ± 2 90 ± 3 107 ± 3
C 100 ± 4 107 ± 2 99 ± 6
D 96 ± 4 95 ± 3 85 ± 9
IPT-18d 104 ± 5 nd nd
SRM 2711e nd 99 ± 6 90 ± 7
nd = not determined; aaddition of F solution in order to obtain 10 mg L-1 F
in the final solution after pyrohydrolysis; baddition of Br solution in order
to obtain 100 µg L-1 Br in the final solution after pyrohydrolysis; caddition
of I solution in order to obtain 50, 100 and 150 µg L-1 I in the final solution
of samples A and D, sample B, and sample C, respectively; dcertified
value: 1.35 ± 0.13% of F−; einformed values: 5.0 µg g-1 Br and 3.0 µg g-1 I.
Table 3. Determination of F, Br and I in commercial mineral supplement (mean ± standard deviation, n = 6)
Samples Informed values / (µg g
-1)a Determined values / (µg g-1)
F Br I F Br I
A 757 ni 40 1077 ± 79 26.7 ± 0.7 14.7 ± 1.7
B 900 ni 75 601 ± 5 26.9 ± 0.9 44.7 ± 4.7
C 800 ni 77 900 ± 51 30.4 ± 1.2 10.5 ± 0.8
D 800 ni 75 1049 ± 102 26.4 ± 2.2 57.6 ± 4.3
are separated from the sample matrix. Additionally, the pyrohydrolysis apparatus is of low cost and the method can be easily implemented in laboratories. The LOQ and the accuracy are good.
Conclusions
The results obtained demonstrated that pyrohydrolysis is feasible for preparation of samples of mineral supplements used in animal nutrition prior to F, Br and I determination. The main advantage is that the analytes are separated from sample matrix, avoiding interferences during the determination step, especially when ICP-MS is used. Only water (in case of fluorine) or a diluted alkaline solution is used for absorbing all analytes. The pyrohydrolysis method is fast, its implementation is relatively easy and of low cost. The method is attractive since concentrated acids and
toxic reagents are not used. The use of V2O5 and Na2CO3/
NaHCO3 solution is inexpensive and without toxicity. Blank
signals are low, which improves the LODs.
Acknowledgments
The authors are grateful to Conselho Nacional de Desenvolvimento Científico e Tecnológico (CNPq) and Coordenação de Aperfeiçoamento de Pessoal de Nível Superior (CAPES) for supporting this study.
References
1. Agency for Toxic Substances and Diseases Registry (ATSDR); Toxicological Profile for Fluorine, Hydrogen Fluoride and
Fluorides, Atlanta, 2003.
2. Larsen, S.; Widdowso, A. E.; J. Soil Sci.1971, 22, 210. 3. Agency for Toxic Substances and Disease Registry
(ATSDR); Toxicological Profile for Bromoform and Dibromochloromethane, Atlanta, 2005.
4. National Research Council (NRC); Nutrient Requirements of Dairy Cattle, 7th ed., Washington, 2001.
5. Olson, W. G.; Stevens, J. B.; Anderson, J.; Haggard, D. W.; J. Am. Vet. Assoc.1984, 184, 179.
6. Wu, D.; Deng, H.; Wang, W.; Xiao, H.; Anal. Chim. Acta2007, 601, 183.
7. Dressler, V. L.; Pozebon, D.; Flores, E. L. M.; Paniz, J. N. G.; Flores, E. M. M.; Anal. Chim. Acta2002, 466, 117.
8. Moraes, D. P.; Pereira, J. S. F.; Diehl, L. O.; Mesko, M. F.; Dressler, V. L.; Paniz, J. N. G.; Knapp, G.; Flores, E. M. M.; Anal. Bioanal. Chem.2010, 397, 563.
9. Pereira, J. S. F.; Diehl, L. O.; Duarte, F. A.; Santos, M. F. P.; Guimaraes, R. C. L.; Dressler, V. L.; Flores, E. M. M.; J. Chromatogr., A2008, 1213, 249.
10. Flores, E. M. M.; Mesko, M. F.; Moraes, D. P.; Pereira, J. S. F.; Mello, P. A.; Barin, J. S.; Knapp, G.; Anal. Chem.2008, 80, 1865.
11. Naozuka, J.; Veiga, M.; Oliveira, P. V.; Oliveira, E.; J. Anal. At. Spectrom.2003, 18, 917.
12. Mesko, M. F.; Mello, P. A.; Bizzi, C. A.; Dressler, V. L.; Knapp, G.; Flores, E. M. M.; Anal. Bioanal. Chem.2010, 398, 1125.
13. Romaris-Hortas, V.; Moreda-Pineiro, A.; Bermejo-Barrera, P.; Talanta2009, 79, 947.
14. Pereira, J. S. F.; Antes, F. G.; Diehl, L. O.; Knorr, C. L.; Mortari, S. R.; Dressler, V. L.; Flores, E. M. M.; J. Anal. At. Spectrom.2010, 25, 1268.
15. Gelinas, Y.; Iyengar, G. V.; Barnes, R. M.; Fresenius J. Anal. Chem.1998, 362, 483.
16. Flores, E. L. M.; Barin, J. S.; Flores, E. M. M.; Dressler, V. L.; Spectrochim. Acta, Part B 2007, 62, 918.
17. Conrad, V. B.; Brownlee, W. D.; Anal. Chem.1988, 60, 365. 18. Wang, T. L.; Li, S. F. Y.; J. Chromatogr., A1997, 781, 457. 19. Antes, F. G.; Duarte, F. A.; Flores, E. L. M.; Paniz, J. N. G.;
Flores, E. M. M.; Dressler, V. L.; Quim. Nova2010, 33, 1130. 20. Anazawa, K.; Tomiyasu, T.; Sakamoto, H.; Anal. Sci.2001, 17,
217.
21. Pozebon, D.; Dressler, V. L.; Curtius, A. J.; Anal. Chim. Acta 2001, 438, 215.
22. Fecher, P. A.; Nagengast, A.; J. Anal. At. Spectrom.1994, 9, 1021.
23. Knapp, G.; Maichin, B.; Fecher, P.; Hasse, S.; Schramel, P.; Fresenius J. Anal. Chem.1998, 362, 508.
24. Langenauer, M.; Krahenbuhl, U.; Furrer, V.; Wyttenbach, A.; Geostandard Newsletter1992, 16, 41.
25. Souza, G. B.; Carrilho, E. N. V. M.; Oliveira, C. V.; Nogueira, A. R. A.; Nobrega, J. A.; Spectrochim. Acta, Part B2002, 57, 2195.
26. Antes, F. G.; Duarte, F. A.; Mesko, M. F.; Nunes, M. A. G.; Pereira, V. A.; Müller, E. I.; Dressler, V. L.; Flores, E. M. M.; Talanta2010, 83, 364.
27. Duarte, F. A.; Pereira, J. S. F.; Barin, J. S.; Mesko, M. F.; Dressler, V. L.; Flores, E. M. M.; Knapp, G.; J. Anal. At. Spectrom.2009, 24, 224.
28. Pereira, J. S. F.; Mello, P. A.; Duarte, F. A.; Santos, M. d. F. P.; Guimaraes, R. C. L.; Knapp, G.; Dressler, V. L.; Flores, E. M. M.; Energy Fuel2009, 23, 6015.
29. Pereira, J. S. F.; Mello, P. A.; Moraes, D. P.; Duarte, F. A.; Dressler, V. L.; Knapp, G.; Flores, E. M. M.; Spectrochim. Acta, Part B2009, 64, 554.
30. Filappi, A. R.; Prestes, D. S.; Antes, F. G.; Flores, E. L. M.; Dressler, V. L.; Flores, E. M. M.; Cecim, M.; Pesq. Vet. Bras. 2008, 28, 124.
32. Antes, F. G.; Duarte, F. A.; Paniz, J. N. G.; Santos, M. d. F. P.; Guimaraes, R. C. L.; Flores, E. M. M.; Dressler, V. L.; At. Spectrosc.2008, 29, 157.
33. Dressler, V. L.; Pozebon, D.; Flores, E. L. M.; Paniz, J. N. G.; Flores, E. M. M.; J. Braz. Chem. Soc.2003, 14, 334.
34. Bonifacie, M.; Jendrzejewski, N.; Agrinier, P.; Coleman, M.; Pineau, F.; Javoy, M.; Chem. Geol.2007, 242, 187.
35. Fietzke, J.; Frische, M.; Hansteen, T. H.; Eisenhauer, A.; J. Anal. At. Spectrom.2008, 23, 769.
36. Muramatsu, Y.; Takada, Y.; Matsuzaki, H.; Yoshida, S.; Quat. Geochronol.2008, 3, 291.
37. Warf, J. C.; Cline, W. D.; Tevebaugh, R. D.; Anal. Chem.1954, 26, 342.
38. Antes, F. G.; Santos, M. F. P.; Guimaraes, R. C. L.; Paniz, J. N. G.; Flores, E. M. M.; Dressler, V. L.; Anal. Methods 2011, 3, 288.
39. Doolan, K. J.; Anal. Chim. Acta1987, 202, 61.
40. Marçal, W. S.; Gaste, L.; Carvalho, M. C.; Fortes, M. S.; Piola-Júnior, W.; Arq. Ciên. Vet. Zool. UNIPAR 2004, 7, 103.
Submitted: August 13, 2011