Article
Printed in Brazil - ©2012 Sociedade Brasileira de Química0103 - 5053 $6.00+0.00A
*e-mail: [email protected]
Electrospray Ionization Mass Spectrometry Fingerprinting of Extracts of the
Leaves of
Arrabidaea chica
Adriana L. Schiozer,a Elaine C. Cabral,b,c Luiz A. F. de Godoy,d Francisco C. M. Chaves,e
Ronei J. Poppi,a José M. Riveros,c Marcos N. Eberlinb and Lauro E. S. Barata*,a
aLaboratory of Natural Products and bThoMSon Mass Spectrometry Laboratory, Institute of Chemistry,
University of Campinas (Unicamp), CP 6154, 13083-970 Campinas-SP, Brazil
cInstitute of Chemistry, University of São Paulo (USP), CP 26077, 05513-970 São Paulo-SP, Brazil
dChemometric Laboratory in Analytical Chemistry, Institute of Chemistry, University of Campinas
(Unicamp), CP 6154, 13083-970 Campinas-SP, Brazil
eCentro de Pesquisa Agroflorestal da Amazônia Ocidental, Embrapa Amazônia Ocidental,
CP 319, 69010-970 Manaus-AM, Brazil
Arrabidaea chica (crajiru) é uma importante planta da Amazônia. Seus extratos são usados
como pigmento, agentes antimicrobianos e adstringentes. Três variedades diferentes desta espécie são cultivadas na região Amazônica. Neste trabalho, infusões diretas de extratos de A. chica destas
três variedade foram analisadas por impressão digital via espectrometria de massas com ionização por eletrospray (ESI(+)-MS). Dados derivados destes espectros foram classificados utilizando um
método de análise multivariada (PLS-DA, análise discriminante com calibração multivariada por mínimos quadrados parciais). O método direto aqui apresentado baseia-se na extração de folhas secas e em pó com uma solução de metanol/água acidificada sem manipulação adicional da amostra. A solução sobrenadante foi analisada através de infusão direta por ESI(+)-MS, o que resultou em perfis de composição para cada variedade. 3-Desoxiantocianidinas são importantes substâncias presentes na A. chica, seus íons foram usados como marcadores no tratamento de dados utilizando
PLS-DA, o que possibilitou a separação das três variedades. Impressão digital por ESI(+)-MS funciona como um método simples e rápido para diferenciação de variedades de A. chica.
Arrabidaea chica (crajiru) is an important Amazonian plant. Its extracts are used as red pigments,
antimicrobial agents and astringents. Three different varieties of this species are cultivated in the Amazon region. In this work, direct infusions of A. chica extracts from these three varieties were analyzed via electrospray ionization mass spectrometry (ESI(+)-MS) fingerprinting. Derived data from the spectra were classified by using a multivariate method (PLS-DA, partial least squares-discriminant analysis). The direct method that is herein presented relies on extraction of dry, powdered leaves with acidified methanol/water solution with no further sample preparation. The resulting supernatants were analyzed by direct infusion ESI(+)-MS, which provides characteristic fingerprints of the sample composition. 3-Deoxyanthocyanidins are important substances in A. chica, their ions were
used as markers in the PLS-DA data treatment. PLS-DA was able to differentiate the three varieties. ESI(+)-MS fingerprinting works as a simple and fast method to differentiate varieties of A. chica.
Keywords: Arrabidaea chica, crajiru, ESI-MS fingerprinting, 3-deoxyanthocyanidinins, multivariate analysis
Introduction
Arrabidaea chica (Humb. & Bonpl.) Verlot, Bignoniaceae, popularly known as crajiru, pariri, chica and puca panga,
among others, is distributed from Mexico to Argentina.1
Pharmacological activities of A. chica have been the subject of several puplications.4-12 Recently, the Ministry of
Health in Brazil expanded the number of medicinal plants of interest for use by the Unified Health System (Sistema Único de Saúde-SUS) in 2008. Among the approval of the seventy medicinal plants is A. chica, which requires its standardization.13
A. chica is easily cultivated and fast growing. In Amazonas State, the A. chica variety that predominates in the traditional use is known as variety I, according to the National Agricultural Research Corporation (Embrapa Amazonia Ocidental, Brazil). The leaves of this variety are thin and grow upwards, making A. chica suitable for cultivation in home gardens. Other varieties (designated as varieties II and III) have wider leaves with the tendency to grow horizontally (Figures S1 and S2 from Supplementary Information). The three varieties of A. chica have green coloration while fresh, but after drying they become brownish-red. The red nuance can be more evident if drying is performed under the sunlight. This happens due to the natural oxidation of components that are present in the plant. The use of the extract of the A. chica leaves was first reported by the Indians from regions of Colombia and Venezuela as a natural pigment known as “chica red”. The pigment had high commercial value in former times. Nowadays, several cosmetic products containing A. chica (as crajiru) are registered in the National Health Surveillance Agency (Anvisa, Brazil)14
and commercialized by cosmetic industries, mainly in the Northern part of Brazil. These products exploit the natural red-brown color of the extracts of the A. chica leaves, as well as their antimicrobial and astringent properties.
A. chica possess high anthocyanidin content, in particular 3-deoxyanthocyanidins which are responsible for the red coloration of the leaf extracts.
These include 6,7,4’-trihydroxy-5-methoxyflavylium (1,
carajurone),4,10 6,7-dihydroxy-5,4’-dimethoxyflavylium (2,
carajurin),4,8,10 6,7,3’,4’-tetrahydroxy-5-methoxyflavylium
(3)4,10 and 6,7,3’-trihydroxy-5,4’-dimethoxyflavylium
ions (4)4 (Table S1). To our knowledge, compounds 1-4
have only been isolated from A. chica, making them quite specific marker substances and useful for fingerprint characterization for this plant species.
Electrospray ionization mass spectrometry (ESI-MS) fingerprinting has been demonstrated to offer a very fast and versatile technique for the screening of polar mixtures of organic and inorganic compounds of plant origin. For example, this technique has been applied to the analyses of propolis,15 whisky,16 beer17 and essential oils,18 to differentiate
levels of ripeness of fruits, as well as their post harvesting processes,19 and for quality control and adulteration of
perfumes and vegetable oils.20-22 This technique employs
little sample preparation, yields immediate compositional information on the most ESI ionizable compounds through direct infusion and allows the identification of characteristic marker compounds in extracts.
PLS-DA (partial least squares-discriminant analysis) is a multivariate method that is employed to classify samples in classes. This classification models the relationship between two matrices, one containing the instrumental answers and another containing the class affiliation for each sample. The algorithm decomposes the two matrices using a determined number of latent variables such that the maximum separation among classes is obtained.23,24
In this work, the leaf extracts of the three different varieties of A. chica, which are cultivated by Embrapa Amazonia Ocidental, were characterized using ESI-MS fingerprinting. ESI-MS data were collected during the rainy and dry seasons and at three different times throughout the day to investigate the compositional variation within these varieties.25 The ESI-MS data were treated using PLS-DA to
investigate whether ESI-MS would differentiate the three A. chica varieties. The aim of this work was therefore to develop ESI-MS coupled to PLS-DA as a simple yet reliable technique to distinguish these three Amazonian varieties of A. chica via the analysis of leaf extracts. Another purpose of this work was to investigate whether 3-deoxyanthocyanidins
1-4, which so far have been found only in A. chica, could be
used to differentiate varieties I-III.
Experimental
Plant material
For this study, three varieties of A. chica were used. They are designated by the Amazon population as varieties I (ACI), II (ACII) and III (ACIII) (Figure S1 and Figure S2). They are continuously cultivated at Embrapa Amazonia Ocidental which is located in Manaus City, Amazonas State in the central Amazon region (Brazil). Voucher specimens were deposited by Dr. Francisco Célio Maia Chaves at the EAFM Herbarium from Amazonas Federal Institute of Education, Science and Technology (IFAM-CMZL) in Manaus City. These voucher specimens received the access numbers: EAFM2900 (variety I), EAFM 2901 (variety II) and EAFM 2902 (variety III). Specimens were identified by Prof. Dr. Valdely Ferreira Kinupp as Arrabidaea chica (Humb. & Bonpl.) Verlot.
Sample preparation and extraction
seasons. These are the two main seasons in this part of the Amazon region, corresponding to the periods of December to May and June to November, respectively. They were also collected at three different periods of the day: early morning (M), midday (L) and late afternoon (A) (Table 1). After drying in an oven at 40 °C for 8 h, the leaves were milled to a fine powder and sieved using a 40 mesh sieve.
A 7% formic acid (Merck, Darmstadt, Germany) in deionized water and methanol (Tedia, Fairfield, OH, USA) (1:1) stock solution (200 mL) was prepared. Milled leaves (100 mg) of each of the samples (Table 1) were extracted with 1 mL of the above prepared solution in polypropylene microtubes (Eppendorf®). Each tube was agitated in a
Vortex mixer for 1 min and centrifuged for 1 min. Sample solutions were prepared by diluting an aliquot of 5 µL of the supernatant from each centrifuge tube in 0.5 mL of the formic acid/methanol/water solution. Sample solutions were analyzed by direct infusion into the mass spectrometer. The above extraction, dilution and analysis sequence were repeated (duplicate) for the 18 samples.
A Q-TOF mass spectrometer (Micromass, Manchester, UK) with an electrospray interface and running in the positive ion mode was used to perform ESI-MS and ESI-MS/MS analyses. The ion source unit was operated at a desolvation
temperature of 80 ºC, capillary voltage of 2.1 kV and cone voltage of 40 eV. Samples were directly infused at a rate of 200 nL min-1 into the ion source using a chip-based injector
(Triversa NanoMate, Advion BioSciences, Norfolk, UK). The spectra were acquired in the interval of 150 to 1000 m/z and accumulated for 60 s. ESI-MS/MS were obtained for the deoxyanthocyanidin ions using collision energies ranging from 15 to 35 eV. The collision gas pressure (argon) was optimized to produce extensive fragmentation of the ions under investigation.
ESI-MS data were analyzed using the PLS-DA algorithm (PLS-Toolbox 4.02, Eigenvector Technologies, Manson, WA, USA). Ions with intensity below 20% relative to the most abundant ion were neglected during data treatment. All calculations and graphs were generated on a MatLab 6.5 platform (MathWorks, Natick, MA, USA).
Results and Discussion
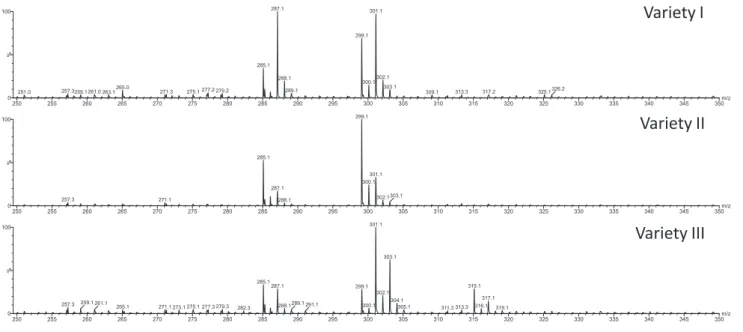
Ions of m/z 285, 299, 301 and 315 corresponding to 3-deoxyanthocyanidins 1-4, respectively, are the major
ions in positive mode ESI spectra in the three varieties of A. chica (Figure 1 and Table 2). The assignment of these ions to metabolites 1-4 was based on information from
the literature4,10 and on the ESI(+)-MS/MS fragmentation
analyses (Figure S3). These deoxyanthocyanidin ions exhibit as their main characteristics limited dissociation and analogous fragmentation patterns. The most prominent feature of this common fragmentation route is the primary loss of a methyl radical under higher collision energies and by occasional loss of CO.4,10
For a given variety of A. chica (I, II or III), little difference is perceivable in the mass spectra of extracts of the leaves that were harvested at three different times of day and in different seasons. Although all varieties display molecular cations of m/z 285, 299 and 301, these ions are sometimes of low intensity. For example, leaves of variety I exhibit a base ion of m/z 299 (50% of the twelve spectra) or 463 (50% of spectra), those of variety II always exhibit a base ion of m/z 299, whereas those of variety III display the ion of m/z 301 as the most abudant. Considering that the 20% lowest relative abundance ions were neglected, the mass spectra of the three varieties differ in the relative abundances and proportions of these three molecular cations. The molecular cation of m/z 315 (which corresponds to 4) is only present in the ESI spectra of the
leaves of variety III, independent of the season or time of day of sample collection. Therefore, the presence of this ion appears as a marker for variety III.
Analysis of the MS spectra of the three varieties of A. chica revealed that 101 signals remained after
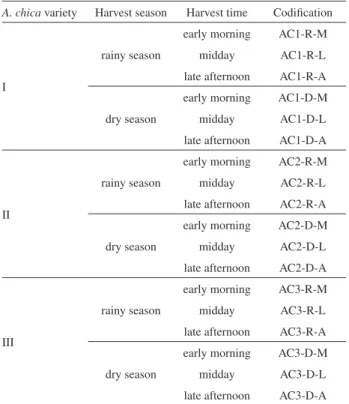
Table 1. Analyzed samples, all samples were extracted and analyzed
in triplicate, the first analyzed set received code ‘a’ at the end of the codification, second set received a ‘b’ and third set received a ‘c’, as AC1-R-Ma, AC1-R-Mb and AC1-R-Mc, respectively
A. chica variety Harvest season Harvest time Codification
I
rainy season
early morning AC1-R-M
midday AC1-R-L
late afternoon AC1-R-A
dry season
early morning AC1-D-M
midday AC1-D-L
late afternoon AC1-D-A
II
rainy season
early morning AC2-R-M
midday AC2-R-L
late afternoon AC2-R-A
dry season
early morning AC2-D-M
midday AC2-D-L
late afternoon AC2-D-A
III
rainy season
early morning AC3-R-M
midday AC3-R-L
late afternoon AC3-R-A
dry season
early morning AC3-D-M
midday AC3-D-L
Table 2. Mass spectral signal intensity data for A. chica extracts harvested at different times of day and different seasons
m/z
Relative mass spectral signal intensities
Variety I Variety II Variety III
Range Avg SD Range Avg SD Range Avg SD
158.1 0.0-12.8 4.6 5.1 0.0 0.0 0.0 0.0 0.0 0.0
160.1 0.0-13.2 9.3 4.6 0.0-12.6 8.9 3.3 10.3-18.7 13.7 2.2
164.1 0.0 0.0 0.0 0.0-6.4 1.5 2.7 8.1-16.6 11.2 2.2
203.1 0.0-6.0 0.5 1.7 0.0-7.3 2.5 2.5 0.0-6.7 2.8 2.6
243.1 0.0-3.6 0.3 1.0 0.0-5.0 1.1 1.7 0.0-4.9 0.9 1.6
271.1 0.0-5.6 1.5 2.2 0.0-4.5 1.4 1.6 0.0-4.1 0.8 1.6
285.1 0.0-24.3 11.1 9.0 12.6-20.2 15.6 2.3 0.0-8.6 5.8 2.1
287.1 0.0-15.2 9.0 6.7 0.0 0.0 0.0 0.0-20.5 6.0 6.0
299.1 4.8-38.6 17.7 12.0 31.4-40.5 35.2 2.6 0.0-11.0 3.2 4.2
301.1 0.0-14.4 6.6 6.9 0.0 0.0 0.0 0.0-21.7 15.0 6.1
303.1 0.0-3.1 0.8 1.2 0.0-2.8 1.9 0.9 0.0-11.1 2.9 4.5
315.1 0.0 0.0 0.0 0.0 0.0 0.0 0.0-7.7 5.0 2.0
317.1 0.0-2.7 0.8 1.2 0.0-2.2 1.1 0.9 0.0-3.6 0.6 1.4
357.2 1.6-9.3 5.7 2.8 0.0-3.8 2.5 1.2 0.0 0.0 0.0
357.3 0.0 0.0 0.0 0.0 0.0 0.0 0.0-4.4 2.7 1.4
365.1 0.0 0.0 0.0 0.0-1.0 0.2 0.4 0.0-2.0 1.1 0.8
447.1 0.0-1.9 0.6 0.8 0.0-1.5 1.0 0.5 0.0-0.9 0.1 0.3
463.1 2.0-18.8 10.7 6.3 1.0-12.5 7.9 3.4 1.1-9.2 6.7 2.8
477.2 1.0-10.9 6.1 3.8 0.7-7.4 4.3 1.9 0.0-2.8 2.0 0.8
479.2 0.0 0.0 0.0 0.0 0.0 0.0 0.0-9.9 6.6 3.3
533.2 0.0-3.0 1.0 1.4 0.0-1.5 0.9 0.5 0.0-1.4 0.9 0.4
585.2 0.0-1.8 0.6 0.7 1-5.5 2.7 1.4 0.0-0.5 0.1 0.2
593.3 1.6-3.1 2.2 0.5 0.9-5.6 2.6 1.2 0.0-3.6 1.5 1.4
593.4 0.0 0.0 0.0 0.0 0.0 0.0 0.0-3.4 1.1 1.4
599.2 0.0-1.0 0.2 0.4 0.8-3.6 2.1 1.0 0.0-0.8 0.2 0.3
Avg and SD: average and standard deviation of mass spectral signal intensities, respectively; relative intensity data above are representative of each variety of A. chica independent of time of day and season of the collection; the data from the table were generated from Table S2 (Supplementary Information) excluding initial ions with intensity lower than 20% base peak intensity; remaining peak intensities were normalized and those ions having average relative intensities lower than 1% were also eliminated, with exception of ions corresponding to substances that were already isolated from A. chica (m/z 285, 299, 301 and 315, in bold text).
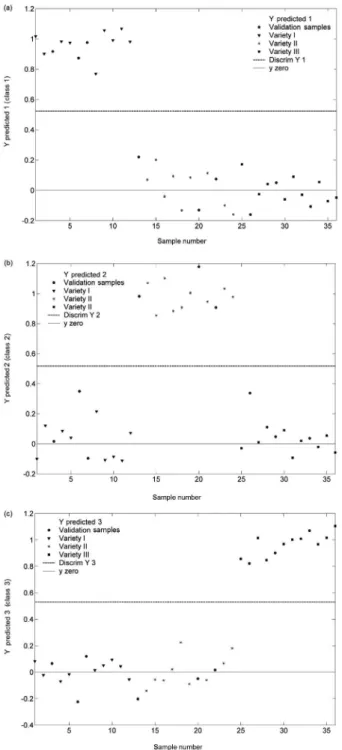
Figure 2. Plots generated using PLS-DA model and ESI(+)-MS data of the three varieties of A. chica: (a) samples from variety I falling in the line where Y is close to 1, (b) samples from variety II falling in the line where Y is close to 1 and (c) samples from variety III falling in the line where Y is close to 1.
elimination of the 20% least intense signals (Table S2). Of these 101 signals, those having low average relative intensities were further eliminated yielding the group of ions that are presented in Table 2. These 101 ions and their relative intensities were then subjected to the PLS-DA analysis. Out of the 3-deoxyanthocyanidins, it is possible to discern from Table 2the following patterns of
relative intense ions (m/z): 285, 299 and 301 for variety I, 285 and 299 for variety II and 285, 299, 301 and 315 for variety III. Average relative intensities lower than 1% were eliminated and are not in Table 2. The PLS-DA model was built in order to investigate whether the mass spectral data would differentiate and file the eighteen samples of the three varieties of A. chica in separate classes. The number of latent variables that were used in the models was chosen through cross-validation leave-one-out. The mass spectra were run in duplicate, and then organized so that samples 1-12 corresponded to variety I, samples 13-24 corresponded to variety II and samples 25-36 corresponded to variety III. Twenty-seven samples were selected for calibration, and three from each variety were used for validation: 3, 6 and 7 from variety I, 13, 20 and 22 from variety II and 26, 29 and 33 from variety III. The algorithm was applied using six latent variables and the data set was mean centered. Three plots were generated (Figure 2) for each class/variety. In these plots, samples that fell above the dashed line (Discrim Y) belonged to a given class, whereas samples that fell below the dashed line did not belong to that particular class. All calibration and validation samples were correctly classified as varieties I, II and III, this can be seen in Figure 1. In Figure 2a-c, samples from variety I fall in values of Y close to 1, while samples from varieties II and III fall in the line of Y close to 0.
According to the analyses of PLS-DA and other models, within a given variety of A. chica, there are no significant qualitative differences among the 3-deoxyanthocyanidin profiles from extracts corresponding to different harvest times and seasons (Table 1). This is an indication that variety is the most important aspect for defining the 3-deoxyanthocyanidin profile of A. chica.
Conclusions
ESI-MS data from leaf extracts that were treated by the PLS-DA model provide a simple and effective technique being able to classify the three varieties of A. chica. Seasonal and temporal effects seem not to affect the results.
Supplementary Information
Supplementary material (Figure S1-S3, Table S1-S2) is available free of charge at http://jbcs.sbq.org.br as PDF file.
Acknowledgements
References
1. Missouri Botanical Garden, http://www.tropicos.org accessed in June 2011.
2. Mors, W. B.; Rizzini, C. T.; Pereira, N. A.; DeFilipps R. A.; Medicinal Plants of Brazil; Reference Publications, Inc.: Algonac, MI, 2000, p. 501.
3. Duke, J.; Vasquez, R.; Amazonian Ethnobotanical Dictionary, 1st ed.; CRC-Press: Boca Raton, FL, 1994, p. 215.
4. Zorn, B.; Garcia-Pineres, A.; Castro, V.; Murillo, R.; Mora, G.; Merfort, I.; Phytochemistry2001, 56, 831.
5. Barata, L.; Schiozer, A.; Braga, A. M. P.; Schreiber, A. Z.; Lyra, L.; Br PI 0.600.943-3, 2006.
6. Barbosa, W. L. R.; Pinto, L. N.; Quignard, E.; Vieira, J. M. S; Silva Jr., J. O. C.; Albuquerque, S.; Bras. J. Pharmacogn.2008, 18, 544.
7. Jorge, M. P.; Madjarof, C.; Ruiz, A. L. T. R.; Fernandes, A. T.; Sousa, I. M. O.; Foglio, M. A.; Carvalho, J. E.; J. Ethnopharmacol. 2008, 118, 361.
8. Chapman, E.; Perkin, A. G.; Robinson, R.; J. Chem. Soc. 1927,
3015.
9. Pauly, M.; Pauly-Florentiny, M.; Moser, P.; WO Patent 052809,
2001.
10. Devia, B.; Llabres, G.; Wouters, G.; Dupont, L.; Phytochem. Anal.2002, 13, 114.
11. Schiozer, A. L.; Março, P. H.; Barata, L.E.S.; Poppi, R. J.; Anal. Lett. 2008, 41, 1592.
12. Barros, F. C. F.; Pohlit, A. M.; Chaves, F. C. M.; Rev. Bras. Plantas Med. 2008, 10, 38.
13. http://portal.saude.gov.br/portal/arquivos/pdf/RENISUS.pdf accessed in June 2010.
14. http://www7.anvisa.gov.br/datavisa/Notificado/notificado.asp accessed in June 2010.
15. Sawaya, A. C. H. F.; Tomazela, D. M.; Cunha, I. B. S.; Bankova, V. S.; Marcucci, M. C.; Custodio, A. R.; Eberlin, M. N.; Analyst
2004, 129, 739.
16. Moller, J. K. S.; Catharino, R. R.; Eberlin, M. N.; Analyst2005,
130, 890.
17. Araújo, A. S.; Rocha, L. L.; Tomazela, D. M.; Sawaya, A. C. H. F.; Almeida, R. R.; Catharino, R. R.; Eberlin, M. N.; Analyst2005, 130, 884.
18. Moller, J. K. S.; Catharino, R. R.; Eberlin, M. N.; Food Chem.
2007, 100, 1283.
19. Amorim, A. C. L.; Hovell, A. M. C.; Pinto, A. C.; Eberlin, M. N.; Arruda, N. P.; Pereira, E. J.; Bizzo, H. R.; Catharino, R. R.; Moraes Filho, Z. B.; Resende, C. M.; J. Braz. Chem. Soc.
2009, 20, 313.
20. Marques, L. A.; Catharino, R. R.; Bruns, R. E.; Eberlin, M. N.; Rapid Commun. Mass Spectrom. 2006, 20, 3654.
21. Saraiva, S. A.; Cabral, E. C.; Eberlin, M. N.; Catharino, R. R.; J. Agric. Food Chem. 2009, 57, 4030.
22. Law, W. S.; Chen, H. W.; Balabin, R.; Berchtold, C.; Meier, L.; Zenobi, R.; Analyst2010, 135, 773.
23. Ciosek, P.; Brzózka Z.; Wróblewski, W.; Martinelli, E.; Di Natale, C.; D’Amico, A.; Talanta2005, 67, 590.
24. Barker, M.; Rayens, W.; J. Chemometr. 2003, 17, 166. 25. García-Plazaola, J. I.; Artetxe, U.; Becerril, J. M.; Plant Sci.
1999, 143, 125.
Submitted: April 3, 2011
Published online: January 10, 2012