BRAZILIAN JOURNAL OF OCEANOGRAPHY, 60(3):391-403, 2012
THE DYNAMICS OF A FRICTIONALLY-DOMINATED AMAZONIAN ESTUARY
Nils Edvin Asp1*, Carlos Augusto França Schettini2, Eduardo Siegle3, Marcio Sousa da Silva4 and Roney Nonato Reis de Brito1
1Instituto de Estudos Costeiros da Universidade Federal do Pará
(Alameda Leandro Ribeiro, s/n, Aldeia, Campus UFPA, 68600-000 Bragança, PA, Brasil)
2
Departamento de Oceanografia/Centro de Tecnologia e Geociências da Universidade Federal de Pernambuco (Av. Prof. Moraes Rego, 1235, Cidade Universitária UFPE, 50670-901 Recife, PE, Brasil)
3Instituto Oceanográfico da Universidade de São Paulo
(Praça do Oceanográfio, 191, 05508-120 São Paulo, SP, Brasil)
4
Centro de Pesquisas Aquáticas do Instituto de Pesquisas Científicas e Tecnológicas do Estado do Amapá (Rodovia Juscelino Kubitschek, km 10, 68903-000 Macapá, AP, Brasil)
Corresponding author: [email protected]
A
B S T R A C TThe hydrodynamics, morphology and sedimentology of the Taperaçu estuary were investigated. This is one of several estuaries located within the largest mangrove fringe in the world, bordering the Amazon region, subject to a macrotidal regime and regionally atypical negligible fresh water supply. The results reveal widespread sand banks that occupy the central portion of the estuarine cross-section. Well-sorted very fine sandy sediments of marine origin prevail. Shorter flood phases, with substantially higher current velocities, were observed in the upper sector of Taperaçu, as expected for a shallow, friction-dominated estuary. However, ebb domination can be expected for estuaries with large associated mangrove areas and substantial estuarine infilling, both of which situations occur on the Taperaçu. The tidal asymmetry favoring flood currents could be the result of the absence of an effective fluvial discharge. Furthermore, it was observed that the Taperaçu is connected by tidal creeks to the neighboring Caeté estuary, allowing a stronger flux during the flood and intensifying the higher flood currents. As a whole, the results have shown a complex interaction of morphological aspects (friction, fluvial drainage, connections with neighbor estuaries, infilling and large storage area) in determining hydrodynamic patterns, thus improving the understanding of Amazon estuaries.
R
E S U M OA hidrodinâmica, morfologia e sedimentologia do estuário do Taperaçu foram investigadas. Este é um entre vários estuários do litoral amazônico que integram a maior extensão contínua de manguezais do mundo, apresentando uma descarga de água doce muito reduzida, atípica para a região. Os resultados revelam grandes bancos arenosos que ocupam em grande parte a porção central do estuário. Areias muito finas e bem selecionadas de origem marinha prevalecem. Fases de enchente mais curtas, com velocidades de corrente substancialmente mais altas, são observadas na porção superior do estuário, como esperado para um estuário raso e dominado por fricção. Por outro lado, uma vazante mais intensa poderia ocorrer como resultado de grandes áreas de manguezais associadas e intenso preenchimento estuarino, sendo que ambas as condições são observadas no Taperaçu. Neste caso, a prevalência da enchente parece estar associada à ausência de uma descarga fluvial efetiva. Além disso, alguns canais de maré conectam o Taperaçu com seu vizinho estuário do Caeté, o que contribuiria para o domínio de enchente. Como um todo, os resultados demonstram uma complexa interação de aspectos de configuração (fricção, drenagem fluvial, conexões com estuários vizinhos, preenchimento e grandes áreas intermareais) na determinação dos padrões hidrodinâmicos, contribuindo para o entendimento dos estuários da região amazônica.
Descriptors: Amazon coast, Estuarine infilling, Hydrodynamics, Tidal asymmetry.
Descritores: Litoral Amazônico, Preenchimento Estuarino, Hidrodinâmica, Assimetria de maré.
I
NTRODUCTIONThe dynamics of approximately three-quarters of the Brazilian coast are controlled by wave
most of the South American fluvial discharge to flow eastward into the Atlantic and that the climate is generally wet, there are few large catchment areas or rivers on the eastern coast of Brazil, due to regional geological configuration (e.g. the presence of the Atlantic Shield). In contrast, the northern sector of the Brazilian coast is dominated by tides and by the Amazon River, with a catchment area of more than 6 x 10⁶ km2, a water discharge of the order of 200 x 103 m3s-1 and a suspended sediment load of the order of 3.5 x 10⁶ tons per day (MEADE et al., 1985). At the present time, the Amazon sediment plume is mainly driven northwards, in association with the Guyana current (LENTZ, 1995).
The actual sand supply from the Amazon River is of secondary importance, as compared with the suspended load (MEADE et al., 1985; SOUZA FILHO et al., 2009), but its long-term action associated with Quaternary sea-level changes has resulted in a sand-rich continental shelf, which has provided substantial sand volume for the coastal areas, such as the eastern sector of the Amazon coast, adjacent to the Amazon river mouth. There, a wide coastal plain containing several estuaries, tidal plains, tidally-influenced beaches and impressive mangrove forests have developed mainly over the last 5 thousand years, as a result of sea-level stabilization, or a marked reduction in velocity of sea-level rise during the Holocene (COHEN et al., 2005; SOUZA FILHO et al., 2009). In this way also, the Amazon coast differs from other sectors of the Brazilian coast, where a general fall in sea-level has been reported for the last 5 thousand years (ANGULO et al., 2006), resulting in coastal progradation. On the other hand, progradation also took place on the Amazon coast, but as a forced regression due to sediment supply.
The climate on the Amazon coast is determined mainly by seasonal changes in the position of the Inter-tropical Convergence Zone (ITCZ) which remains at latitudes around 14°N during August and September, migrating southwards to around 2° S during March and April, exactly over the Amazon region (SOUZA FILHO et al., 2009). The region thus experiences heavy rainfall in the first months of the year, 73% of the annual total falling from January to April, while September, October and November are especially dry months (MORAES et al., 2005). The annual regional rainfall is high, thus contributing to estuarine development, and varies from 2300 to 2800 mm (MORAES et al., 2005), the rainiest month usually being March, and the driest October. However, inter-annual variations are substantial. Long-term data series reveal monthly precipitation of the order of 400 mm in the rainy season and 30 mm during the dry, with transitional
periods (INMET, 2010). Wind-generated waves reach the region mainly from the east and northeast, with dominant wave heights being between 1 and 3 m. The most energetic waves approach the region during the austral summer (PIANCA et al., 2010).
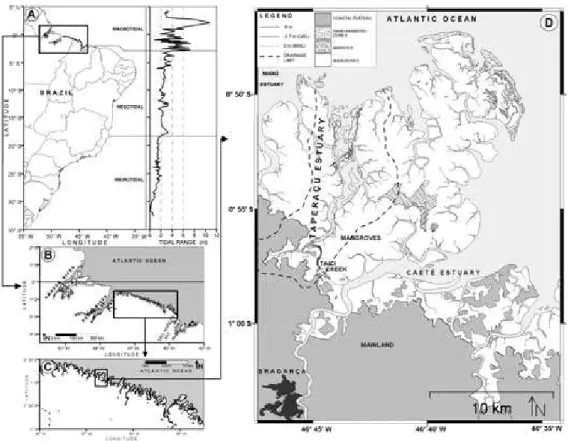
The tide-dominated eastern sector of the Amazon coast is around 480 km long with 7,600 km2 of continuous mangrove forests (Fig. 1C; SOUZA FILHO, 2005). The coastline is extremely irregular and jagged, harboring 23 estuaries (SOUZA FILHO et al., 2009), including that of the Taperaçu (Fig. 1). The estuarine embayments are sand dominated, interspersed with protruding mud-dominated coastal plains. The sediment dynamics of the estuarine basins and the muddy plains are interrelated and the coastline subject to continuous change (SOUZA FILHO et al., 2009).
The Taperaçu estuary is located close to Bragança city, where the Caeté River and its contiguous estuary are an outstanding feature of the landscape. The Caeté river basin occupies an area of around 2,000 km2, the river running through it for a distance of approximately 100 km and having a mean fresh water discharge of the order of 40 m3/s (SOUZA FILHO et al., 2009; PEREIRA et al. 2009). The main water bodies of the Taperaçu and Caeté estuaries are separated by an 8 km wide and 25 km long lowland peninsula, covered mainly by mangrove forests (Fig. 1).
The Taperaçu estuary presents 21 km2 of water surface and its catchment area is of approximately 40 km2, without any actual fresh water source. The drainage area is composed mainly of mangrove forest and wetlands, which border the estuarine water body almost exclusively. The mangrove area includes several tidal creeks, which here and there connect the Taperaçu with the neighboring bights/estuaries of Maiaú and Caeté. There the hindrance to lateral water flow from the estuary near high tides is only partial. Wind-generated waves are of secondary relevance along the coast and their propagation into the estuary is substantially reduced by sandy shoals and ebb tidal deltas. Thus, the morphodynamics of Taperaçu estuary are driven firstly by the macro-tidal regime, a secondary role being played by local winds and wind-generated waves, with a negligible direct fresh water contribution. The present study aims to present a first assessment of the hydrodynamics and sediment distribution of the Taperaçu estuary, in view of the fact that it represents the whole eastern sector of the Amazon coast. The absence of a significant fresh water supply simplifies the results in terms of the conceptualization of the tidal processes involved.
Fig. 1. Study area location and tidal range along the Brazilian coast (A - modified from Vellozo and Alves 2005; D - modified from Mehlig 2001).
M
ATERIAL ANDM
ETHODSThree main aspects of the Taperaçu estuary - its morphology, sediment distribution and hydrodynamics - were evaluated. The morphology was investigated on the basis of satellite imagery and bathymetric surveying. The sediment distribution was based on bottom sediment sampling for sediment characterization. The hydrodynamics were investigated by means of field experiments conducting water level, current, salinity and suspended sediment concentration (SSC) measurements.
The coastline and sandbank mapping was elaborated based on satellite imagery. Images of a Landsat TM of 1st Aug/2001, an Aster of 23th Nov/2003 and a CBERS of 3rd Aug/2005 were used. All the images are RGB compositions. The spatial resolutions were of 30, 15 and 20 m, respectively. The images selected were obtained at low water level with maximum exposure of the sand banks. It is worth noting that good quality images are rare for the region, due to its intense cloud cover.
The bathymetric survey was carried out in March 2009. The bathymetric data were recorded with a 200 kHz eco-sounder and satellite positioning
system (GPS). The survey comprised around 60 km of profiling. The data were corrected in accordance with the tidal variation which occurred during the survey, recorded simultaneously by water level observations every five minutes. The data was, further, referred to the mean water level. The bathymetric dataset was then used to develop a digital elevation model (DEM), using the Surfer® v.8 software, which also makes the hypsometric calculations (cut and fill areas and volume calculations with respect to reference elevations) possible. The hypsometric analysis follows the works of Strahler (1952) and Boon and Byrne (1981).
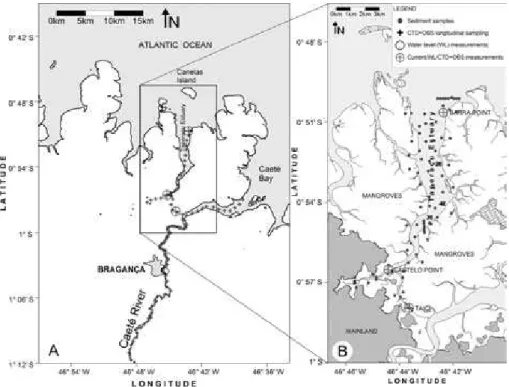
Bottom samples were collected during the bathymetric survey. A total of 57 samples were collected with a conventional van Veen grab in the channels and manually on the banks, during low tide. Figure 2 indicates the locations of the samples. All sediment samples were submitted to the usual grain size analysis (LINDHOLM, 1987) and the granulometric parameters were calculated in accordance with Folk and Ward (1957). The results of the grain size analysis were represented on surface mapping and Flemming`s ternary diagram (FLEMMING, 2000).
Hydrodynamic data were collected on two occasions. The first occurred during the dry period, in September 2008, and the second during the wet period, in March 2009. During the September 2008 campaign, water level was recorded simultaneously at two stations, one located in the Inlet (#I) and the other at the Castelo site (#C) nearly 10 km upstream from #I (Fig. 2B). The water level was recorded with self logging tide gauges, recording data at 20 minute-intervals from time-averaging of three minutes at 1 Hz, during a 48-hour period, from 14th to 15th September 2008. Thirteen-hour long tidal surveys were conducted at three locations during the dry period, including the #I and #C stations and at Taici station #T, located on the Taici tidal creek, which connects Caeté and Taperaçu estuaries. The surveys were carried out, respectively, on 15th, 17th and 18th Sep. The #I was located on the cross section thalweg, with the depth ranging from 6 to 12 m at low and high tide, respectively. Current velocity and direction were recorded at #I with an acoustic Doppler current profiler (ADCP) by Teledyne RDI™ model Workhorse 1200 kHz. The ADCP was operated from an anchored boat, recording continuously, with 0.5 m of vertical beam size. Vertical profiles of salinity, temperature and turbidity were recorded with a CTD probe by Alec™ model MCTD at 30-minute intervals. The depth at #C ranged from less than 1 m at low tide to 4.5 m at high tide. Current velocity was measured
with a Hydrobios™ mechanical flow meter, and the current direction was indicated by visual observation. Salinity, temperature and turbidity were recorded with the Alec™ CTD, moored 0.5 m below the surface, tied to the anchored boat. The depth at #T ranged from ~0.5 to 3 m at low and high tide, respectively. The measurements follow the same procedure used at #C, though carried out from a bridge, instead of a boat.
Two longitudinal surveys were conducted in order to provide spatial information on the distribution of salinity and turbidity. The first survey was carried out on 16th Sep, and covered the entire longitudinal axis of Taperaçu estuary (~16 km) and the Taici passage (~5 km). The second survey was carried out on 20th Sep along the Caeté estuary, starting from the inlet and moving up the estuary, covering ~48 km. At each station, spaced approximately 1 km apart, a vertical profile of salinity, temperature and turbidity was recorded with the Alec™ CTD. The navigation and positioning was undertaken with a hand held GPS receiver Garmin™ 60Map CSx.
The March 2009 campaign comprised measurements at #I for a period of 24 hours. Current velocity and direction were recorded continuously with the ADCP following the same procedure as for the September 2008 campaign. Salinity and temperature were only recorded at 0.5 m below the surface, using a CTD by Seabird™ model SBE-37SM moored to the anchored boat, at 5-minute intervals.
R
ESULTSMorphology and Sedimentology
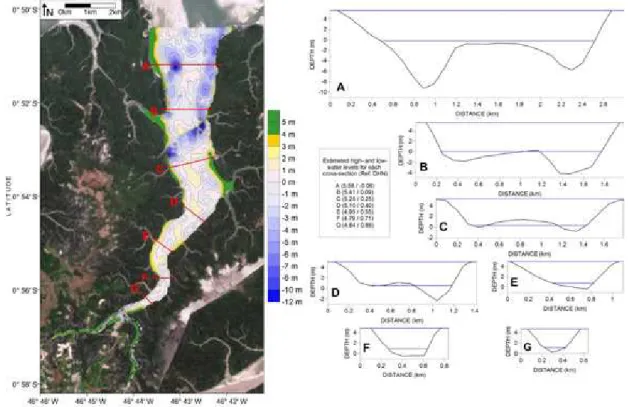
The bathymetric and hypsometric calculations (Figs 3 and 4) reveal a shallow, substantially infilled estuary, although with some deep channels, mainly running close to the margins. Thus the intertidal banks/shoals occupy mainly the central portion of the estuarine cross-section, of whose intitial water surface an area of about 50% is exposed at low water. As shown in Figure 3, comparisons of several cross-sections along the estuary reveal its relatively small cross-sectional area, especially in the light of the mean tidal range (blue lines indicate mean low- and high-water levels). A strong cross-sectional area reduction landwards is also to be observed, especially due to the continuous reduction of the area below mean low water level. A “W”-shaped profile is observed, especially for the outer parts, as reported by various authors for different estuaries around the world, where tides play a major role (AHNERT, 1960; KJERFVE, 1978; LAMBIASE, 1980; ASP, 2006).
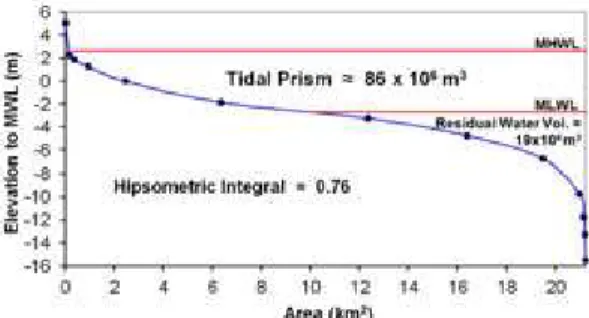
Taking a mean tidal range of 4.5 m and in view of the bed morphology, the tidal prism was calculated to be around 86 x 106 m3. The low tide water volume, i.e. the water volume remaining in the estuary during low water, was estimated to be around 19 x 106 m3 (Fig. 4). Thus about 82% of the estuarine water volume usually flows in and out of the estuary during every tidal cycle. Therefore, the Taperaçu estuary can be classified as a shallow, friction-dominated estuary (as proposed by Friedrichs et al. 1992).
According to Strahler (1952), the degree of erosion of a drainage basin can be parameterized in terms of the hypsometric integral, roughly corresponding to the land volume between the lowest and the highest point in a basin. As suggested by Boon and Byrne (1981), this concept can be applied to evaluate the infilling of depositional basins. For the Taperaçu estuary the infilling (Hypsometric Integral) would correspond to 0.76 (76%), whereas the water volume at high tide corresponds to 24%. If the mangrove areas are taken into account, the hypsometric integral value for the estuary rises to 94%.
Fig. 3. Bathymetry and cross-sectional profiles along the Taperaçu estuary (the base map corresponds to a Landsat TM image from 2001).
Fig. 4. The hypsometric curve for the Taperaçu estuary, including water volume calculations.
The prevailing superficial sediment type is well-sorted fine to very fine sand in the main channels and on the shoals/banks. Besides, at the margins and in the innermost portions of the estuary, muddy sediments are also abundant, due to mangrove influence. The prevalence of sands is evident from the mean grain size on Flemming’s ternary diagram (Fig. 5). Furthermore, the mud content in the sand samples was usually less than 1%. Thus, the overall mud content on the bed is definitively low along the Taperaçu. Muddy sediments were found only in very sheltered areas and among the mangroves at the margins. Considering all the samples analyzed, the mean sand, silt and clay fractions were 92.5, 4.5 and 3%, respectively. The grain size distribution asymmetry usually presented negative values in the channels and positive values on the shoals, which would indicate respective erosive and depositional tendencies. Most of the samples (82%) were also classified as very-well sorted, with lower sorting being the result of mud and sand mixing locally.
Fig. 5. Flemming’s ternary diagram evidencing the sand overcome. The few muddy samples are numbered (see Figure 2 for location of numbered samples).
Hydrodynamics
Water level measurements comparing the outer and inner parts indicate substantial tidal asymmetry and attenuation, as the tidal wave propagates along the estuary. Measured tidal range at the inlet was around 5.7 m, while at the inner portion (Castelo, 10 km landwards) it was around 3.7 m (Fig. 6). The reduction was of the order of 35%. Regarding phase duration, it was observed that the ebb phase lasts for about 6.5 hours and the flood phase for about 5.83 hours at the inlet. Furthermore, when compared to the water levels in the inlet, the high water level reached its maximum at Castelo with a delay of one hour, while the minimum water levels are reached at Castelo with a 3-hour delay. The measurements were undertaken during the equinoctial spring tide, though these results could be assumed to be nearly maximum values for spring tide. The usual spring tidal range is around 5 m for the outer part of the Taperaçu and Caeté estuaries (SOUZA FILHO et al., 2003).
Fig. 6. Tide records from Taperaçu inlet (continuous line) and at nearly 10 km upestuary at Castelo station (dashed line).
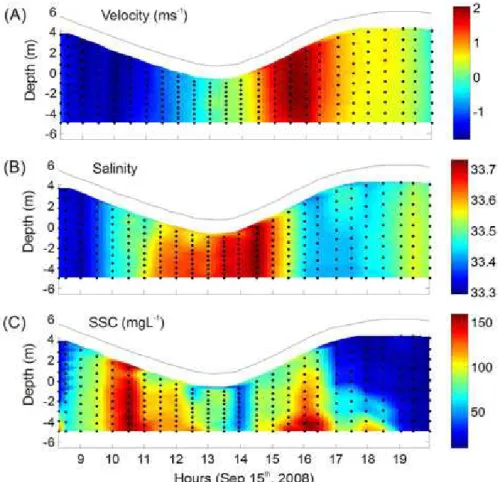
Fig. 7. Temporal and vertical distributions of current velocity (A, ms-1), salinity (B) and suspended sediment concentration (C, mgL-1) at the inlet station of Taperaçu estuary.
The inner part's maximum velocities were substantially different, with strong flood dominance, as a consequence of the substantial difference in phase duration. Maximum measured current velocity was around 2.04 ms-1 during the flood phase and 1.7 ms-1 during the ebb phase (Fig. 8). SSC peaks were observed by the middle of ebb and flood phases, as a result of higher current velocities. However, in the second half of the ebb phase, a discrete SSC peak, three times higher than the others associated with the current velocity peaks, is observed. The above-mentioned peak followed a strong, short-period of decay in salinity, with values between 34 and 10, rapidly returning to the initial values after approximately 30 min (Fig. 8).
The Taici creek interconnects the upper Taperaçu and Caeté estuaries. During ebb tide the water flows from the Caeté into the Taperaçu, and salinity values close to 10 are usual (Fig. 9). However, the SSC values observed during the ebb phase in Taici (Fig. 10) are much lower than those found during the above-mentioned peak at Castelo. Salinity and SSC
longitudinal measurements at the Taici creek during September 2008 show a strong salinity gradient, which also reveals the difference in circulation between the Taperaçu and Caeté estuaries (Fig. 11). The survey was carried out close to high water, indicating values of the order of 34 for the Taperaçu head, while at the Caeté end the salinity was around 14 (Fig. 11a). In the inlet region, salinity is similar for both estuaries, but compared to the Taperaçu, when moving landwards along the Caeté estuary, superficial salinity decays around 1 every km, approximating to zero after 26 km (Fig. 11b). A turbidity maximum zone was also clearly observed in the Caeté estuary.
Figure 12 presents the comparison of spring tide measurements taken in the Taperaçu inlet during September 2008 (dry season) with measurements taken during March 2009, which corresponds to the rainiest period of the year. The overall water level and current velocity pattern is very similar in both seasons. The only obvious difference is in the salinity, which presents much lower values in March.
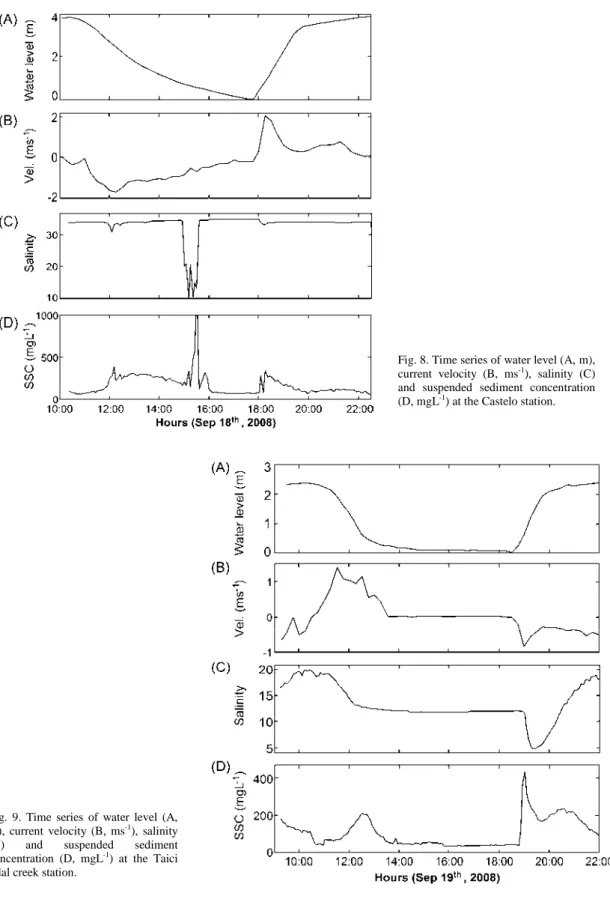
Fig. 8. Time series of water level (A, m), current velocity (B, ms-1), salinity (C) and suspended sediment concentration (D, mgL-1) at the Castelo station.
Fig. 9. Time series of water level (A, m), current velocity (B, ms-1), salinity (C) and suspended sediment concentration (D, mgL-1) at the Taici tidal creek station.
Fig. 11. Longitudinal variation of salinity (continuous line) and suspended sediment concentration (dashed line) along the Taici creek (A), between Taperaçu and Caeté estuaries, and along Caeté estuary (B).
Fig. 12. Water level, current velocity and salinity at the Taperaçu inlet during September 2008 (A) and March 2009 (B). Note that salinity scale in B is different than in A.
Fig. 10. Longitudinal variation of salinity (continuous line) and suspended sediment concentration (dashed line) along the Taperaçu estuary.
D
ISCUSSION ANDC
ONCLUSIONSWith respect to its morphology, the Taperaçu estuary is very shallow in the light of its tidal range and prism. This can be associated with the limited fresh water discharge into the system and the associated hydrodynamic behavior, resulting in the substantial infilling of the Taperaçu estuary.
Considering continental drainage basins, Strahler (1952), based on the integration of volumes from hypsometric curves, concluded that erosion under 40% would characterize a youthful, i.e. still-filled, basin. Thus, for a depositional basin such as an estuary, a value higher than 60% would characterize an infilled basin.
Boon and Byrne (1981) simulated empirically the effects of the relationships of water levels/inundated area in tidal flow by applying hypsometric analysis to coastal basins and estuaries. Due to its effects on the tidal flows, only values as high as 85% (including mangroves or marshes) would characterize an infilled estuarine basin. The hypsometric integral of 94% for the Taperaçu estuary is clear evidence of infilling. Even when mangroves are not taken into consideration, the hypsometric integral still reaches a high value, of about 76%.
As a consequence of this estuarine infilling, large banks, bordered by lateral channels, are formed in the estuary's central portion. This pattern would be the result of lateral displacement of ebb and flood currents, according to the estuarine meandering model (AHNERT, 1960), which also explains the preferential sediment accumulation in the form of central banks. However, estuarine meanders are usually more conspicuous where there is a clear valley and flood plain configuration. The Taperaçu estuary, wide and shallow, has been fully developed in the Holocene coastal plain for the last 5 to 3 thousand years (COHEN et al., 2005; SOUZA FILHO et al., 2009). Thus, due to their strong dynamics, the meanders are not evident, although the sinuosity of the channels may be observed (Fig. 3).
The dominance of fine-grained sands is to be attributed to the general estuarine configuration. Since there is no substantial sediment supply from the continent, most of the sand deposited in the Taperaçu is supposed to be pumped in from the inner shelf by waves and tidal currents. In fact, the inner shelf is essentially composed of well-sorted, fine to very-fine sand of marine origin, which could be easily transported landwards into the estuaries (ZEMBRUSCKI et al., 1971). The observed estuarine sediment distribution is in agreement with the hydrodynamics and suggested transport pattern.
As distinct from the generally low mud content of the sediment, the localized prevalence of
mud occurs in sheltered areas and/or as a result of mangrove erosion. The strong tidal attenuation, especially above Castelo point, results in mud deposition in the innermost portion. The origin of this mud was not investigated, but SSC data suggest that it comes from the flooding coastal waters, which present high SSC during the wet season, associated with the large rivers of the Amazon region.
These morphological and sedimentological aspects are closely related to tidal asymmetries and attenuation along the Taperaçu. The great reduction in the range of the high tide (35% from the Inlet to Castelo) can be related mainly to the large infilling of the estuary and the frictional effects produced which partially dissipate the tidal energy. Initial tide amplification, which also occurs in Taperaçu, is very often related to macrotidal estuaries when the tidal wave approaches the coast and the estuary inlet. Comparisons of the tidal range actually measured at the inlet with predictions for the coastal area (DHN, 2008), indicate an initial amplification of the order of 20%, followed by further attenuation along the estuary. These results highlight the role played by the estuarine morphology in the hydrodynamics, despite the fluvial discharge.
Souza Filho et al. (2009) also reported higher flood velocities for the mouth of the Caeté estuary, though overall slight flood dominance for estuarine mouths can be assumed along the eastern sector of the Amazon coast. However, in the inner parts of the Taperaçu estuary, measured phase durations were around 8.33 h for the ebb, while the flood phase was taking approx. 4 h, as shown in Figure 6, representing tidal curves for the inlet and Castelo.
Regarding the general aspect of measured tidal currents at the inlet, a single peak occurs during the ebb, while during the flood phase two peaks can be observed. This behavior has also been reported by Lessa and Masselink (1995) in an Australian macrotidal estuary, where mangroves occupy large areas, as in the Taperaçu estuary. The first and main peak occurs close to the mid-tide, as is to be expected. The second, smaller peak was observed just before the high tide and would be a consequence of mangrove inundation, resulting in a sudden increase of discharge and flood current velocities, as postulated by the authors.
influence of freshwater discharge, higher ebb flows are reported for the entire Caeté estuary during the rainy season (PEREIRA et al., 2009).
SSC in the inner portion of the Taperaçu estuary have shown a distinct peak close to low water, accompanied by a sudden decay in salinity, from 34 to 10 (Fig. 9). The measurements were taken during the dry season and no rain was registered during the period measured. Furthermore, the Taperaçu has no substantial fluvial discharge. Thus, the reported brackish, high SSC water input might be correlated to the input from the Caeté estuary. In fact, the measurements taken in the Taici creek, close to the Castelo point, reveal that during the ebb phase the water flows from Caeté into the Taperaçu, and salinity values close to 10 are found, however the SSC values observed during the ebb phase in Taici are much lower than those during the above-mentioned peak at Castelo (Fig. 10). Furthermore, there is a residual flux of water and suspended sediment from Taperaçu into the Caeté estuary during the flood phase, when the water flows from the Taperaçu into the Caeté, with suspended sediment concentrations (SSC) twice those of the ebb phase. Similar exchanges of suspended sediment between estuaries though a channel are reported by Schettini and Miranda (2010).
Even when currents present higher velocities during the ebb at the point measured in the Taici creek, the flood fluxes last longer, which, in association with the much higher SSC, result in effective suspended sediment transport from Taperaçu to Caeté. Furthermore, the slack water periods are too short to permit the settling of fine sediments and flakes, as suggested by the measurements taken in both the Inlet and Castelo. Figure 10 presents the superficial SSC along the Taperaçu estuary, which is quite regular and high, but deposition is not favored because of turbulence. The decay in salinity, close to the Taici entrance, also reinforces the brackish water input from Caeté, which would explain the discrete SSC peak observed at Castelo (Fig. 8).
As presented in Figures 10 and 11, the salinity distribution along the Taperaçu has a nearly constant value, whereas in Caeté it decreases gradually landwards. Salinity and SSC longitudinal measurements in the Taici creek during September 2008 showed a strong salinity gradient, which also reveals the differences in circulation between the Taperaçu and Caeté estuaries (Fig. 11). The water flow from Caeté to Taperaçu during the ebb through Taici might explain the reduction in salinity from around 20, close to high water, to around 13, close to low water. The salinity in the region is also determined by the enormous fresh water discharge of the Amazon River itself and other rivers of the region, especially from January to May (MEADE et al., 1985; NITTROUER
et al., 1995). Substantial seasonal salinity variations do, therefore, occur at Taperaçu, but with only a small contribution from local discharge.
Regarding the estuarine morphodynamics, the Caeté estuary gives a good comparative reference for the comprehension of the Taperaçu's particularities, since both are set within the same geological and climatic context. The Caeté estuary presents the typical funnel shape of macrotidal estuaries (WRIGHT et al., 1973) and the morphological zoning as proposed for tidal-dominated estuaries by Dalrymple et al. (1992). In addition, the fluvial discharge produces common longitudinal salinity gradients, with considerable seasonal variations (MONTEIRO; PEREIRA, 2009). The flow velocities also present expected behavior, increasing upward ebb dominance being observed as the relative importance of the fluvial discharge increases.
Several authors emphasize that in macrotidal estuaries with large mangrove areas, as occurs with the Taperaçu and Caeté estuaries, ebb dominance is to be expected (AUBREY; SPEER, 1985; LESSA; MASSELINK, 1995; LESSA, 2000). On the other hand, Friedrichs and Aubrey (1988) and Friedrichs et al. (1992) have demonstrated that shallow estuaries in which tidal range is large relative to the channel depth, flood dominance might occur, as observed at Taperaçu. Commonly, the funneling effect of the convergence of the estuary's margins is opposed to the frictional effect (DYER, 1995), but for Taperaçu the funneling seems to prevail only offshore of the Inlet point.
The present study on the Taperaçu estuary suggests that the fluvial influence in estuarine systems should be relativized. In a certain way, estuaries in which fluvial influence is great would actually represent a young evolutionary stage of a delta. Wells (1995) defined these systems as tidal rivers, where fresh water discharge limits the salt penetration. This is also the case of several coastal rivers in the Amazon region, as the Amazon River itself (WELLS, 1995). Thus, in the light of the enormous variety of hydrographical, topographical and climatic conditions to which estuaries are subject (MIRANDA et al., 2002), the landward gradual deformation and/or attenuation of marine forces (waves, and specially tides) into an open coastal water body may be seen as the only overall common estuarine characteristic.
A
CKNOWLEDGEMENTSThe authors would like to thank the National Council for Scientific and Technological Development of Brazil (CNPq) for the funding of the project (proc. 482879/2009-2), as well as for the fellowships of Nils E. Asp (501014/2009-8), Carlos A. F. Schettini
(306217/2007-4) and Eduardo Siegle (305805/2009-6). We are also grateful to all the personal of the Coastal Geology Laboratory (LAGECO) of the Federal University of Pará (UFPA) for their valuable assistance in the field in data collection and laboratory analyses.
R
EFERENCESAHNERT, F. Estuarine meanders in the Chesapeake Bay area. Geogr. Rev., v. 50, p. 390-401, 1960.
ANGULO, R. J.; LESSA G. C.; SOUZA, M. C. A Critical review of Mid- to Late Holocene sea-level fluctuations on the eastern Brazilian coastline. Quaternary Sci. Rev., v. 25, p. 486-506, 2006.
ASP, N. E. Morphological changes of tidal flats at the German North Sea Coast induced by tidal asymmetry. J.
Coast. Res., v. SI39, p. 440-445, 2006.
AUBREY, D. G.; SPEER, P. E. A Study of non-linear propagation in shallow inlet/estuarine systems. Pt I: Observations. Estuar. Coast. Shelf Sci., v. 21, p. 185-205, 1985.
BOON, J. D.; BYRNE, R. J. On basin hypsometry and the morphodynamic response of coastal inlet systems. Mar.
Geol., v. 40, p. 27-48, 1981.
COHEN, M. C. L.; SOUZA FILHO, P. W. M.; LARA, R. L.; BEHLING, H.; ANGULO, R. J. A model of holocene mangrove development and relative sea-level changes on the Bragança Peninsula (northern Brazil). Wetl. Ecol.
Manag., v. 13:, p. 433-443, 2005.
DALRYMPLE, R. W.; ZAITLIN, B. A.; BOYD, R. Estuarine facies model: Conceptual basis and stratigraphic implications. J. Sediment. Petrol., v. 62, p. 1130-1146. 1992.
DHN - Diretoria de Hidrografia e Navegação, Marinha do
Brasil. Available at
<https://www.mar.mil.br/dhn/dhn/index.html>. Accessed 20/10/08. .
DOMINGUEZ, J. M. L. The coastal zone of Brazil, p. 17-52. In: DILLENBURG, S.F.; HESP, P.A. (Ed.). Geology
and Geomorphology of Holocene coastal barriers of Brazil. New York: Springer-Verlag, 2009, 380p.(Series
Lectures Notes in Earth Sciences, 107, p. 15-17). DYER, K. R. Sediment transport processes in estuaries. In:
PERILLO, G. M. E. (Ed.). Geomorphology and
sedimentology of estuaries. Amsterdam: Elsevier, 1995.
471 p. (Series Developments in Sedimentology, 53, p. 423-449).
FLEMMING, B. W. A revised textural classification of gravel-free muddy sediments on the basis of ternary diagrams. Cont. Shelf Res., v. 20, p. 1125-1137, 2000. FOLK, R. L.; WARD, W. C. Brazos river bar: a study in the
significance of grain size parameters. J. Sediment.
Petrol., v. 27, p. 3-26, 1957.
FRIEDRICHS, C. T.; AUBREY, D. G. Non-linear tidal distortion in shallow well-mixed estuaries: a synthesis.
Estuar. Coast. Shelf Sci., v. 27, p. 521-545, 1988.
FRIEDRICHS, C. T.; LYNCH, D. R.; AUBREY, D. G. Velocity asymmetries in frictionally-dominated tidal embayments: longitudinal and lateral variability. In: D. PRANDLE (Ed). Dynamics and exchanges in estuaries
and the coastal zone. Wshington, DC: American
Geophysical Union, 1992. p. 277-312.
INMET. Normais Climatológicas do Brasil 1961-1990. INMET Brasil, 465p. 2010.
KJERFVE, B. Bathymetry as an indicator of net circulation in well mixed estuaries. Limnol. Oceanogr., v. 23, p. 816- 821, 1978.
LAMBIASE, J. J. Hydraulic control of grain-size distributions in a macrotidal estuary. Sedimentology, v. 27, p. 433-446, 1980.
LENTZ, S. J. The Amazon River plume during AMASSEDS: subtidal current variability and the importance of wind forcing. J. Geophys. Res., v. 100, p. 2377-2390, 1995. LESSA, G. C. Morphodynamic controls on vertical and
horizontal tides – field results from two macrotidal shallow estuaries: central Queensland, Australia. J.
Coast.Res. , v. 16, p. 976-989, 2000.
LESSA, G. C.; MASSELINK, G. Morphodynamic evolution of a macrotidal barrier estuary. Mar. Geol., v. 129, p. 25-46, 1995.
LINDHOLM, R. C. A practical approach to Sedimentology. London: Allen and Unwin, 1987. 276 p.
MEADE, R. H; DUNNE, T.; RICHEY, J. E.; SANTOS, U. M.; SALATI, E. Storage and remobilization of suspended sediment in the lower Amazon River of Brazil. Science, v. 228, p. 488-490, 1985.
MEHLIG U. Aspects of tree primary production in an equatorial mangrove forest in Brazil. ZMT-Contribution , n. 14, 2001. 155 p.
MIRANDA, L. B.; CASTRO, B. M.; KJERFVE, B.
Princípios de Oceanografia Física de estuários. São
Paulo: EDUSP, 2002. 414 p.
MONTEIRO, M. C.; PEREIRA, L. C. C. Morphodynamic change of a macrotidal sand beach on the Brazilian Amazon Coast (Ajuruteua - Pará). J. Coast. Res., v. SI56, p. 103-107, 2009.
MORAES, B. C.; COSTA, J. M. N.; COSTA, A. C. L.; COSTA, M. H. Variação espacial e temporal da precipitação no estado do Pará. Acta Amazon., v. 35, p. 207-214, 2005.
NITTROUER, C. A.; KUEHL, S. A.; STERNBERG, R. W.; FIGUEIREDO JR., A. G.; FARIA, L. E. C. Introduction to the geological significance of sediment transport and accumulation on the Amazon continental shelf. Mar.
Geol., v. 125, p. 177-192, 1995.
PEREIRA, L. C. C.; RIBEIRO, C. M.; MONTEIRO, M.; ASP, N. E. Morphological and sedimentological changes in a macrotidal sand beach in the Amazon littoral (Vila dos Pescadores, Pará, Brazil). J. Coastal Res., v. SI56, p 113-117, 2009.
PIANCA, C.; MAZZINI, P. L.; SIEGLE E. Brazilian offshore wave climate based on NWW3 reanalysis.
Braz. J. Oceanogr., v. 58, p. 53-70. 2010.
SCHETTINI, C. A. F.; MIRANDA, L. B. Circulation and suspended particulate matter transport in a tidally dominated estuary: Caravelas estuary, Bahia, Brazil.
Braz. J. Oceanogr., v. 58, p. 1-11, 2010.
SOUZA FILHO, P. W. M. Costa de manguezais de Macromaré da Amazônia: Cenários morfológicos, mapeamento e quantificação a partir de dados de sensores remotos. Rev. Bras Geofís., v. 23, p. 427-435, 2005.
SOUZA FILHO, P. W. M.; LESSA, G. C.; COHEN, M. C. L.; COSTA, F. R.; LARA, R. J. The subsiding macrotidal barrier estuarine system of the eastern Amazon coast, Northern Brazil, p. 347-376. In: DILLENBURG, S. F., HESP, P. A. (Ed.). Geology and
Geomorphology of Holocene coastal barriers of Brazil. New York: Springer-Verlag, 2009. 380 p.(Series
Lecture Notes in Earth Sciences, 107, p. 347-376, 2009. STRAHLER, A. N. Hypsometric (area-altitude) analysis of
erosional topography. Bull. Geol. Soc. Am., v. 63, p. 1117-1142, 1952.
VELLOZO, T. G; ALVES, A. R. Características gerais do fenômeno da maré no Brasil. An. Hidrogr., v. 61, p. 121-129, 2005.
WELLS, J. T. Tidal-dominated estuaries and tidal rivers, p. 179-205. In: PERILLO, G. M. E. (Ed.). Geomorphology
and Sedimentology of estuaries. Amsterdam: Elsevier,
1995. p. 179-205. (Series Development in Sedimentology, 53, 1995, 471 p.).
WRIGHT, L. D.; COLEMAN, J. M.; THOM, B. G. Processes of channel development of a high-tide range environment: Cambridge Gulf-Ord River Delta, Western Australia. J. Geol., v., p. 81: 15-41, 1973.
ZEMBRUSCKI, S. G; GORINI, M. A.; PALMA, J. J. C.; COSTA, M. P. A. Fisiografia e distribuição dos sedimentos superficiais na Plataforma Continental Norte Brasileira. Bol. Téc.Petrobras, v. 14, p. 127-155, 1971.
(Manuscript received 19 October 2011; revised
19 August 2012; accepted 22 October 2012)