A
r
t
ic
le
0103 - 5053 $6.00+0.00
*e-mail: [email protected]
Development of Sequential Injection Methodologies for the Spectrophotometric Direct and
Kinetic Determination of Aluminium in Natural and Waste Waters
Raquel B. R. Mesquita and António O. S. S. Rangel*
Escola Superior de Biotecnologia, Universidade Católica Portuguesa, Rua Dr. António Bernardino de Almeida, 4200-072 Porto, Portugal
Neste artigo propõem-se duas metodologias de análise por injeção seqüencial para a determinação de alumínio reativo em águas, baseadas na reação entre o “chrome azurol S” (CAS) e o alumínio. Os métodos desenvolvidos incluem uma determinação direta e uma metodologia cinética (para aplicação a águas residuais com coloração), implementadas na mesma montagem. Os intervalos dinâmicos de trabalho são: 0,040-0,500 mg Al L-1 para o método direto e 0,050-0,300 mg Al L-1 para o método cinético. O sistema descrito tem um elevado grau de automatização e permite uma freqüência de amostragem de 31 e 57 h-1 para a metodologia cinética e direta, respectivamente. O consumo de reagentes por determinação é baixo: 46 µg de CAS, 3,75 mg de acetato de sódio e 25 µg de ácido ascórbico. O volume de efluente produzido por determinação é de apenas cerca de 2,8 mL para o método direto e 3,4 mL no método cinético.
Two sequential injection methodologies for the spectrophotometric determination of reactive aluminium in water samples are proposed, based on the reaction between chrome azurol S (CAS) and aluminium. The two methods involve a direct and a kinetic methodology (for its application to coloured waste waters), both accommodated within the same manifold. The working ranges obtained were: 0.040-0.500 mg Al L-1 for direct method and 0.050-0.300 mg Al L-1 for the kinetic method. The described system has high degree of automation, enabling sampling throughputs of 31 and 57 h-1 for the kinetic method and direct methods, respectively. The reagents consumption per determination is low: 46 µg of CAS, 3.75 mg of sodium acetate and 25 µg of ascorbic acid. The volume of effluent produced per determination is only around 2.8 mL in the direct method and 3.4 mL in the kinetic method.
Keywords: sequential injection, spectrophotometry, aluminium, waters, kinetic determination
Introduction
The generalized public interest on water quality has substantially increased the demands on water monitoring. The parameters being under permanent observation are of both chemical and microbiological nature. Among the chemical parameters, metals stand on a privileged position due to their highly negative impact on human health. Most metals, namely heavy metals such as lead or mercury, are listed as inorganic primary contaminants and there is maximum concentration level (MCL) allowed in drinking water.1 For Pb and Hg MCL values are 0.015 and
0.002 mg L-1 respectively. Other metals such as aluminium
or iron have only non-enforceable guidelines concerning the limits allowed, as secondary drinking water regulations.1
In the case of aluminium, the possible relationship between aluminium intake in human diet and Alzheimer’s disease2 has given it an extraordinary relevancy. The
biological role for aluminium is not known but it has been estimated that the average human body contains, at most, 35 mg of aluminium (mainly in the lungs and the skeleton).3
The human diet of an adult includes an intake of aluminium in the ranges from about 2.5 mg to 13 mg per day (or more due to the widely use of aluminium hydroxide as an antacid and adjuvant of vaccines)3 where the most significant source
is the processed foods.2 In comparison, the intake from water
represents only a small contribution, nevertheless there are those who defend that the aluminium in water is more readily absorbed by human body.2 Then, the increase of
Aluminium is the third most common element found in the earth’s crust -about 8%- what makes it the most abundant metal.4 Naturally occurring aluminium exists only
combined, non toxic forms, which limits its bioavailability. The general acidification of the environment, resulting from pollution, causes the release of the ionic aluminium from its combined/complexed form. Consequently there is an increase in the dissolved aluminium content in natural waters. When treated water is involved the presence of toxic aluminium, ionic form, in the finished water can result from the use of coagulants, aluminium salts, in the water treatment plants.4
The reference methods for aluminium determination include the relatively expensive atomic absorption spectrometry (AAS) and inductively coupled plasma (ICP), and a colorimetric alternative with eriochrome cyanine R.5
Although the selectivity and sensitivity obtained with the AAS and ICP is a strong factor for its use, the high costs associated with these methodologies are discouraging. On the other hand, the spectrophotometric alternatives, when used in batch methodology, are normally time and reagent consuming.
To overcome the mentioned obstacles, flow methodologies using detection systems other than AAS and ICP stand as a valuable alternative. Previous works have been described for the determination of aluminium in waters using fluorimetric6-9 and spectrophotometric10-16
detection. The most commonly used reagents for the spectrophotometric determination of aluminium are pyrocathecol violet (PCV)10,11,13,16 and eriochrome cyanine
R (ECR).12,16 There are some disadvantages to be considered
when these reagents are used such as the quite significant probability of interference and their high toxicity.
In this work, two sequential injection (SI) methodologies for the determination of aluminium based on its reaction with CAS are proposed. The choice of CAS as the colour reagent over PCV and ECR was based on the reported higher sensitivity, linearity and stability15 as well as the lower
percentage of possible interference.17 When using CAS the
only interference to be accounted for is the presence of iron (III).17 Also CAS stands as a less polluting substance
when compared with PCV. Sequential injection was chosen over flow injection methodology based in some recognised advantages, namely: higher degree of automation, time and reagent saving, robustness and low effluent volume production. The use of the SI methodology presents yet another feature, high versatility, which enables the fulfilling of all the conditions for the colour reaction optimisation inline, including pH adjustment and interference minimisation.
Thus, water samples can be directly introduced in the system, for aluminium determination, after collection.
However, the direct introduction of the sample could arise some problems when waste waters are involved due to possible colour or turbidity interference. As mentioned above the aluminium monitoring in water treatment plants is of extreme importance due to the addition of aluminium salts (in excess) to the effluent water in the coagulation step. When these waters are involved, several factors must be taken into account such as: suspended solids, turbidity and intrinsic colour, which could mean several pre treatment steps. To overcome this problem, a kinetic methodology for the same reaction was developed. Again taking advantage of SI versatility, the appropriate changes in the sequence protocol allowed the kinetic determination to be carried out with the same manifold.
The proposed system enables both a direct, fast determination of aluminium in colourless samples and a kinetic determination aluminium for samples with intrinsic absorption. Thus, aluminium determination can be carried out in water samples from mineral drinking water to effluents treatment plants.
Experimental
Reagents and solutions
All solutions were prepared with analytical grade chemicals and boiled Milli-Q water (resistivity > 18MΩcm).
An aluminium stock solution of 100 mg L-1 was
prepared from dilution of the Spectrosol standard solution (1000 ± 5 mg L-1). Working standards were weekly prepared
from this stock solution in the dynamic range of (0.04-0.5 mg L-1).
A stock solution of 0.1% chrome azurol S (CAS) was obtained from the solid. Working solution of 0.04% CAS was weekly prepared by dilution of the stock solution.
A working solution of 15% sodium acetate was weekly prepared by dilution of a stock solution 20% sodium acetate, which was prepared from dissolution of the solid.
Ascorbic acid solution was prepared daily by dissolving 10 mg of solid in 10 mL of water, 0.1% ascorbic acid.
Sample preparation
The water samples were collected5 in plastic flasks
containing the necessary amount of 1 mol L-1 nitric acid
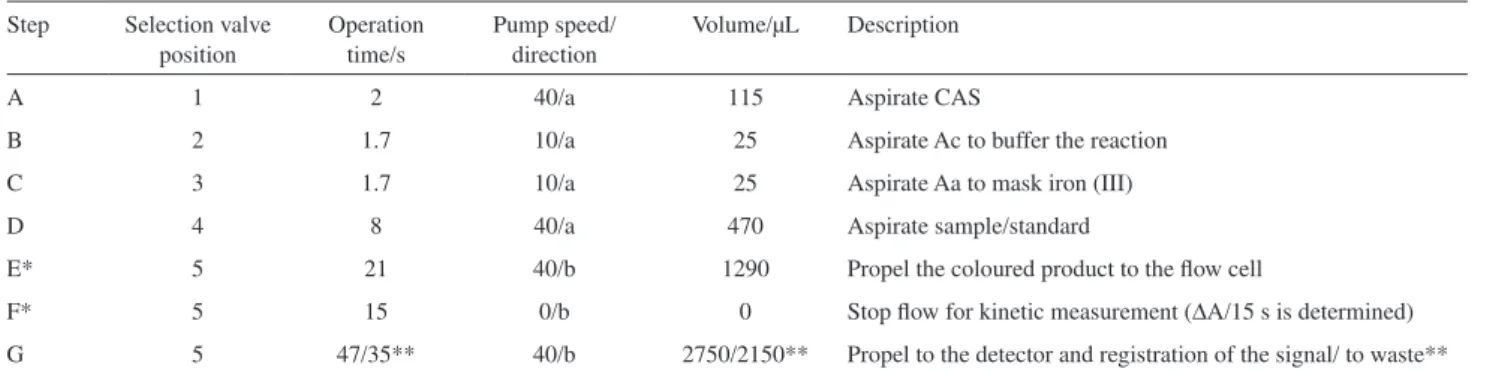
Table 1. Protocol sequence for the direct and kinetic determination of aluminium in waters
Step Selection valve position
Operation time/s
Pump speed/ direction
Volume/µL Description
A 1 2 40/a 115 Aspirate CAS
B 2 1.7 10/a 25 Aspirate Ac to buffer the reaction
C 3 1.7 10/a 25 Aspirate Aa to mask iron (III)
D 4 8 40/a 470 Aspirate sample/standard
E* 5 21 40/b 1290 Propel the coloured product to the flow cell
F* 5 15 0/b 0 Stop flow for kinetic measurement (ΔA/15 s is determined)
G 5 47/35** 40/b 2750/2150** Propel to the detector and registration of the signal/ to waste**
*Steps included for the kinetic determination; **Values for the last step of the kinetic determination. The effluents from treatment plants were also collected
in plastic flasks and acidified to pH 2 with nitric acid after which, if necessary, a filtration step was performed.
Apparatus
Solutions were propelled by a Gilson Minipuls 3 peristaltic pump with PVC pumping tubes. The pump was connected to the central channel of an eight port electrically actuated selection valve (Valco VICI 51652-E8). All tubing connecting the different components of the flow system was made of Teflon from Omnifit with 0.8 mm i.d.
A Hitachi 100-40 UV-Vis spectrophotometer with a Hellma 178.710-QS flow-cell (10 mm light path, 80 µL inner volume) was used as detection system. The wavelength was set to 545 nm. Analytical signals were recorded in a Metrohm E 586 Labograph strip chart recorder.
A personal computer (Samsung SD 700) equipped with a PCL818L interface card, running with homemade software written in Quick-Basic 4.5, controlled the selection valve (SV) position and the pump sense and speed.
Sequential injection manifold and procedure
The sequential injection manifold for the colorimetric determination of aluminium in waters is depicted in Figure 1. The sequence of the steps, as well as respective time and volume, for both methodologies (direct aluminium determination and the kinetic aluminium determination) are shown in Table 1. The steps from A-D are common to both methods; for the direct methodology, steps E and F are not run. The colour reagent, CAS solution (CAS), is aspirated into the holding channel, followed by sequential aspiration of sodium acetate (Ac), for adjusting reaction pH, ascorbic acid (Aa), for minimization of iron interference, and the sample/standard (S). The inversion of the flow direction promotes the mixture of all these plugs while they are
sent to detector. In the direct determination, the maximum absorbance of the coloured product was registered. For the kinetic determination, the stack zones are sent to the detector. After 21 s pumping, the reaction zone reaches the flow cell detector. Then the flow is stopped for 15 s to allow one to monitor the absorbance increase per time as consequence of the formation of the coloured product inside the spectrophotometric flow cell. The analytical signal (reaction rate) corresponded to the absorbance increase per time (s).
Results and Discussion
Optimisation of the SI system parameters for the direct determination
The SI manifold design is depicted in Figure 1, some parameters were set in advance, namely the reaction coil (randomly knitted) to 100 cm and the volume of sodium acetate and ascorbic acid to 25 µL, considered the minimum
volume with good precision in SI.18 Also previously set
was the aspiration order, being first aspirated the colour reagent, CAS, followed by the acetate, the ascorbic acid and the sample/standard.
The first SI parameter to be studied was the aspirated volumes of the colour reagent and the sample. The volume of CAS solution was studied in the range 30 to 235 µL; the sensitivity increased up to 115 µL, so that was the volume chosen. As for the sample volume, it was studied ranging from 115 to 525 µL. The chosen volume was 470 µL because there was no further increase in the sensitivity for higher volumes.
With the optimised volumes the concentration of the colour reagent, CAS, was studied (Figure 2). The concentration of 0.04% (0.40 g L-1) was chosen from
the tested concentrations, 0.025, 0.050, 0.10, 0.20, 0.40, 0.60 g L-1, ensuring a reagent excess as the sensitivity
increased up to 0.20 g L-1 maintaining for higher
concentrations.
The reaction between CAS and aluminium has a maximum sensitivity at pH ≈ 6 so a plug of sodium acetate was included in order to buffer the reaction. As iron(III) also reacts with CAS at the mentioned pH it represents the most significant interference. Although the interference17
cannot be totally eliminated, it has a minimal impact at pH ca. 4.6 so this was the chosen pH for the CAS-aluminium reaction. Also aiming to minimize iron(III) interference, a plug of ascorbic acid was included in the system. Being the buffer capacity of acetate intimately associated with the need of that acid plug, ascorbic acid concentration must be set in advance. So the study for the minimization of iron(III) interference was carried out, setting the amount of sodium acetate to 1%.
As mentioned above, the inclusion of an ascorbic acid plug aimed to minimize iron(III) interference, by reducing
it to iron(II). The study was based on comparing peak heights (absorbance values); an aluminium standard of 0.16 mg L-1 was used as reference and then compared to
another standard with the same amount of aluminium and the different quantities of iron(III) to be tested. Results can be observed in Figure 3. The chosen percentage of ascorbic acid was 0.10% as a higher percentage did not produce a decrease in interference; there is no distinction in Figure 3 between the 0.10% and 0.12% for 250 mg L-1 of Fe3+. At
this concentration of 1 g L-1 ascorbic acid, up to 250 mg L-1
of Fe3+ can be tolerated without significant interference in
the determination: ca. 6%.
The percentage of sodium acetate was studied afterwards aiming to a final reaction pH of about 4.6. The percentage of sodium acetate was varied from 1 to 20%, and 15% was chosen. Even though a slightly higher slope was obtained with 20% sodium acetate, as the detection and quantification limits increased with the increase of the percentage, a compromise was made at 15% sodium acetate.
Optimisation of the kinetic determination
The kinetic determination aims to enable the colorimetric aluminium determination even in coloured waters. After the optimisation of the system for the direct determination, a new methodology was developed to accommodate the kinetic determination. The SI manifold was the same and is depicted in Figure 1. The first parameter to be studied was the propelling time, that is, the time interval between flow reversal and stopping at the flow cell (Step E, Table 2). A preliminary study to assess how long it took from sending the stacked zones to detector until observation of the absorbance maximum was carried out running the sequence described on Table 1. Afterwards, a systematic study on the influence of the propelling time on the initial reaction rate
Figure 2. Optimisation of the concentration of CAS. The point in black represents the chosen concentration of 0.4 g L-1.
was done; the propelling times studied ranged from 20.5 to 23.5 s, and 21 s was chosen since it resulted in the highest calibration curve slope, as shown in Figure 4.
Having set the propelling time, the following parameter to be studied was how long time to have the flow stopped (Step F in Table 2). The stopped time was studied in the range of 10 to 20 s and although the calibration curve slope increased with the decrease of time, 15 s of stopped time was chosen due to better linearity of the calibration curve and repeatability of each rate measurement.
Because the kinetic methodology implied a higher contact time between sample and reagents the elimination of iron(III) interference was again tested. This study was based on comparing peak slopes (initial reaction rates); similar to the previous interference study, an aluminium standard of 0.16 mg L-1 was used as reference and then compared to
another standard with the same amount of aluminium and different quantities of iron(III). Results showed that there was no interference up to a concentration of 300 µg L-1 in which
a percentage of interference of 5% was observed.
Application to water samples
Using both the SI methodologies, the direct and the kinetic determination, recovery studies were carried out. A siagram of a calibration curve and sample for both methodologies is shown in Figure 5.
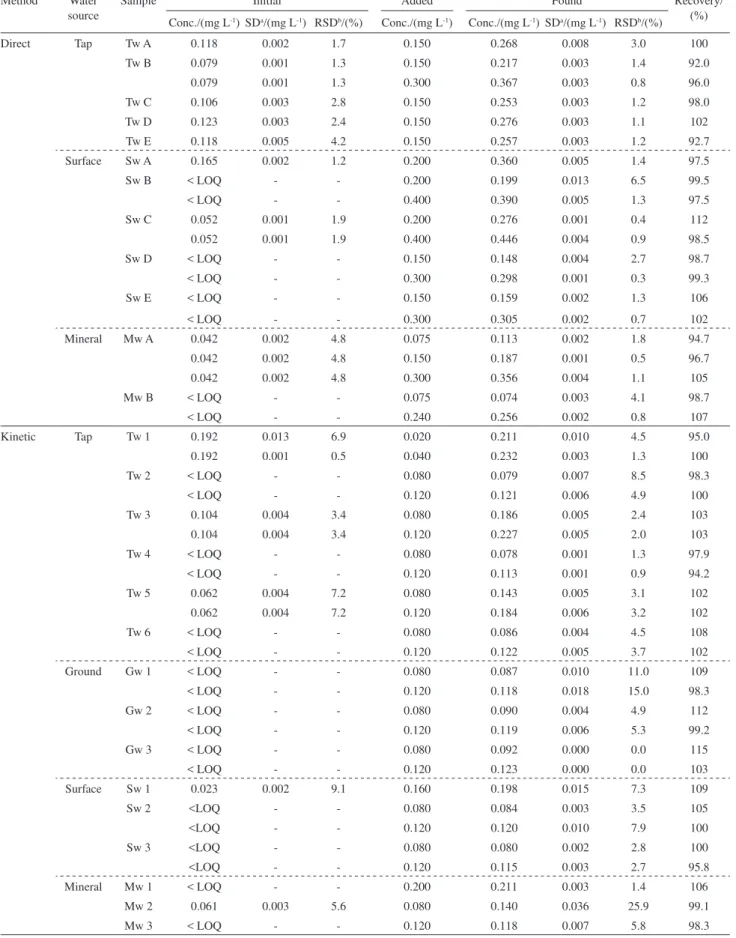
The recovery studies were performed in different waters: tap-water, surface, ground and mineral water, results are presented in Table 2.
For spiking the samples used in the SI method with direct determination, volumes from 150 to 800 µL of aluminium stock solution (10 mg L-1) were added to 20
or 25 mL of sample, while for spiking the samples in the SI method with kinetic determination volumes from 100
to 800 µL of aluminium stock solution (2 mg L-1) were
added to 10 mL of sample. The calculation of the recovery percentage was made according to IUPAC.19
SI methodology provided recovery ratios with an average of 99.6% (standard deviation 4.8) for the direct determination and 102% (standard deviation 5.1) for the kinetic determination. Statistical test (t-test) was used to evaluate if the mean recovery value did not significantly differ from 100%.20 Results showed that the recovery
values did not differ from 100% at a 95% significance level: the calculated t-value for the direct methodology was 0.338 with a correspondent critical value of 2.09 and the calculated t-value for the kinetic methodology was 2.02 with a correspondent critical value of 2.39, thus indicating the absence of multiplicative matrix interference.
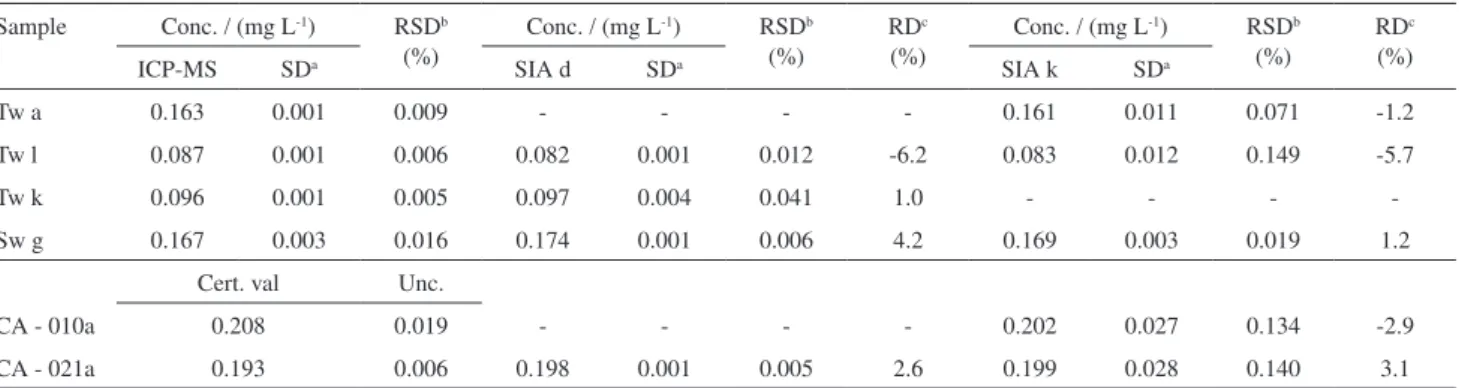
Some water samples were also analysed by ICP-MS reference method5 and by both the developed SI methods:
direct (SI d) and kinetic (SI k) determination, the results shown in Table 3.
The accuracy of the developed methodologies can be observed through the relative standard deviations obtained.
Additionally the developed methods were also applied to aluminium determination in a couple of reference water samples: CA021a and CA010a (Table 3) and the certified value compared to the value obtained with each of the SI methods developed.
Application to coloured samples and effluents streams
Using the kinetic SI methodology, aluminium determination was carried out in coloured water samples
Figure 4. Influence of the propelling time on the sensitivity of the kinetic determination; the point in black represents the chosen time 21 s.
Table 2. Application of the developed SI systems with direct and kinetic determination to spiked water samples
Method Water source
Sample Initial Added Found Recovery/
(%) Conc./(mg L-1) SDa/(mg L-1) RSDb/(%) Conc./(mg L-1) Conc./(mg L-1) SDa/(mg L-1) RSDb/(%)
Direct Tap Tw A 0.118 0.002 1.7 0.150 0.268 0.008 3.0 100
Tw B 0.079 0.001 1.3 0.150 0.217 0.003 1.4 92.0
0.079 0.001 1.3 0.300 0.367 0.003 0.8 96.0
Tw C 0.106 0.003 2.8 0.150 0.253 0.003 1.2 98.0
Tw D 0.123 0.003 2.4 0.150 0.276 0.003 1.1 102
Tw E 0.118 0.005 4.2 0.150 0.257 0.003 1.2 92.7
Surface Sw A 0.165 0.002 1.2 0.200 0.360 0.005 1.4 97.5
Sw B < LOQ - - 0.200 0.199 0.013 6.5 99.5
< LOQ - - 0.400 0.390 0.005 1.3 97.5
Sw C 0.052 0.001 1.9 0.200 0.276 0.001 0.4 112
0.052 0.001 1.9 0.400 0.446 0.004 0.9 98.5
Sw D < LOQ - - 0.150 0.148 0.004 2.7 98.7
< LOQ - - 0.300 0.298 0.001 0.3 99.3
Sw E < LOQ - - 0.150 0.159 0.002 1.3 106
< LOQ - - 0.300 0.305 0.002 0.7 102
Mineral Mw A 0.042 0.002 4.8 0.075 0.113 0.002 1.8 94.7
0.042 0.002 4.8 0.150 0.187 0.001 0.5 96.7
0.042 0.002 4.8 0.300 0.356 0.004 1.1 105
Mw B < LOQ - - 0.075 0.074 0.003 4.1 98.7
< LOQ - - 0.240 0.256 0.002 0.8 107
Kinetic Tap Tw 1 0.192 0.013 6.9 0.020 0.211 0.010 4.5 95.0
0.192 0.001 0.5 0.040 0.232 0.003 1.3 100
Tw 2 < LOQ - - 0.080 0.079 0.007 8.5 98.3
< LOQ - - 0.120 0.121 0.006 4.9 100
Tw 3 0.104 0.004 3.4 0.080 0.186 0.005 2.4 103
0.104 0.004 3.4 0.120 0.227 0.005 2.0 103
Tw 4 < LOQ - - 0.080 0.078 0.001 1.3 97.9
< LOQ - - 0.120 0.113 0.001 0.9 94.2
Tw 5 0.062 0.004 7.2 0.080 0.143 0.005 3.1 102
0.062 0.004 7.2 0.120 0.184 0.006 3.2 102
Tw 6 < LOQ - - 0.080 0.086 0.004 4.5 108
< LOQ - - 0.120 0.122 0.005 3.7 102
Ground Gw 1 < LOQ - - 0.080 0.087 0.010 11.0 109
< LOQ - - 0.120 0.118 0.018 15.0 98.3
Gw 2 < LOQ - - 0.080 0.090 0.004 4.9 112
< LOQ - - 0.120 0.119 0.006 5.3 99.2
Gw 3 < LOQ - - 0.080 0.092 0.000 0.0 115
< LOQ - - 0.120 0.123 0.000 0.0 103
Surface Sw 1 0.023 0.002 9.1 0.160 0.198 0.015 7.3 109
Sw 2 <LOQ - - 0.080 0.084 0.003 3.5 105
<LOQ - - 0.120 0.120 0.010 7.9 100
Sw 3 <LOQ - - 0.080 0.080 0.002 2.8 100
<LOQ - - 0.120 0.115 0.003 2.7 95.8
Mineral Mw 1 < LOQ - - 0.200 0.211 0.003 1.4 106
Mw 2 0.061 0.003 5.6 0.080 0.140 0.036 25.9 99.1
Mw 3 < LOQ - - 0.120 0.118 0.007 5.8 98.3
and effluent streams of a water treatment plant. Spectra of the coloured waters and of the effluent samples were traced to assess the wavelength of maximum absorption as well as the intrinsic absorption at the wavelength of the determination, 545 nm (Table 4). As mentioned above some water samples were coloured with dyes: methyl orange, F2, and bromothymol blue, FS; as for water sample R3 it presented an intrinsic absorption.
Recovery studies were performed spiking the samples with volumes from 165 to 385 µL of aluminium stock solution (10 mg L-1) added to 20 or 25 mL of sample and
the results are presented in Table 5.
The kinetic SI methodology applied to samples with intrinsic absorption provided recovery ratios with an average of 100.4% (standard deviation 5.9).
Statistical test (t-test) was used to confirm if the mean recovery value did not significantly differ from 100%.20
Table 5. Application of the developed SI system with kinetic determination to spiked coloured water samples and effluents
Source Sample
Initial Added Found
Recovery/ (%) Conc./
(mg L-1)
SDa/ (mg L-1)
RSDb/ (%)
Conc./ (mg L-1)
Conc./ (mg L-1)
SDa/ (mg L-1)
RSDb/ (%)
Surface water (coloured)
F2 < LOQ - - 0.250 0.243 0.020 8.2 97.2
< LOQ - - 0.350 0.328 0.012 3.7 93.7
FS < LOQ - - 0.165 0.172 0.005 2.7 104
< LOQ - - 0.385 0.394 0.009 2.3 102
F3 < LOQ - - 0.250 0.260 0.023 8.7 104
< LOQ - - 0.330 0.330 0.017 5.0 100
Effluent stream
L1A < LOQ - - 0.165 0.169 0.017 9.8 102.4
< LOQ - - 0.365 0.414 0.018 4.4 113.4
LA < LOQ - - 0.250 0.231 0.000 0.0 92.4
< LOQ - - 0.350 0.338 0.013 3.8 96.6
LA3 0.052 0.009 16.3 0.200 0.248 0.009 3.4 97.9
astandard deviation (3 replicates); brelative standard deviation.
Table 4. Assessment of both the wavelength of maximum absorption (λmax.) and the intrinsic absorption at that wavelength and at 545 nm (the wavelength of the determination) for the coloured water samples and effluent samples
Source Sample λmax / (nm) Absorbance λmax λ545 nm
Surface water (coloured)
F2 507 0.819 0.532
FS 402 0.109 0.014
R3 525 0.036 0.004
Effluent stream
L1A 400 1.942 0.393
LA 400 1.800 0.354
LA3 400 0.176 0.033
Table 3. Application of the developed SI methods, with direct (SI d) and kinetic (SI k) determination, to water samples (Tw - tap-water and Sw - surface water) with comparison to ICP-MS and to certified water samples, CA021a and CA010a
Sample Conc. / (mg L-1) RSDb (%)
Conc. / (mg L-1) RSDb (%)
RDc (%)
Conc. / (mg L-1) RSDb (%)
RDc (%)
ICP-MS SDa SIA d SDa SIA k SDa
Tw a 0.163 0.001 0.009 - - - - 0.161 0.011 0.071 -1.2
Tw l 0.087 0.001 0.006 0.082 0.001 0.012 -6.2 0.083 0.012 0.149 -5.7
Tw k 0.096 0.001 0.005 0.097 0.004 0.041 1.0 - - -
-Sw g 0.167 0.003 0.016 0.174 0.001 0.006 4.2 0.169 0.003 0.019 1.2
Cert. val Unc.
CA - 010a 0.208 0.019 - - - - 0.202 0.027 0.134 -2.9
CA - 021a 0.193 0.006 0.198 0.001 0.005 2.6 0.199 0.028 0.140 3.1
astandard deviation (3 replicates); brelative standard deviation; crelative deviation.
2.63, thus indicating the absence of multiplicative matrix interference.
Features of the system
The main features of both methodologies developed, a direct and a kinetic colorimetric determination of aluminium, are summarised in Table 6. A typical calibration curve was calculated as a mean of four calibration curves, for both methodologies SI d and SI k:
SI d: A = 1.366 (± 0.049) mg Al L-1 – 0.126 (± 0.005);
R2 = 0.998 (± 0.002)
SI k: ΔA/Δt = 1.2 (± 0.2) mg Al L-1 – 0.00 (± 0.01);
R2 = 0.993 (± 0.002)
the values in brackets represent the standard deviation. The detection and quantification limits presented in Table 6 were calculated according to IUPAC recommendations.21
An analytical cycle is the sum of the time needed for each step plus the time necessary for the port selection in the selection valve. Thus, the sampling frequency was calculated based on the time spent per cycle and presented in determinations per hour.
The features shown in Table 6 correspond to sample consumption per determination of 0.470 mL of water sample and to overall reagent consumption per determination of: 46 µg CAS; 3.75 mg sodium acetate; 25 µg ascorbic acid.
Conclusions
A spectrophotometric alternative for the determination of aluminium was presented enabling the screening of aluminium in water samples without any previous treatment. The dynamic range enables the quantification of aluminium within the allowed limits as it includes the range of the enforceable standards. The chosen SI methodologies proved highly valuable in terms of versatility allowing both the interference minimization and the possibility of either direct or kinetic determination of aluminium. The possibility of comprising, within the same manifold,
both methods of determination enables the application of the developed work to all types of water including the treatment plant waters that may present colour or intrinsic absorption (due to suspended solids). Other advantages of the developed SI methodology are the overall reagent and sample consumption being quite low and the high degree of automation achieved.
Acknowledgments
The authors thank Fundação para a Ciência e a Tecnologia (FCT) for financial support through Project PTDC/AMB/64441/2006. R. B. R. Mesquita acknowledges financial support from FCT for the grant SFRH/BPD/41859/2007.
References
1. http://www.epa.gov/safewater/mcl.html, accessed in July 2006.
2. http://www.alzscot.org/pages/info/aluminium.htm, accessed in July 2006.
3. http://www.world-aluminium.org/, accessed in July 2006. 4. World Health Organization; Guidelines for Drinking-Water
Quality, Addendum to Vol.2. Health Criteria and Other Supporting Information, 2nd ed.; World Health Organization:
Geneva, 1998.
5. APHA-AWWA-WPCF; Standard Methods for the Examination of Water and Wastewater, 20th ed., American Public Health
Association: Washington DC, 1998.
6. Albendín, G.; Mánuel-Vez, M. P.; Moreno, C.; García-Vargas, M.; Talanta2003, 60, 425.
7. Rama, M. J. R.; Medina, A. R.; Díaz, A. M; Talanta2004, 62, 879.
8. Armas, G.; Miro, M.; Cladera, A.; Estela, J. M.; Cerdà, V.; Anal. Chim Acta2002, 455, 149.
9. Brach-Papa, C.; Coulomb, B.; Boudenne, J.-L.; Cerdà, V.; Theraulaz, F.; Anal. Chim. Acta2002, 457, 311.
10. Wauer, G.; Heckemann, H.-J.; Koschel, R.; Microchim. Acta 2004, 146, 149.
11. Quintela, M. J.; Gallego, M.; Valcárcel, M.; Analyst1993, 118, 1199.
12. R∅yset, O.; Anal. Chem. 1987, 59, 899.
Table 6. Features of the developed SI methods, with direct (SI d) and kinetic (SI k) determination
Method Dynamic concentration range / (mg L-1)
LODa / (mg L-1) LOQb / (mg L-1) Analytical cycle / (min)
Sample frequency / (det h-1)
Efluent volume / (mL)
Sl d 0.040-0.500 0.200 0.030 1.05 57 2.8
Sl k 0.050-0.300 0.012 0.033 1.93 31 3.4
13. R∅yset, O.; Anal. Chim. Acta1986, 185, 75.
14. Clarke, N.; Danielson, L.-G; Anal. Chim. Acta1995, 306, 5. 15. Bouzid, B.; MacDonald, A.M.G.; Anal. Chim. Acta1988, 207,
337.
16. R∅yset, O.; Anal. Chim. Acta1985, 178, 223. 17. Pakalns, P.; Anal. Chim. Acta1965, 32, 57.
18. Mesquita, R. B. R.; Rangel, A. O. S. S.; Anal. Sci.2004, 20, 1205.
19. International Union of Pure and Applied Chemistry; Pure Appl. Chem.2002, 74, 2201.
20. Miller, J. C.; Miller, J. N.; Statistics for Analytical Chemistry, 3rd ed., Ellis Horwood: New York, 1993.
21. International Union of Pure and Applied Chemistry; Anal. Chem.1976, 48, 2294.