UNIVERSIDADE DO ALGARVE
Faculdade de Ciências e Tecnologia
2017
Antioxidant Contents of Fucus vesiculosus L., in Response to
Environmental Parameters
Mestrado em Aquacultura e Pescas
Trabalho efetuado sob a orientação de:
Susan L. Holdt
1Ester A. Serrão
21 DTU Fødevareinstituttet, Technical University of Denmark, Kemitorvet, Bygning 202, DK-2800
Kgs Lyngby, Denmark.
2 Universidade do Algarve, CCMAR, Campus de Gambelas, P-8005-139 Faro, Portugal.
Antioxidant Contents of Fucus vesiculosus L., in Response to
Environmental Parameters
MADALENA CARIA MENDES
UNIVERSIDADE DO ALGARVE
Faculdade de Ciências e Tecnologia
2017
Declaração de Autoria
Declaro ser a autora deste trabalho, que é original e inédito. Autores e trabalhos consultados estão devidamente citados no texto e constam da listagem de referências incluída.
Copyright Madalena Caria Mendes
A Universidade do Algarve reserva para si o direito, em conformidade com o disposto no Código do Direito de Autor e dos Direitos Conexos, de arquivar, reproduzir e publicar a obra, independentemente do meio utilizado, bem como de a divulgar através de repositórios científicos e de admitir a sua cópia e distribuição para fins meramente educacionais ou de investigação e não comerciais, conquanto seja dado o devido crédito ao autor e editor respetivos.
Acknowledgements
This thesis entitled Antioxidant contents of Fucus vesiculosus L., in response to environmental parameters was conducted at the Research Group for Bioactives, analysis and applications, at the National Food Institute, Technical University of Denmark, under the Erasmus + traineeship program. I would like to thank my dear supervisors, for their great supervision, guidance and seaweed knowledge, Professors Susan L. Holdt and Ester
A. Serrão, as well as my co-supervisor Gonçalo S. Marinho, Ph. D. Unfortunately, UAlg
regulations prevent Gonçalo from officially being listed as a supervisor, despite his fundamental role in the supervision of this project in all possible aspects and being my right hand in the lab, this thesis would not have been possible without him.
Furthermore, I am extremely grateful to all who contributed to this project: Anita Ljubic for her magical vitamin solution for my Fucus experiment
Ann-Dorit Sørensen and Pedro Moreno for helping me with the antioxidant assays Braís Lopez for lending me his microscope to take physodes and epiphyte pictures Handyman Claus Reesbøll for his availability and technical help in mounting the
experimental setup
Ditte Hermund for her help both in the lab and in knowledge sharing, of all things antioxidant related, and her overall joyful personality
Elsa Cabrita for helping me find a thesis subject, for all her guidance and support as my master’s coordinator and teacher
Fedekar F. Madkour, José Avila-Peltroche and Razy Hoffman for their expertise in epiphytes species identification
Hanne Stampe-Villadsen for her company and kindness during the many hours spent reading antioxidant assays in her lab
Food technician René Thrane for performing the freeze-drying process
Urd Bak for her knowledge sharing and for taking me on a seaweed adventure in the Faroe Islands
Laboratory technicians Inge Holmberg, Lis Berner, Sevda Seker, and Trang Vu for their aid and expertise in laboratory analysis
Ruifen Li my first friend and favorite lab buddy who helped me settle in with the work To all my colleagues from the Bioactive group, for being so welcoming, high spirited,
for shared kage and salads, tusind tak! A special thank you to Charlotte Jacobsen the coolest boss ever
I would also like to thank the DTU Choir and my Danish Skovfryd family, for their friendship and for making my Erasmus experience so much fun. To Aquagroupies for the laughs and motivation and to my closest friends João Pedro Meireles, Maria Santos, and
Potatoes for their loving support. Agradeço à minha querida família, Mãe, Pai, mano Miguel, Luka e Saltitão por me aturarem e me desafiarem a dar o melhor de mim.
Lastly, to my best friend Fluffy for being my rock. Madalena Caria Mendes
Abbreviations
Butylated hydroxyl anisole Butylated hydroxytoluene Diode array detector
α,α-diphenyl-β-picrylhydrazyl Ethanol
Folin-Ciocalteu’s phenol reagent Gallic acid equivalent
Hydrochloric acid
High performance liquid chromatography Mixed-mode cation exchange
Methanol
Mass spectrometry Nanometers
Nuclear magnetic resonance Photosynthetically active radiation N-propyl gallate
Practical Salinity Unit
Quantitative H nuclear magnetic resonance spectroscopy Reactive oxygen species
Reverse phase high performance liquid chromatography Solid liquid extraction
Tertiary butyl hydroquinone Total phenolic contents Ultraviolet BHA BHT DAD DPPH EtOH FC GAE HCl HPLC MCX MeOH MS nm NMR PAR PG PSU qHNMR ROS RP-HPLC SLE TBHQ TPC UV
Nomenclature
Absorbance of sample control Absorbance of sample blank Absorbance of sample
Peak area of the internal standard in the extraction solvent Peak area
Peak area of the internal standard in the sample Acetone extracts
Concentration of each individual peak of phenolic compound Individual peak of pigment
Dry weight Dry matter
Effective concentration to inhibit xx%
Ethyl acetate fractions of liquid-liquid partitioning Ethanol extracts
Methanol extracts Weight of the sample Pigment
Response factor of pigment Pi Time in days
Amount of sample injected onto the column Extraction volume
Water extracts Wet weight Final wet weight Initial wet weight A0 Ab As Ac APi As ae Cphenolic cpi dw dm ECxx eaf ee me Mf Pi RPi T Vc Vx we ww wwi wwi
Abstract
Seaweed are a diverse group of algae with great value and vast application possibilities. The seaweed Fucus vesiculosus, stands out for having elevated concentrations of polyphenols and antioxidant activities. Polyphenols possess many biological properties including antioxidant, antimicrobial, anti-inflammatory, and free radical scavenging activities. Therefore, this species is a possible candidate as natural source of bioactive compounds for the development of novel products to be applied in the nutraceutical, pharmaceutical, and cosmetic industries, in the future. This project aimed to investigate the effects of seasonality, and culture conditions such as salinity and ultraviolet radiation (UV) on the antioxidant contents and in vitro properties of F. vesiculosus. This was carried out through spectrophotometric analysis, namely total phenolic contents (TPC), high performance liquid chromatography (HPLC), α,α-diphenyl-β-picrylhydrazyl (DPPH) radical scavenging activity and iron chelating capacity. Furthermore, the epiphytic algae coverage was determined and physodes (structures containing phenolics) were investigated microscopically through vanillin-HCL staining.
This information was used to identify the best harvest time targeting the highest concentration of antioxidants, which was hypothesized to be in late summer-early autumn, due to the protection against UV-irradiation over summer by phenolic accumulation. Significant differences supporting seasonality in antioxidants were found. Late Spring to early Fall had the highest extraction yields (P»0.0045) and concentrations (P< 0.0010) in contrast to the lowest winter concentrations. A total of 13 monophenolic acids were detected through RP-HPLC, with September samples being the most diverse in compounds and March samples the least. Gallic acid was identified in all analyzed months. Furthermore, antioxidant contents and activity was linked to environmental parameters, namely positive correlations between temperature, TPC (P= 0.0391) and DPPH (P= 0.0016); likewise, between sunlight hours per day, TPC (P= 0.0458) and DPPH (P=0.0060). During experimental growth trials, three salinity concentrations and presence of UV light were tested, to verify or reject the second hypothesis: increasing salinity and exposure to UV light would yield higher polyphenolic concentrations. No significant differences were observed between the TPC and salinity (P=0.0525), and light (P=0.2443), under the experimental conditions tested. Regarding growth rate there were significant differences between different salinities (P=0.0216). Lastly, physodes were observed to test a third hypothesis inquiring on their location within tissues. Microscopic images revealed that physodes were distributed mainly in the outer layers of the blades, epidermis and outer cortical layers, serving as a shield effect.
Resumo
As algas são um grupo diversificado de organismos muito valorizado com várias aplicações, que atualmente constituem um recurso marinho sub-explorado. O grupo das algas castanhas é conhecido pelo seu elevado valor nutricional incluindo vários compostos bioativos, na sua composição. Dentro deste grupo, a espécie Fucus vesiculosus, ou Bodelha, destaca-se por ter uma atividade antioxidante forte, associada a elevados níveis de polifenóis. Os polifenóis pertencem a uma classe de moléculas que possuem muitas propriedades biológicas, incluindo atividade antioxidante, antimicrobiana, anti-inflamatória e de eliminação de radicais livres. Assim, esta espécie representa uma escolha plausível para o desenvolvimento de novos produtos a serem aplicados na indústria nutracêutica, farmacêutica e cosmética, futuramente. Esta tese de mestrado teve como objetivo analisar a variação de conteúdos antioxidantes, através da identificação, quantificação e caracterização das propriedades in vitro de polifenóis, na macroalga F. vesiculosus. Nomeadamente através de uma análise espectrofotométrica, HPLC e TPC, do método do radical DPPH e da medição da atividade quelante de ferro. O projeto dividiu-se em duas etapas principais: sendo o primeiro o mapeamento das variações sazonais no conteúdo de polifenóis e atividade antioxidante em amostras de populações naturais. E a segunda, a identificação das condições de cultura ótimas, nomeadamente, salinidade e exposição a radiação UV, numa experiência à escala de laboratório, de forma a otimizar a concentração de polifenóis. Adicionalmente, as algas epífitas e os físodos foram observados ao microscópio ótico. Os físodos são vesículas que contém os polifenóis na célula vegetal e a técnica de coloração com vanilina-HCL permite a sua observação.
A alga F. vesiculosus foi amostrada mensalmente da praia Bellevue, a norte de Copenhaga, na Dinamarca, contemplando as diferentes estações de um ano completo. Pigmentos e polifenóis foram extraídos de algas previamente liofilizadas. Estes compostos foram identificados (sempre que possível), quantificados e caracterizados através de ensaios antioxidantes. Esta informação foi utilizada para identificar o melhor período de colheita desta espécie de alga, visando uma maior concentração em compostos antioxidantes. Este período foi considerado como hipótese sendo no final de verão - início de outono, devido à acumulação destes compostos durante o verão, que servem como proteção contra as radiações ultravioletas. Foram obtidas diferenças significativas que evidenciam a sazonalidade em antioxidantes nesta espécie. Os produtos de extração (P»0.0045) e concentração de polifenóis
em contraste com os meses de inverno, com os valores mais baixos. O número e tipo de pigmento manteve-se constante ao longo de todas as estações, estando sempre oito picos em cada cromatograma. Os pigmentos foram identificados como duas clorófilas, (clorofila C2 e
clorofila-a) e seis carótenoides (fucoxantina, Prasinaxantina, dinoxantina, Diatoxanthin, Zeaxantina a carotenos a+b). Os pigmentos demonstraram sazonalidade quantitativamente, sendo que a sua concentração aumenta do verão para o inverno e primavera, de forma a compensar a diminuição de luz disponível. Foram detectados 13 ácidos monofenólicos, através da análise de UV RP-HPLC, setembro foi o mês com maior diversidade de compostos e março o de menor diversidade. Ácido gálico foi identificado e estava presente em todos os meses analisados. Os conteúdos antioxidantes e a atividade antioxidante demonstraram correlação positiva com parâmetros ambientais, nomeadamente correlações positivas entre a temperatura, TPC (P= 0,0391) e DPPH (P= 0,0016); bem como entre as horas de luz solar, TPC (P= 0,0458) e DPPH (P= 0,0060).
Durante o ensaio experimental, foram testadas três concentrações de salinidade (»13, 28 e 40 PSU) e ainda a exposição a radiação UV, para verificar ou rejeitar a segunda hipótese deste projeto, de que com o aumento das variáveis em questão, seria possível otimizar a concentrações de polifenóis. Não foram observadas diferenças significativas entre os tratamentos para a TPC relativamente à salinidade (P=0.0525) e à luz (P=0.2443), nas condições experimentais testadas. Houve diferenças significativas entre a taxa de crescimento dos tratamentos para diferentes salinidades (P=0.0216). No decorrer da experiência, problemas em manter os níveis de salinidade constante poderão ter influenciado os resultados obtidos. Por último, físodos foram observados microscopicamente para testar a terceira hipótese, que inquiria sobre a sua localização nos tecidos. Imagens microscópicas revelaram um efeito de escudo, uma vez que os físodos se encontram distribuídos principalmente nas camadas externas das algas: na epiderme e camadas corticais externas. Os meses de verão coincidiram com a altura de maior incidência de algas epífitas, das quais três espécies foram encontradas a crescer sobre F. vesiculosus (verde, castanha e vermelha). A herbivoría e o parasitismo de organismos epífitos sobre esta alga é também um dos motivos descritos noutros estudos para justificar o aumento das concentrações de polifenóis durante os meses de verão.
Table of Contents
Declaração de Autoria ... i Acknowledgements ... iii Abbreviations ... v Nomenclature ... vii Abstract ... ix Resumo ... xi List of Figures ... xvList of Tables ... xvii
Introduction ... 1
1.1 Seaweed biology and distribution ... 1
1.2 Seaweed aquaculture ... 1
1.3 The search for novel bioactive compounds ... 2
1.4 Study species ... 3 1.4.1 Life cycle ... 4 1.4.2 Geographic distribution ... 5 1.4.3 Cultivation ... 5 1.5 Antioxidant compounds ... 6 1.5.1 Pigments ... 6 1.5.2 Polyphenols ... 7 1.5.3 Extraction methods ... 11
1.5.4 Identification and quantification ... 11
1.5.5 Antioxidant activity assays ... 12
Objectives ... 13 1.1 Hypotheses ... 13 1.2 Learning objectives ... 14 1.3 Fluxogram ... 15 Methodology ... 17 1.1 Sampling ... 17
1.3 Dry matter and ash contents ... 18
1.4 Antioxidant profiling ... 19
1.4.1 Extraction ... 19
1.4.2 Identification and quantification of Pigments ... 20
1.4.3 Identification and quantification of Phenolic compounds ... 21
1.4.4 Determination of TPC ... 22
1.4.5 In vitro antioxidant capacity assays ... 22
1.5 Optimization of Polyphenols ... 24
1.6 Microscopic observation ... 25
1.6.1 Physodes ... 25
1.6.1 Epiphytes ... 25
1.7 Data treatment ... 26
Results and discussion ... 27
1.1 Dry matter and ash contents ... 27
1.2 Antioxidant profiling ... 28
1.2.1 Extraction ... 28
1.2.2 Identification and quantification of pigments ... 29
1.2.3 Identification and quantification of Phenolic compounds ... 31
1.2.4 TPC and in vitro antioxidant capacity assays ... 33
1.3 Optimization of Polyphenols ... 38
1.4 Microscopic observation ... 40
1.4.1 Physodes ... 40
1.4.2 Epiphytes ... 41
Conclusions and Future Perspectives ... 43
References ... 45
Annex ... 49
A. Environmental data ... 49
B. Dry matter, ash contents and extraction ... 50
List of Figures
Figure 1 Structure of a mature F. vesiculosus thallus. Adapted from (Evert and Eichhorn, 2013, Hermund et al., 2016). ... 3 Figure 2 The life cycle of Bladderwrack (F. vesiculosus). Sperm from the male thallus fertilizes the egg that is released from the female thallus and forms a zygote that will attach to a substrate and grow into a new individual. ÓMadalena Mendes ... 4 Figure 3 Polyphenols classification based on Pandem et al. (2009), Tsao (2010) and IUPAC (2014). . 7 Figure 4 Arrangement of tissues in the F. vesiculosus frond, seen in a transversal section. Adapted from (Evert & Eichhorn 2013; Hermund et al. 2016). ... 10 Figure 5. Collection of biomass at Bellevue beach, Denmark. Ó Madalena Mendes ... 14 Figure 6 Overview of the main stages of this thesis. ... 15 Figure 7 a) Wild F. vesiculosus frond Ó Madalena Mendes. b) Sampling location, Bellevue beach, Denmark Ó Google. ... 17 Figure 8 Freeze dried F. vesiculosus collected at Bellevue beach in June 2016. ... 18 Figure 9 Crucibles with dried seaweed powder biomass: a) dry matter and b) ash ... 18 Figure 10 Polyphenol extraction process after nitrogen flow: a) test tubes with me b) Test tubes with me after removal of pigments with the OASIS MCX cartridge. ... 19 Figure 11 HPLC-DAD analysis (255 nm) of standard mix. UV chromatogram with labeled peaks according to the compound they represent. ... 21 Figure 12 Experimental setup for the optimization of polyphenols in F. vesiculosus, regarding photoperiod, type of lighting (L1: PAR and L2: UV-A) and salinity gradient (S20; S30; S40 PSU). ... 24 Figure 13 Transversal section of F. vesiculosus apical region: a) before vanillin-HCL staining and b) after vanillin-HCL staining observed under light microscopy. Scale in pixels.ã Madalena Mendes ... 25 Figure 14 Biomass characterization of F. vesiculosus seasonal samples, regarding dry matter and ash contents. ... 27 Figure 15 Fucus vesiculosus me absolute yield from initial dm of seaweed over the season June 2016 to May 2017. ... 28
Figure 16 Pigment contents. Top: Seasonal variation in pigments. Bottom: HPLC-DAD analysis (440 nm) of pigments in F. vesiculosus extracts, from May 2017. Peak numbers refer to the compounds in Table 2. ... 29 Figure 17 HPLC-DAD analysis (255 nm) of phenolic compounds in F. vesiculosus extracts, from May 2017. Peak numbers refer to the compounds in Table 2. UV chromatograms for polyphenols. Top to bottom: September, November; January and March. ... 31 Figure 18 TPC from F. vesiculosus extracts, expressed as GAE, from June 2016 to May 2017. ... 34 Figure 19 DPPH radical scavenging activity expressed as 1/EC50, from June 2017 to May 2017. There
is no data for March. ... 35 Figure 20 Left) UV-dose index for the year 2017 retrieved from DMI (Cappelen 2017). Right) Representation of antioxidant assays, (TPC and DPPH radical scavenging activity) and environmental parameters (mean temperature and sunlight), corresponding to data from June 2016 to May 2017 (Cappelen 2017) ... 36 Figure 21 TPC expressed in GAE of F. vesiculosus extracts and growth rate expressed in percentage per day during the experimental trial, where three salinity concentrations and two light conditions were tested. ... 38 Figure 22 Experimental setup. Erlenmeyer flasks under PAR and UVA light. ãMadalena Mendes .. 39 Figure 23 Transverse sections of F. vesiculosus taken from the light and salinity experiment: a) PAR.20; b) PAR+UV.20; c-e) UV.30; f) PAR+UV.40. Scales are in pixels. Ó Madalena Mendes ... 40 Figure 24 F. vesiculosus epiphytes May 2017 a-b) Chlorophyta, Rhizoclonium sp; c-d) Phaeophyceae, Ectocarpus siliculosus; e-f) Rhodophyta, Polysiphonia sp. Scales are in pixels. Ó Madalena Mendes ... 41 Figure 25 Sampling at Bellevue beach in January 2017.ã Madalena Mendes ... 44
Figure A. 1 HPLC-DAD analysis (440 nm) of pigments in F. vesiculosus extracts. Top to bottom: September, November (2016), January, March and May (2017). ... 51
List of Tables
Table 1. Distribution of phenolic compounds in Phaeophyceae. Adapted from (Stengel et al. 2011; Parys et al. 2010; Fernando et al. 2016; Wang et al. 2009). ... 9 Table 2 Pigment contents expressed in µg.mg dm-1from July 2016 to May 2017. Values are mean ±
SD (n=3). ... 30 Table 3 Polyphenol contents analyzed by RP-HPLC, from September 2016 to March 2017. Unidentified polyphenol peaks and respective retention time (min) phenolic contents expressed in mg GAE. 100 mg dm-1. ... 32 Table 4 Characterization of F. vesiculosus extracts by SLE from June 2016 to May 2017. TPC and in vitro antioxidant properties determined by 1/ECxx values (DPPH radical scavenging activity and iron chelating ability). ... 33 Table 5 Experimental trial regarding light and salinity concentrations. Salinity values registered during the trial are given in PSU, growth rate in percentage and TPC in GAE. Values are mean ± SD (n=3). ... 39
Table A. 1 Data from the Danish Meteorological Institute (Cappelen 2017). Monthly averages of mean temperature (ºC), precipitation (mm) and sunlight (h) were taken from June to August 2016 (*; Denmark) and from September 2016 to May 2017 (Lyngby-Tårbæk, the sampling location). ... 49 Table A. 2 Biomass characterization of F. vesiculosus seasonal samples, regarding dry weight, dry matter and ash contents, expressed as percentages. Mean ±SD. ... 50 Table A. 3 Absolute extraction yield of me (%) before and after OASIS column. ... 50 Table A. 4 TPC, antioxidant activity assays and environmental data Pearson correlation matrix. ... 52 Table A. 5 TPC, antioxidant activity assays and environmental data Pearson correlation matrix
Introduction
1.1 Seaweed biology and distribution
Seaweed are a diverse group of marine macroalgae, divided into three major groups: Chlorophyta (Green), Rhodophyta (Red) and Phaeophyceae (Brown), depending on their dominant pigments and preferred wavelength absorption (Makkar et al., 2016, Baweja et al., 2016). They are key elements in aquatic ecosystems given their role as primary producers, utilizing carbon dioxide, water and light energy for photosynthesis, yielding organic carbohydrates, and making biomass building blocks by assimilating nutrients such as nitrogen and phosphorous. Not only are they responsible for producing a large percentage of atmospheric oxygen, but also sustaining complex food webs (Roff et al., 2011).
Seaweed typically inhabit the rocky shores of coastal ecosystems, including the intertidal and the shallow subtidal, within the temperate and polar regions (Guiry, 2015). In these zones, they are faced with extreme conditions as a result of the tidal cycle, which they endure by anchoring themselves to the substrate by means of holdfasts (Guiry, 2015, Baweja et al., 2016). Their vertical distribution is closely related to photosynthesis light requirements; thus, most are constricted from 8 to 40 m in depth. Still, in very clear waters they can go up to 250 m deep, this is the case in some regions of the Mediterranean, Caribbean and Brazil (Guiry, 2015). The photosynthetic pigments of each algal group, spectral distribution and light intensity are limiting factors in growth and decisive for zonation (Kanaizuka et al., 2002). Characteristically, green seaweed inhabit the upper shallow zones, because of their greater need for light availability; brown seaweed tolerate less light than green, so they are placed in the middle, although many possess gas filled pouches to float at the surface; red seaweed can withstand the greatest depths, since they have adapted pigments to make use of blue light, which penetrates deeper in the water column (Baweja et al., 2016, Guiry, 2015, Kanaizuka et al., 2002).
1.2 Seaweed aquaculture
Seaweed have been used worldwide for thousands of years, predominantly in Asian countries, and are currently estimated in a total annual value of US$ 5.5-6 billion corresponding to 7.5-8 million tonnes of wet seaweed (McHugh, 2003). Seaweed farming has been growing rapidly, and is expected to continue, to meet the increasing demand for food, fuels, bioactive compounds and enhanced health functional food products (Tiwari and Troy,
2015, FAO, 2016). In China, Japan, and the Republic of Korea, seaweed have been a traditional food source for over 2000 years, contrarily to western countries, where their utilization is mainly for non-food applications (Tiwari and Troy, 2015). Asian countries dominate the worldwide production of seaweed (99%) being China the main producer, followed by Korea and Japan. In European countries seaweed are largely underexploited resources: wild harvesting and aquaculture is only 0.009% of the total worldwide production, and accounts to 0.08% of the annual value, the main producers are from France and Norway (Farvin and Jacobsen, 2013, Hoefnagel, 1991, FAO, 2017).
1.3 The search for novel bioactive compounds
Antioxidants are widely used by the food, cosmetic and nutraceutical industries to enhance the oxidative stability of lipid rich products. The use of synthetic antioxidants, such as butylated hydroxyanisole (BHA) and butylated hydroxytoluene (BHT), has raised some concerns due to their health risks and toxicity. This has led to the search of novel plant-based natural sources of antioxidants (Hermund et al., 2016). Seaweed are sources of polysaccharides, minerals, vitamins and bioactive compounds, such as sulphated polysaccharides, peptides, amino acids, lipids and polyphenols (Holdt and Kraan, 2011). Therefore, they hold a great potential for the extraction of high-value products with biological activities, that can be applied in the nutraceutical, pharmaceutical, and cosmetic industries (Fernando et al., 2016). Research on the factors contributing to bioactive compounds variation, in natural and cultivated algae, is important since bioactivity is many times extract-specific and varies with location, growth conditions, seasonality and species (Stengel et al., 2011) .
Brown algae are particularly interesting for having a wide range of bioactive compounds and high nutritional value, and are recognized as rich sources of biologically active phenolic compounds (Hermund et al., 2016, Fernando et al., 2016). Currently, they are most known for their alginates (polysaccharides), used for commodities such as stabilising agents, but also in the pharmaceutical and health industries (McHugh, 2003). Worldwide biomass collected from the wild or cultivated is coming from a few species of the orders Laminariales and Fucales, and are valued in about US$ 300 million per year (Guiry, 2015). Fucus vesiculosus is one of the most common species in the North Sea and Danish inner waters and is a promising resource due to elevated levels of total phenolic compounds, and higher antioxidant activities, compared to both red or green algae (Hermund et al., 2016).
1.4 Study species
The study species, F. vesiculosus, also known as Bladderwrack (this species) or Rockweed (Fucus species in general), belongs to the brown algal class, a group with high nutritional value and content of a wide range of bioactive compounds (Holdt and Kraan, 2011). It is especially rich in polyphenolic compounds and excels in scavenging activities (Wang et al., 2009). The basic form of the brown alga is the thallus, a simple, relatively undifferentiated vegetative body, divided into three basic structural units, holdfast, stipe and blades (Figure 1). The disc shaped holdfast is firmly attached to a substrate; the stipe is prominent, flexible, and connects the holdfast to the blades and fronds, which are dichotomously branched and have a tough leather-like surface to endure wave action. In the blades, there are characteristic gas vesicles or air bladders (usually paired) that may be absent in smaller individuals and in exposed shores. They help maintain the blades at the surface for better light exposure and improve photosynthesis. Fertile fronds have fruiting bodies, the receptacles, with several conceptacles inside (Evert and Eichhorn, 2013, Guiry and Guiry, 2016, White, 2008).
The presence of this species is predominantly along rocky and stony coasts, usually appearing highly concentrated and widely distributed. It is one of the most important phytobenthic species of the Baltic, providing habitat for species-rich epiphytic and epibenthic communities (Torn et al., 2006). It prefers salty, brackish waters and sheltered rocky shores, and is also associated to cold water patches from spring–summer upwelling (Guiry, 2015, Viana et al., 2015, Plass, 2013).
1.4.1 Life cycle
In the Baltic Sea, F. vesiculosus exhibits two periods of reproduction, the most pronounced is during early summer (May to June) but can also occur in late autumn (September to November) (Berger et al., 2001). The life cycle of F. vesiculosus is portrayed in Figure 2, they are dioecious (male and female individuals) and have a gametic life cycle, meiosis occurs before the gamete formation and the zygote and adult are diploid (2n) (Evert and Eichhorn, 2013). Gametes are produced in specialized chambers, the conceptacles, located in the receptacles at the tips of fertile fronds (Pearson and Serrão, 2006). During reproductive periods, eggs and sperm are released only in calm waters (Serrao et al., 1996a, Serrão et al., 1999), resulting in up to a million fertilized eggs, per individual (Pearson and Serrão, 2006, Serrao et al., 1996a), except when salinity is limiting to gamete viability (Serrão et al., 1996b, Serrão et al., 1999). The zygote attaches to the substrate within a few hours after release and then grows directly into a young diploid seaweed. Seaweed enter a period of dormancy in winter and new biomass grows slowly, until spring arrives again, and receptacles mature (Serrão et al., 1999). After the reproductive period, the receptacles and parts of the fronds that support it are usually abscised (Berger et al., 2001). The lifespan of this species is around 2 to 3 years in Spain (Viana et al., 2015). Some individuals can have clonal propagation especially in the sheltered conditions of the Baltic, where vegetative propagules can develop rhizoids and attach to substrate given enough time (Tatarenkov et al., 2005).
1.4.2 Geographic distribution
This species occurs in the North Atlantic in coastal regions: in the eastern coast of Canada and North America; around the coastlines of the British Isles, Faroe Islands, Iceland, Morocco, Iberian Peninsula, France, Belgium, the Netherlands and Germany; in Scandinavia and the Baltic sea, as well as some regions of the Arctic including Greenland (Guiry and Guiry, 2016, White, 2008, OBIS, 2017).
1.4.3 Cultivation
There are few experimental data and studies on the cultivation of F. vesiculosus, it has been possible to produce sporophytes from spores in lab cultures, but they die once deployed in the field making it a challenging species to work with. The majority of Fucus species are manually harvested from shores and are currently not farmed at an industrial scale (NetAlgae, 2012). At this stage, offshore cultivation is described by Hermund et al., (2016), as a plausible option for this species. Nevertheless, onshore tank cultivation is also a possibility; it allows a higher control over culture conditions and access to seaweed is easier, which may be very useful if the biomass is meant for high-end applications. Hermund et al., (2016) findings reveal that apical fronds of F. vesiculosus generally have higher polyphenolic contents, which suits a more sustainable cultivation because only young parts need to be harvested, instead of a full removal of the seaweed, and then there is continued vegetative growth of the remaining thalli.
In reference to culture conditions, optimal growth consist of cold water (<18°C), a minimum 8-hour photoperiod, salinities vary from 18-40 PSU, accessible nitrogen, and a suitable substrate for attachment in a sheltered or semi exposed areas, (Hermund et al., 2016, White, 2008). There seem to be no specific nutrient requirements, a temperature of 15 ºC promotes rapid growth; and increased biomass densities in a culture tank significantly limit growth rate (Fulcher and McCully, 1969, McLachlan et al., 1971). The highest relative growth rate of vegetative branches of F. vesiculosus has been reported in the summer months (up to 0.7% per day) compared to winter growth (less than 0.3% per day) in the Northern Baltic (White, 2008). Fulcher and McCully (1969) documented small and slow growth in isolated thalli apices of mature individuals, as well as small portions of thalli lacking apices regenerating with shoots. Individuals are known to easily regenerate new fronds from the holdfast after destructive events (Viana et al., 2015). Fulcher and McCully (1969) further reported improvements in growth by designing an apparatus that enabled alternating periods
of immersion and exposure, just like a tidal cycle in natural conditions. They also obtained low levels of contamination in the system, which they attributed to the antibiotic properties of produced polyphenols. On the other hand, McLachlan et al., (1971) obtained algae comparable in size in less time, when using a submerged culture, finding that the absence of a tidal cycle did not restrain from a successful cultivation. It is relevant to note that within the Baltic Sea there is little or no influence of tidal cycles (Pearson and Serrao, 2006).
1.5 Antioxidant compounds
Bioactive compounds from seaweed that display antioxidant properties are valuable in the sense that they can replace synthetic antioxidants, such as n-propyl gallate, monoglyceride citrate, butylated hydroxyanisole, butylated hydroxytoluene (BHT) and butylated hydroxyquinone, many of which are restricted due to health concerns and toxicity (Cérantola et al., 2006). Moreover, they may be used to replace available natural mono-compound antioxidants, such as tocopherol and ascorbic acid, which are insufficient in most fish-oil-enriched foods (Farvin and Jacobsen, 2013, Hermund et al., 2016). Listed below are some of the commercially relevant applications of seaweed antioxidant extracts. They can be applied in food to avoid lipid oxidation and prolong shelf life, already shown in muesli bars (Hermund et al., 2016). They are fit to be used as supplements in functional foods, pharmaceutical drugs, in cosmetics and skin care industries, for example, as radiation protection agents (Holdt and Kraan, 2011, Parys et al., 2010). The seaweed antioxidants can be beneficial to human health by regulating the balance between reactive oxygen species (ROS) production and scavenging. ROS are highly reactive towards essential biomolecules, hence damaging the integrity of cells (Belda et al., 2016). Lastly, antioxidants serve as defense mechanisms against many diseases, such as cardiovascular diseases, diabetes, cancer, atherosclerosis, aging, and other degenerative diseases (Fernando et al., 2016).
1.5.1 Pigments
Pigments selectively absorb light giving colour to the algae. They also possess antioxidant properties (Raposo et al., 2015). Brown seaweed major accessory pigments are chlorophyll c1 + c2 and xanthophylls, such as fucoxanthin. The abundance of xanthophylls is responsible for the brownish colour and masks the other pigments, chlorophyll-a and –b; β-carotene and other carotenoids (Holdt, 2011). Chlorophyll-a and –b, are responsible for the green colour in plants, and are essential to photosynthesis, since they absorb light and are primary electron donors. Additionally, in certain marine algae, including brown algae, exist
Polyphenols
Phenolic acids
Hydroxycinnamic acid (coumaric, caffeic, ferulic acids)
Hydrobenzoic acids (gallic, protocatechuic, salicylic acid)
Flavonoids
Flavonols (Quercetin, Myricitrin)
Flavones (Apigenin, Luteolin) Isoflavones (Daidzein, Genistein) Flavanones (Hesperidin) Flavanols (Catechins, Condensed Tannis) Anthocyanins (Protoanthocyanidins) Stilbenes (Resveratrol) Lignans (Enterodiol)
Other Phenols (Phlorotannins, Bromophenols)
chlorophyll-c, accessory pigments with a blue-greenish colour. Carotenoids are a family of red yellow and orange lipophilic tetraterpenoids that protect plants against photo-oxidative processes. They are effective free radical scavengers and deactivators, and promote antioxidant interactions with other compounds, which enhances this effect. They are divided into xanthophylls, with oxygen, and carotenes, hydrocarbons without oxygen (Hermund et al., 2016, Safafar et al., 2015).
1.5.2 Polyphenols
Phenolic compounds are a diverse class of biological molecules, produced as secondary metabolites and present in most algal groups (Stengel et al., 2011, Schoenwaelder, 2008, Tsao, 2010). They comprise around 8000 natural occurring compounds, with a hydroxyl group (-OH) bonded directly to an aromatic hydrocarbon group (Fernando et al., 2016, Holdt and Kraan, 2011). They are classified into different groups as a function of the number of phenol rings they contain and on the structural elements that bind these rings to each other (Pandem et al., 2009). The main classes include phenolic acids, flavonoids, stilbenes and lignans (Figure 3).
Often acting as stress compounds and involved in chemical protective mechanisms, they display antioxidant, antimicrobial, anti-inflammatory, and free radical scavenging activities, through single electron transfer and through hydrogen atom transfer (Belda et al., 2016, Fernando et al., 2016, Safafar et al., 2015, Schoenwaelder, 2008). They play an important role in diverse biological processes, including UV photo-protection, polyspermy blocking, trace metal bounding, protection against herbivores, oxidative stress, and injuries (Belda et al., 2016, Pandem et al., 2009, Salgado et al., 2007). Hence, their concentration can be increased by various parameters, both biotic, grazing, settlement of bacteria and other fouling organisms; and abiotic, excessive irradiance from UVA and UVB, metal contamination, as well as osmoregulatory stress from increasing rain or salinity (Ragan and Jensen, 1978, Schoenwaelder, 2008, Stengel et al., 2011). Lower salinity has been associated to a higher concentration of secondary metabolites, and consequently greater antioxidant potency; while higher salinities promote higher concentration of polysaccharides, and less antioxidant power in the species Fucus ceranoides, Linnaeus (Cotas, 2015).
Brown seaweed are rich in different phenolic compounds, some examples are described in Table 1. Bromophenols are common to most seaweed, though it is phlorotannins that make up most of the phenolic compounds of brown algae, going up from 5-30% of the dry weight (dw) of the seaweed (Hefernan et al., 2015, Stengel et al., 2011). Phlorotannins are exclusive to brown seaweed and are divided into numerous classes, depending on the type of linkage between phloroglucinol units (Cérantola et al., 2006, Hefernan et al., 2015). They are characterized by having a molecular mass from 126 Da to 100 kDa; a polymeric structure formed by phenolic oxidative coupling; 14–24 phenolic hydroxyl groups and 5–8 aromatic rings per 1,000 units of relative molecular mass (Hefernan et al., 2015, Martinez and Castaneda, 2013). Exceptionally, they also display primary functions within growth and cell wall development in Fucales, where they are very abundant (Cérantola et al., 2006).Martínez & Castañeda, (2013) divide three main groups of phlorotannins: fucols, phloroethols and fucophloroethols. The first two are constituted of only aryl-aryl and aryl-ether bonds respectively and the latter contains both (Cérantola et al., 2006).
Phenolic compounds Examples
Bromophenols 2-bromophenol, 4-bromophenol, 2,4-dibromophenol, 2,6-dibromophenol, 2,4,6-tribromophenol
C6-C4-C6
metabolite
Colpol, 8,9-dihydrocolpol
Meroditerpenoids Plastoquinones, sargaquinoic acid, sargachromanols, chromene derivatives.
Phenolic acids Gallic, protocatechuic, gentisic, chlorogenic, vanillic, caffeic Phlorotannins Phloroglucinol, phloroglucinol with a C20 acyl side chain, fucols,
fucophlorethols, fuhalols, phlorethols, eckols, eckstolonol, phloroeckol, phlorofucofuroeckol-A, triphlorethol-A, trifucodiphloroethol-A, dioxinodehydroeckol, carmalol, diphlorethohydroxycarmalol
1.5.2.1 Physodes
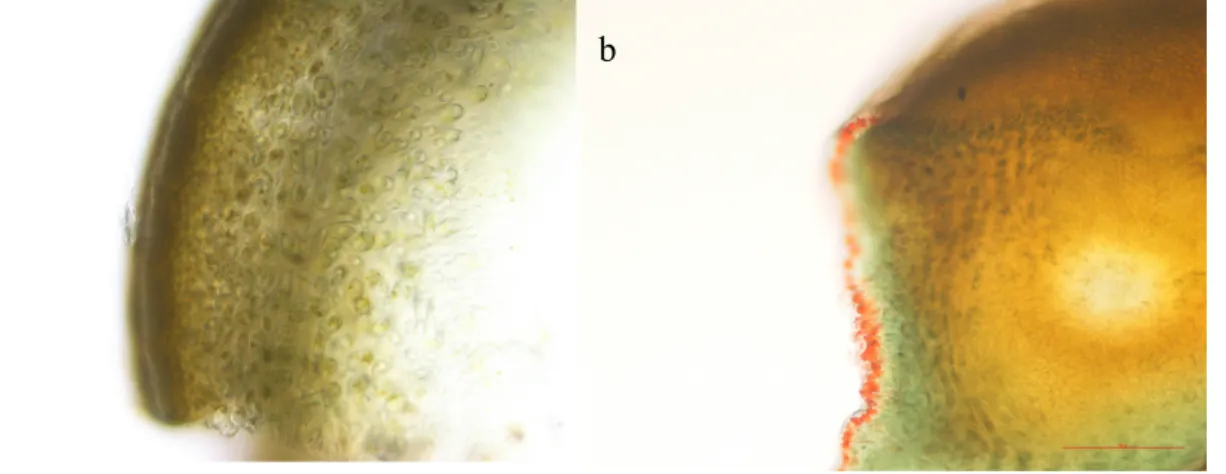
The distribution of phenolics in plants is not uniform at the tissue, cellular and sub cellular levels. Insoluble phenolics are found in cell walls, while soluble phenolics are present within the plant cell vacuoles (Pandey et al., 2009). Polyphenolic compounds are stored in membrane bound vesicles called physodes (Ragan, 1976). Looking into the specific location of phenolic compounds, in the cell tissue, gives us some insight into understanding the ecological and physiological functions of these compounds (Ragan and Jensen, 1978). Physodes are present in many stages of the algal life cycle, from the early development (spores, gametes, zygotes) up to the adult plant, in cell wall formation, in vegetative tissue, for adhesion, polyspermy prevention, defence and UV protection (Ragan, 1976, Schoenwaelder, 2008). They are found in the periphery of cells and perinuclear regions, where they are most likely produced, their size varies between 0.1-10 µm in diameter (Schoenwaelder, 2008). In the newest shoots, where there is more active growth, they seem to be richer in total phenols (Ragan, 1976).
Physodes can be stained and observed in fresh or fixed tissue, under light or electron microscopy (Schoenwaelder, 2008). Vanillin-HCl colours the physodes red, which is described as an efficient method by Ragan (1976) and can specifically detect phlorotannins (Shibata et al., 2004). Nevertheless, there are many histochemical staining methods specific Table 1. Distribution of phenolic compounds in Phaeophyceae. Adapted from (Stengel et al., 2011, Parys et al., 2010, Fernando et al., 2016, Wang et al., 2009).
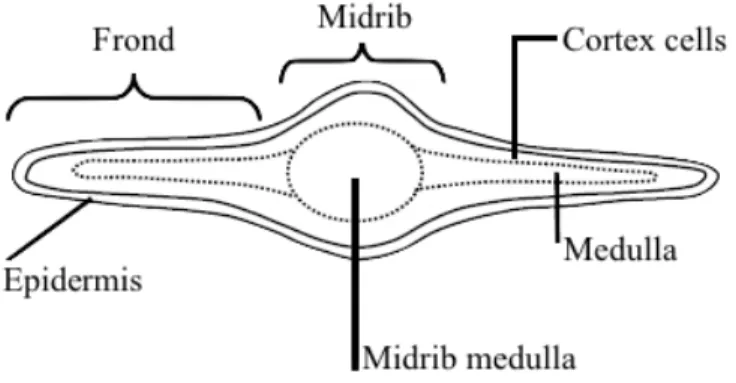
for available including osmium tetroxide, neutral red, toluidine blue O, fast red GG, and cresyl blue (Schoenwaelder, 2008). By light microscopy with vanillin-HCl staining, it has become clear that phlorotannins accumulate primarily within the vegetative cells of the outer cortical layer of brown algae, regardless of the variety of tissue, stage of growth or organ (Shibata et al., 2004). A few authors have contributed to the study of the polyphenols and physodes in F. vesiculosus (Baardseth, 1958, Ragan, 1976, Ragan and Jensen, 1977, 1978). However, considering that many used indirect methodologies of detection dependent on colorimetric reagents, for example, the Folin-Denis; a fresh overtake of this topic would be useful, to determine distribution and secretion of phlorotannis and phenolic substances in brown algae (Shibata et al., 2004). The morphology of the cell tissue in Fucus fronds is displayed in Figure 4. There are three main sections: the inner most layer is called the medulla, its filamentous cells are fully covered in mucilage; the middle layer is the cortex, comprised of cortical cells loosely arranged in some mucilage, lastly the epidermis, with photosynthetic cells closely packed together. The central area in the medulla midrib contains longitudinal filaments tightly packed together.
Figure 4 Arrangement of tissues in the F. vesiculosus frond, seen in a transversal section. Adapted from (Evert & Eichhorn
1.5.3 Extraction methods
Polyphenols are polar molecules that must be extracted from inside the cell wall, with minimum risk of damage to the compounds, by different means (Martínez and Castañeda, 2013, Safafar et al., 2015). Solvent polarity is very defining for the extraction yield and antioxidant activity. It interferes with the qualitative and quantitative analysis of extracted compounds and must have the ability to penetrate the cell wall and dissolve compounds of interest (Sineiro et al., 2008). In plant studies, highest yields are obtained with ethanol, methanol, and their mixtures with water, other utilized solvents are ethyl acetate or acetone (Sineiro et al., 2008).
Water (we), acetone (ae) ethanolic (ee), and methanolic (me) extracts have presented different results, on both TPC and antioxidant activities in the extraction of polyphenols from Icelandic seaweed (Wang et al., 2009). Water has been described as being efficient in extracting iron chelating compounds, in spite of being a poor solvent for phlorotannis (Farvin and Jacobsen, 2013). Meanwhile, acetone, ethanol and methanol are highly effective and yield large polyphenolic contents, in addition to having good radical scavenging capacity and reducing power results (Farvin and Jacobsen, 2013, Hermund et al., 2016, Wang et al., 2009). However, environmental concerns urge industries to switch from conventional solvents to more sustainable methods, for instance, the pressurized liquid extraction, when producing natural novel antioxidants (Hermund et al., 2016). There is a need for the improvement of fractionation and purification of bioactive components, which is certain to increase the activity and other potential health benefits, launching polyphenols as natural sources of antioxidants for commercial use (Wang et al., 2009).
1.5.4 Identification and quantification
Polyphenols are quantified through TPC usually determined by the FC assay (Singleton and Rossi, 1965). This method consists in the spectrophotometric detection between 725 and 765 nm, of a blue complex and molybdenum oxide, from the oxidation of phenolic rings, phosphotungstic and phosphomolybdic acids (Hermund et al., 2016). TPC units are expressed as phloroglucinol or Gallic Acid Equivalents (GAE) (Martínez and Castañeda, 2013, Farvin and Jacobsen, 2013). Phlorotannins tend to dominate within polyphenols, and consequently, the total phenolic content is often related to them (Wang et al., 2009, Farvin and Jacobsen, 2013). In Hermund et al., (2016) TPC also varied within the tissue location of the algae, younger tips had higher values than the older ones. Sometimes this method causes
uncertainty because non-phenolic substances can interfere and fall into the spectrum of phenolic compounds, causing an overestimation of TPC (Hermund et al., 2016).
HPLC is ideal to separate polyphenols, due to their polar nature and high solubility, and gives a rapid structural identification (Hermund et al., 2016). In order to fully identify and characterize polyphenols, advanced analytical methods must be applied, for example, tandem mass spectrometry (MS) and nuclear magnetic resonance (NMR) and could even be combined with HPLC (Hermund et al., 2016). In previous studies with F. vesiculosus, 13 phlorotannins isomers with molecular weights between 374 and 870 Da were identified by mass spectrometry, and the antioxidant activity decreased with increasing molecular weight (Hermund et al., 2016).
1.5.5 Antioxidant activity assays
Antioxidant assays have been used to characterize the antioxidant properties of polyphenols in F. vesiculosus (Arnold et al., 1995, Farvin and Jacobsen, 2013, Hermund et al., 2016, Wang et al., 2009). They can be determined by in vitro studies, which are simple, cheap and fast methods to characterize antioxidants (Hermund et al., 2016). This study focuses on two antioxidant activity mechanisms which will hereby briefly be discussed.
Polyphenols contain many hydroxyl groups bound to an aromatic ring making them very good candidates for donating protons to a radical, acting as chain breaking molecules or antioxidant upon secondary oxidation (Sineiro et al., 2008). Screening of substances with potential antioxidant activity and scavenging of free radicals is widely performed by using DPPH, a stable radical (Yang et al., 2008). Studies have shown that algal polyphenols are mainly responsible for the free radical scavenging activities of extracts, since high TPC correlates with high DPPH (Wang et al., 2009, Hermund et al., 2016). Though sometimes co-extracted active compounds also contribute to the overall scavenging effect, as is the case with fucoxanthin and sterols from 70% ae, and sulphated polysaccharides, proteins or peptides in we (Wang et al., 2009). Ferrous iron chelating indicates how antioxidants reduce oxidized intermediates into a more stable form, two neighboring OH groups (o-diphenol) are required in the structure, an essential characteristic for food and skin care products (Hermund et al., 2016).
Objectives
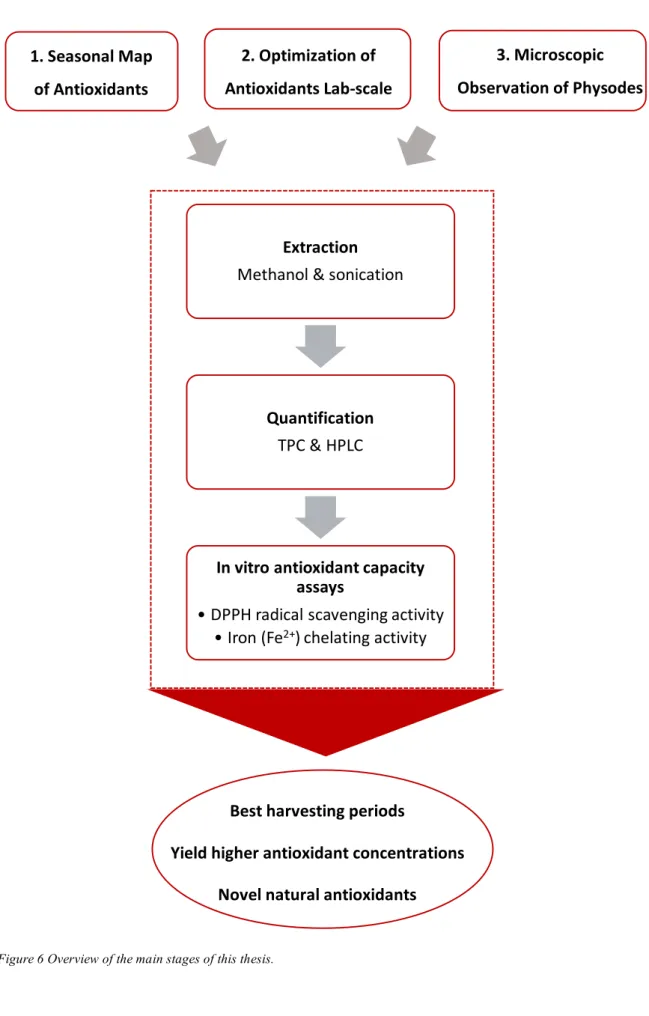
The aim of this project was to analyze the antioxidant variation in the seaweed F. vesiculosus, this was done through physical location of polyphenols, quantification of polyphenols and pigments, and characterization of antioxidant activities, by DPPH and iron chelating method. Fucus vesiculosus was furthermore evaluated as a potential source in the future development of natural antioxidants which is of interest to industries. This study was divided in three stages (summarized in a Fluxogram illustrated in Figure 6), the first being the mapping of the seasonal polyphenolic and pigment variations, by monthly samples throughout a year of natural populations, which was used to determine the optimal season for biomass harvesting and utilization. The second stage was the identification of optimized culture conditions in lab scale experiments, regarding salinity concentration and UVA light, to yield higher polyphenolic concentrations to be potentially used industrially. The third stage was imaging of the polyphenol content in F. vesiculosus by vanillin HCl staining and microscopy. The physical location of polyphenols gives information on the extraction methods and possibilities. As a complement to this work, the epiphyte coverage was evaluated qualitatively to gather knowledge on what species occur in the sampling region and at what time of the year they are most present.
1.1 Hypotheses
This study tested the following hypotheses:
H1 - There are seasonal differences in the polyphenolic content and activity of wild
F.vesiculosus, more specifically, late summer and early autumn months present the highest polyphenol values.
H2 – Increased salinity and UVA light increases the antioxidant yield, and therefore it
is possible to optimize F. vesiculosus antioxidant contents, in respect to these parameters.
The hypotheses led to the more specific tasks that were carried out:
Extraction and profiling of polyphenols and pigments from F. vesiculosus. Characterization of antioxidant activities from F. vesiculosus.
Evaluation of seasonal changes in the polyphenolic content of wild F. vesiculosus. Testing the optimization of antioxidant contents in F. vesiculosus cultured under
different environmental parameters, such as salinity concentration and UVA light exposure.
Microscopic evaluation of epiphytes and physodes in F. vesiculosus. 1.2 Learning objectives
General skills on sampling and identification of seaweed.
Conduct a lab-scale seaweed culture trial, including management and manipulation of seaweed.
Identification of optimized conditions, regarding salinity concentrations and UVA light presence.
Quantification of antioxidants: polyphenols and pigments
Biochemical analysis of seaweed biomass: antioxidant extraction, profiling and antioxidant capacity essays.
Determine the optimal season for biomass utilization in F. vesiculosus. Microscopic observation techniques, including staining of algal physodes.
General skills on data analysis (including statistics), interpretation, and discussion of scientific results.
1.3 Fluxogram Extraction Methanol & sonication Quantification TPC & HPLC In vitro antioxidant capacity assays • DPPH radical scavenging activity • Iron (Fe2+) chelating activity
Figure 6 Overview of the main stages of this thesis.
1. Seasonal Map of Antioxidants 2. Optimization of Antioxidants Lab-scale culture Best harvesting periods Yield higher antioxidant concentrations Novel natural antioxidants 3. Microscopic Observation of Physodes
Methodology
1.1 Sampling
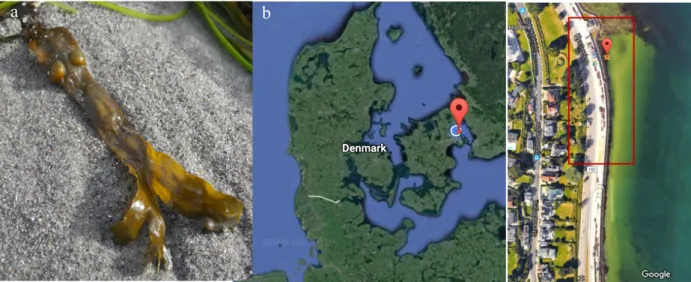
Wild F. vesiculosus (Figure 7a) was collected by hand, monthly, from June 2016 to May 2017. Additionally, fresh samples of F. vesiculosus were collected in March, to be used in polyphenol optimization experiments. They were conditioned at 10°C, with a 12h light photoperiod, 73,8 ± 14,4 µmol.s−1.W−1 photosynthetically active radiation (PAR) and »15
PSU salinity (Hermund et al., 2016, McLachlan et al., 1971). The collection site was along a 25 meter transect at the intertidal zone of Bellevue beach (55°46'17.4"N 12°35'48.4"E), North of Copenhagen, Denmark (Figure 7b). Samples were stored in a freezer room at -40°C, until further processing and analysis.
1.2 Environmental data
Environmental data was obtained from weather archives of the Danish Meteorological Institute (Cappelen, 2017). Monthly averages of mean temperature (ºC), precipitation (mm) and sunlight (h) were taken from June to August 2016 (Denmark) and from September 2016 to June 2017 (Lyngby-Tårbæk, the sampling location). Additionally, UV-dose 2017 measurements from Copenhagen and yearly projections were used in this study (Cappelen, 2017).
Figure 7 a) Wild F. vesiculosus frond Ó Madalena Mendes. b) Sampling location, Bellevue beach, Denmark Ó Google.
(1)
(2) (3) 1.3 Dry matter and ash contents
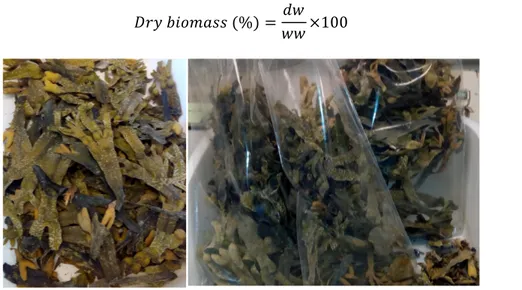
Samples were thawed overnight in a cool room and cleaned to remove holdfasts, epiphytes and bryozoans. Wet weight (ww) was determined gravimetrically after biomass was dapped with a paper towel, followed by freeze drying for 48 hours, using a Heto Drywinner (DW8, ThermoFisher Scientific), and dw measured gravimetrically. Then, each sample (representative of a month) was divided into triplicates of pooled individuals (Figure 8) and reduced to a fine powder using a sample mill (FOSS Tecator), for 30 to 40 seconds. Dry biomass was calculated as the dry to wet weight ratio multiplied by 100 as following:
!"# %&'()** (%) = /0 00×100
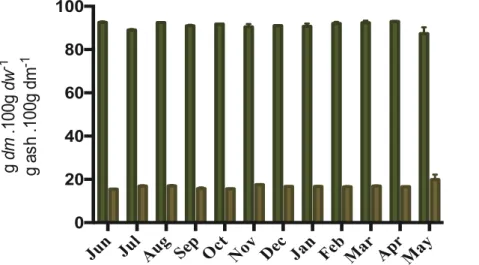
Dry matter (dm) was determined after drying the samples in an oven at 105 °C for 24 hours, until constant weight and ash content was determined by incineration in a muffle furnace at 550 °C for 6 h (Figure 9). Dry matter and ash content were calculated as following:
!"# ()445" 6 /(. 1006 /089 =/( /0×100 :*ℎ 6 )*ℎ. 1006 /089 =)*ℎ /0×100 b a
Figure 8 Freeze dried F. vesiculosus collected at Bellevue beach in June 2016.
1.4 Antioxidant profiling 1.4.1 Extraction
Polyphenols were extracted with a solid liquid extraction (SLE) using methanol and sonication, according to (Farvin and Jacobsen, 2013). A total of 0.600 g of powdered seaweed were added to previously weighed centrifuge tubes. Then, 5 mL of methanol were added and mixed at room temperature. The mixture was placed in the sonicator, for 30 min (Branson Ultrasonics, CA, USA) and centrifuged at 3500 rpm for 10 min (Sigma 4-16ks, Germany). The supernatant content was collected to a separate tube, filtered (0.45 µm), and evaporated under nitrogen flow (Figure 10a). Remaining residue was re-extracted around 9 times, under the same conditions. After evaporation, me were weighed and the absolute yield was calculated as following:
:%*'<=45 #&5</ 6 (5. 1006 /(−1 =(5 /(×100
Furthermore, the me of four months (2016: September; November; 2017: January and March) were analyzed by RP-HPLC, to identify simple phenolic compounds such as phenolic acids and flavonoids. After the previously described extraction process, the extracts were re-diluted in MeOH and loaded to a sulfonic acid 6cc mixed-mode cation exchange (MCX) cartridge (OASIS Waters, USA), to remove pigments. The cartridge was conditioned and equilibrated with 3 mL of MeOH, 5 mL of sample were loaded, and finally the cartridge was washed with 4 mL of MeOH. The volume was collected and evaporated under the nitrogen flow (Figure 10b). The new extracts were weighed and the absolute yield (g me. 100g dm-1 of seaweed) was calculated.
Figure 10 Polyphenol extraction process after nitrogen flow: a) test tubes with me b) Test tubes with me after removal of pigments with the OASIS MCX cartridge.
b a
(4)
(5) 1.4.2 Identification and quantification of Pigments
Pigments were analyzed bimonthly in triplicate samples, from July 2016 to May 2017, according to the method described in Safafar et al., (2015) with some modification. Pigment extraction was performed with methanol and sonication; and their quantification and identification by RP-HPLC. A total of 0,100 g of dried seaweed were weighed, and mixed with 3 mL of methanol (with 0.025 µg.ml-1 BHT). The test tubes were kept in a beaker with ice, covered with aluminum foil, and placed in a sonication bath, for 15 min (Branson Ultrasonics, CA, USA). The samples were then centrifuged at 5000 rpm for 10 minutes (Sigma 4-16ks, Germany), and the supernatant filtered (0.45µm) and collected to a separate tube. The remaining residue was re-extracted three times, under the same conditions, concluding a final volume of 10mL.
A total of 1 mL of each sample was placed in HPLC vials and analyzed immediately or kept in the freezer at -18° without light, and analyzed in the following morning. RP-HPLC analysis was performed with an Agilent 1100 series HPLC (Agilent Technologies, CA, USA) equipped with Diode Array Detector (DAD) (Agilent G13158). Moreover, a Zorbax Eclipse C8 column 150 mm×46 mm×3.5 µm from Phenomenex was used for the separation. Elution was performed with a mixture of solvent A (70% MeOH + 30% of 0.028 M tertiary butyl ammonium acetate in water) and solvent B (MeOH) at a flow rate of 1.1 mL.min-1, chosen as
the mobile phase. Retention times and peak were monitored and computed automatically by Chem32 integrator (Agilent, USA). DHI pigment standard mix (DHI LAB Products) was used as a pigment standard for the identification of peaks, and the pigments were detected at 440 nm.
Calculation of concentration of each individual peak of pigment (cpi):
?@& = A5*@'B*5 C)D4'" × !&<=4&'B C)D4'"× A5D'E5"# C)D4'" × ?)<&%")4&'B C)D4'" The peak areas and pigment identities were transferred to an excel file, and based on the response factors, the pigment concentrations were calculated:
?@& = FG HI × :J :K × :LM×AN& FD
Where APi and RPi are the peak area and the response factor of pigment Pi, respectively; Vx is the extraction volume; Mf is the weight of the sample; Vc is the amount
of sample injected onto the column; Ac is the peak area of the internal standard in the extraction solvent; and As is the peak area of the internal standard in the sample.
1.4.3 Identification and quantification of Phenolic compounds
Phenolic acids and flavonoids were identified through a chromatographic qualitative analysis, HPLC, by a modified method of Safafar et al., (2015). RP-HPLC was performed with an Agilent 1100 series HPLC (Agilent Technologies, CA, USA), equipped with a DAD (Agilent G13158). The separation was carried out on a Prodigy ODS-3 column 250 mm x 46 mm with 5 µm particle size from Phenomenex (Torrance, CA, USA).
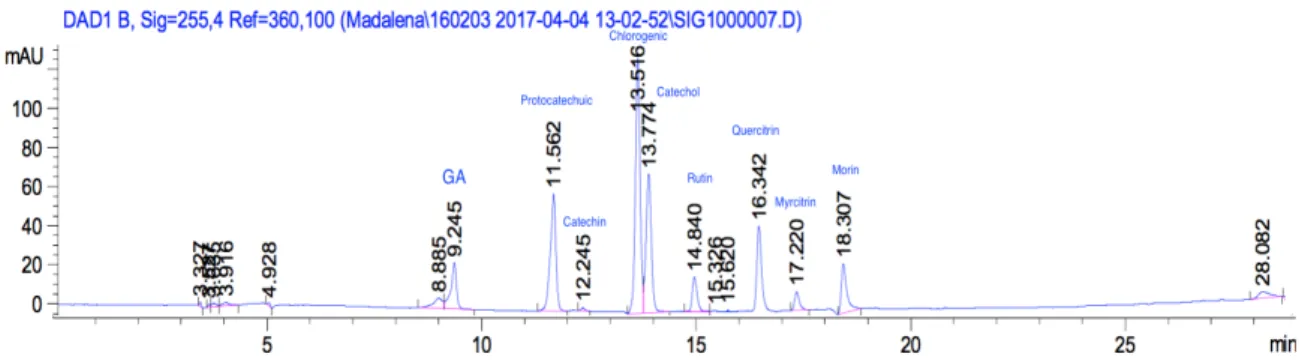
Elution was performed with a mixture of solvent A (Phosphoric acid in deionized water, pH=3) and solvent B (MeOH + Acetonitrile, 50:50 v/v) at a flow rate of 0.9 mL.min-1, chosen as the mobile phase, and the injection volume was 20µl. Detection was done using a DAD with reference wavelength of 255 nm. Retention times and peak were monitored and computed automatically by Chem32 integrator (Agilent, USA) and manually integrated when necessary. Identification of individual phenolic acids was done by the retention time of sample chromatographic peaks, being compared with the authentic standards under the equivalent HPLC operating conditions (Figure 11). Individual phenolic acids were identified by the retention time of sample chromatographic peaks being compared with those of authentic standards using the same HPLC operating conditions. Standards were Caffeic acid; Catechol; Cathechin; Chlorogenic; Coumaric; Ferulic; Gallic acid; Gentisic; Hesperidin; Hydroxybenzoic; Morin; Myricetrin; Protocatechuic; Quercitrin; Rutin; Salicylic; Syringic; and Vanilic.
Calculation of concentration of each individual peak of phenolics (Cphenolic):
(6) ?@ℎ5B'<&D = :"5) × A 5*@'B*5 C)D4'" × !&<=4&'B C)D4'"× A5D'E5"# C)D4'" × ?)<&%")4&'B C)D4'"
Figure 11 HPLC-DAD analysis (255 nm) of standard mix. UV chromatogram with labeled peaks according to the compound they represent.
1.4.4 Determination of TPC
Polyphenols were quantified spectrophotometrically by the determination of TPC, with the Folin-Ciocalteu (FC) assay method Singleton and Rossi (1965) according to Farvin and Jacobsen (2013) with some modifications. TPC were expressed as GAE mg.100 mg-1 of dried seaweed, and samples were run in analytical duplicates. An aliquot (100 µL) of extract (dissolved in methanol, concentration range from 0.6 to 3.8 mg. mL-1) was mixed with 0.75 mL of FC reagent (10 % in distilled water) and incubated, at room temperature, during 5 minutes. Then, 0.75 mL of sodium carbonate (7.5% in distilled water) was added to the mixture and incubated in darkness during 90 minutes. Total phenols were measured by the absorbance in a spectrophotometer at a wavelength of 725 nm (Shimadzu UV mini 1240, Duisburg, Germany). A standard curve plot with serial gallic acid solutions (0-100 µg. mL-1)
was used for calibration.
1.4.5 In vitro antioxidant capacity assays
To determine the antioxidant properties of the me, two antioxidant activity assays were used, the DPPH scavenging activity and the iron chelating activity.
1.4.5.1 DPPH radical scavenging activity
DPPH was used to evaluate the efficiency of the antioxidant scavenging effect of the extracts on free radicals and H-atoms donation, measured by the method described in Yang et al., (2008) and Farvin and Jacobsen (2013) with some modification. The activity of each extract was measured in serial dilutions, with analytical triplicates, at a concentration range of 0.0003-0.97 mg. mL-1. An aliquot (100 µl) of DPPH solution (0.1mM in 96% ethanol) was added to extract solution (100 µl). The mixture was agitated (600 rpm), and incubated in the dark, for 30 min at room temperature. The absorbance of the resulting solution (As) was
measured at 517 nm using a microtiter plate reader spectrophotometer (Biotek, Shimadzu, Holm & Halby, Denmark). The following controls were used: sample control (A0), 100 µl
extract + 100 µl EtOH; a sample blank (Ab), 100 µl DPPH + 100 µl MeOH; and finally, a
positive control (100 µl DPPH + 100 µl BHT).
Radical scavenging activity was calculated as follows and given as inhibition percentage (Farvin and Jacobsen, 2013). EC50 and 1/EC50 values were determined by plotting
(7)
(8)
1.4.5.2 Iron chelating activity
The iron (Fe2+) chelating activity of the extracts was estimated by the method described in Farvin and Jacobsen (2013), with some modification. The activity of each extract was measured in serial dilutions, with analytical triplicates, at a concentration range of 0.084-10.95 mg.ml-1. An aliquot of extract solution (100 µl) and distilled water (110 µl) were transferred into the microtiter plate. To start the reaction, ferrous chloride (20 µl; 0.5mM) was added and mixed (600 rpm), for 3 minutes. Then, ferrozine (20 µl; 2.5mM) was added, mixed again, and left at room temperature, during 10 minutes. The absorbance of the resulting solution (As) was read at 562 nm using a using a spectrophotometer (Biotek,
Shimadzu, Holm & Halby, Denmark). The following controls were used: sample control (A0), 100 µl extract + 150 µl H2O; a sample blank (Ab), reagents + 210 µl H2O; and finally, a
positive control with 100 µ of the metal chelator ethylenediaminetetraacetic acid (50 mM; EDTA) + 150 µl H2O.
The iron chelating capacity was calculated as follows and given as inhibition percentage (Farvin and Jacobsen, 2013). EC50, 1/EC50 EC30 and 1/EC30 values were
determined by plotting dose-response curves (GraphPad Prism 6), present in Annex C. Antioxidant Profiling.
Q"'B Dℎ5<)4&B6 )D4&E&4# (%) = 1 − :K− :O
1.5 Optimization of Polyphenols
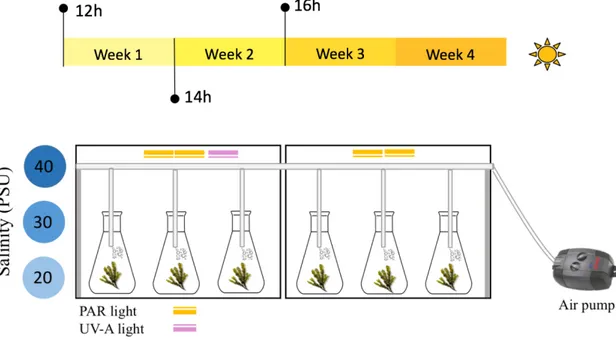
During a four-week trial, pooled individuals of F. vesiculosus were grown under two different lighting conditions (L1: PAR; L2: PAR+UVA); and three salinity concentrations (S20: 13.4±2.6; S30: 28.5±6.2; S40: 41.0±3.6 PSU). L1 and S20 represent control groups; L2 measures the influence of UVA light and S2 and S3 measure the influence of an increasing gradient of salinity. The combination of different light and salinities resulted in six treatments, each with triplicates (n=3). The experimental setup is displayed in Figure 12.
Seawater was collected from Bellevue beach and contamination was minimized by vacuum filtration (90 mm filter paper), salinity was adjusted with synthetic sea salt (Blue Treasure, Qingdao). The experiment was setup in a cold room, with fixed temperature of 10 ºC and the photoperiod was increased throughout the trial, from 12h to 16h light, to simulate the transition of seasons into summer. PAR light was provided by Grolux F36W lamps (Sylvania, Australia), UVA light by a 40 W UVA sunlamp (Philips, Holland), and foil paper enclosed the experimental area, to help distribute light evenly. Fresh thali of F. vesiculosus (10.38 ± 0.57 g) were sectioned, weighed, and equally distributed in 500 mL Erlenmeyer flasks (DURAN, Germany), sealed with parafilm and connected by 3 mm diameter tubing to an air flow supply system (Eheim 400, Germany). The flasks were randomly distributed and changed positions throughout the experimental trial (Figure 12).